Bitcoin in a short-term triangle?It seems Bitcoin is forming a triangle pattern (the blue solid lines) on its chart. we may see a short-term upward move from around 20k and retest around 21k again. be careful.
Finance

NatWest NWG 1dayShorting and take profit target 230p, only trading Friday. Share Price: 252.90Bid: 252.50Ask: 252.60Change: -3.90 (-1.52%)
they have a stock 13/14 reverse split on Tuesday 30th Aug 2022 and special dividend snapshot. expect volatility that week.

Cardano/Ada has a double bottom pattern in hourly timeframeAda has formed a double bottom pattern in 1h time frame. if it
break up its blue dashed resistance, we can expect the price to hit the first green bullish target on the chart.
fails and loses its green support line, we may head to the red bearish target on the chart
----------------------------------
I appreciate your support in any form such as sharing my ideas with others on social medias, leaving kind and heartwarming comments, donation, and etc.
If you showed your support from me by donating, please feel free to get in touch with me so I can get to appreciate you personally ❤️️

gbpjpy LongGBPJPY bullish Head & Shoulders pattern. Price can break downtrend channel with this pattern to start new uptrend...


Bitcoin last statusBitcoin is struggling to remove a crucial bearish trend (the orange one) if it succeeds, seeing the higher targets (the blues) makes sense.
if it fails to break up and stabilize itself there, it might end up a strong rejection and breaking down the strong green support zone. in this case, we could expect to see the bearish targets (the red ones).

ADA games startedAda put herself in a difficult process. Region 5156 is in strong support for the island because 2 support points were in joint protection. However, the island broke the support and now entered the key area. Area 5156 is currently the barrier to the island. Btc reaction may take the island to the 5156 region, but as long as spx does not close above 4300 and btc closes above 23500, the island will continue to be stuck between 5156-4904. It has turned into a risky position that requires maximum attention in closings under 4904.

EQUITAS HOLDINGS long swing trade first given the cup & handle
breakout and achived the target of FIB 1
then coming down
for the correction
and now taking support
at FIB 0.5 lavels and also at 50 EMA
from this lavels target
could be FIB 1.618 in
few days

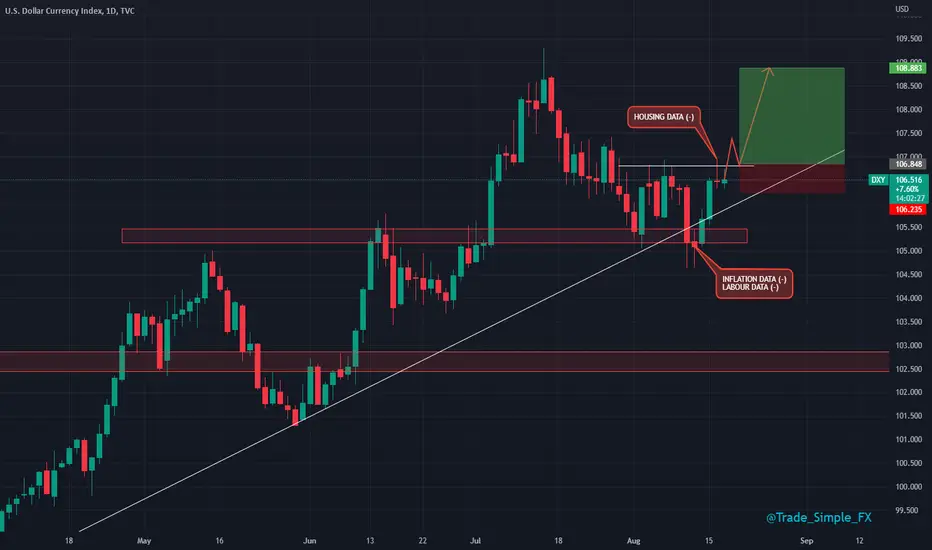
DXY D1 - Long SignalDXY D1
Still quietly confident that the dollar is going to take off upside, it's just a matter of time, the data points released haven't exactly been complimentary, but that being said.
The economic data points have been shaken off and we still expecting a dollar break of 107.00 we can then load up on our USD longs, commodities are still setup bearish, as per the above (and below to follow).
Heavy resistance at 0.012c - expect a short term reset to 0.0083I saw heavy sell orders in Binance around 0.012 mark. Though the sell orders aren't that massive - around 50 million LINA
BTC, SPX RSI shows overbought conditions, a correction is due, this will reset LINA too.
Though RSI shows bottoming process in LINA, the Huobi one is most accurate, because it was listed first over there. Actual price of LINA was 0.001 during listing but we went to
0.021 on listing day then 0.005, this isn't listed anywhere on TradingView.
The supply was three to four times less around 2021 Q1. at 40 M market cap we were around 0.04 price range, now at 40M cap we are around 0.01.
APY fluctuated between 80% at 0.10 and 160% at 0.005, now it is 95% at 0.001, which is still good fundamentally.

Cardano is forming a triangle for next hours?Apparently Ada is forming a triangle in 1h timeframe. the higher target could be around $0.546.

GBPUSD D1 - Bullish SetupGBPUSD D1
This is the bullish scenario here on cable, much more fond of the bearish continuation setup. Mileage is much better quantified, trading in line with the trend, general market correlation and the like. However, data has pointed bullish for cable during recent events.
Looking to see this week out and understand where cable and the DXY sits. Then we can resume trading next week. Hoping DXY can get off the ground and push towards 106 again, but we have analysis prepped for both flip sides of the coin.

Bitcoin - Above $25k, target $48kOnce Bitcoin breaks and holds 25K, expect a full retrace of the May/June 3AC meltdown. COINBASE:BTCUSD

Gold shorts on the back of USD bulls.Gold H4
Solid response to that $1800/oz price, +100 pips rejected already in quite quick succession.
Hoping to see this pair close with a solid H4 rejection, would be 'golden' to sit on this risk free ahead of US inflation data tomorrow, consensus dropped, but solid chance of outperforming consensus.

Selling pressure for cable as dollar catches bidGBPUSD H4
Monster rejection H4 candle forming at the moment, around 10 minutes until this H4 candle closes. To see this candle close red would be amazing.
Added another entry point short from 1.21, we traded this really well last week down from 1.22 region, these whole number on cable are playing out incredible, and have done for months.

USD/UAN Ritual devaluation of the Ukrainian UAN. Situation nowRitual figures on the chart that were ahead of the events in Ukraine.
The timeframe on the chart is 1 week.
57 weeks (12) Time
399 days 21 (management changes)
Potential maximum channel height + 303%
57 weeks. 399 days.
It all depends on how the price fixes in these important areas. Fixing the price above a certain zone will mean further growth of the dollar and the depreciation of the hryvnia.
Target
1 zone + 47%
2 zone + 173%
3 zone + 303%
A well-run crowd works like one foolish person.
This graph shows the 1 day depreciation of the hryvnia in 2014 on the timeframe.
At that time, there were well-known sad events in Ukraine. Maidan. Coup d'etat. The war in the Donbass. Detachment of the Crimea. All numbers in key areas are readable in meaning and not random.
The schedule and non-random numbers in key areas were far ahead of events in the country. And not all the way around as the crowd thinks.
On the chart, the timeframe is 1 day.
The former ritual devaluation of the hryvnia.
Growth 288 bar. (18) -666
402d (42) Destruction change. Maidan. The war in Ukraine in the Donbass in 2014. Detachment of the Crimean peninsula from Ukraine.
+ 310% (13 mirrored). The birth of a new government.
In order to always manage the herd, it is sometimes necessary to fulfill the insignificant desires of the sheep, so that faith in the herd is maintained that the wolf is not a wolf, but just a sheep in sheep's clothing.
In a herd, a person plays the role that the herd has formed and given to him. He is experiencing this role, he is comfortable in this role. Without this role, there will be the realization that he is a jerk, bio trash, one of many. Background player in a game. But when he is in the role, he is an important person, primarily for himself.
_____________________________________________
Coup d'etat. "Maidan" and ritual figures.
Coup d'etat. "Maidan" - Independence Square in Ukraine
November 21, 2013 - February 22, 2014.
Everything is clear according to plan with pedantic observance of all ritual terms for the owners. It is very important.
As we see the numbers are not random. 21 = our century + 18-666 + 3 (the birth of a new one).
22 - change of what is.
Pay attention to which digits of the pulses of the maxima.
13,111
33,711
The years for the implementation of this local project are also not random.
2013 (13 new management)
2014 (14 destruction of the old government).
Not understanding people that they do not decide anything in their life, but are just fuel in someone else's game, just makes them that fuel
_________________________________________________________________
Ukrainian bonds OBGZ and an hourly nuclear bomb for this country. The issue of OBGZ exceeded UAH 100 billion ($ 4.06 billion)!
This is a nuclear bomb with a clockwork for the Ukrainian economy, which would work without the global financial crisis.
The hryvnia will be in a very sad position.
What do you think is the secret to strengthening the hryvnia against the dollar in the fall of 2019?
The trick is issuing bonds of the internal state loan (OVDP) of Ukraine. For the first time in history, the issue of OBGZ exceeded UAH 100 billion ($ 4.06 billion) !!!
The vast majority of bonds owned by foreigners are issued in hryvnia (an average of UAH 98.17 billion, or $ 3.61 billion). The rest are issued in dollars and euros.
The Ministry of Finance on September 24 raised 13.2 billion hryvnias from the sale of government bonds.
Most of which came from 5-year bonds. Reports the Ministry of Finance of Ukraine.
The total volume of 5-year government bonds reached 33.9 billion hryvnia.
Weighted average rates of return were:
for 6-month government bonds - 15.89%
for 1-year government bonds - 15.09%
Who does not understand all the salt that the state is forced to pay anyway! Even if there is a collapse of the economy! And he will be! Only default announcements give the state the right not to pay interest to investors, but then there is a risk of lowering the country's credit rating. And this is tantamount to default. As in this case, Ukraine will be equal in carelessness for investment with African countries.
If directly without water, then the whole of Ukraine was completely sold for a temporary benefit before the financial crisis. All national enterprises and lands will be transferred to "investors" who will force Ukraine to pay debts on their investments. A default announcement will not save how the IMF will declare a loan to repay the same debt on bonds at a certain percentage. Ukraine owes huge amounts to the Navy. And every newly made temporary "king" is not averse to taking a loan from the IMF to appease the people during his reign. And what will happen then does not interest him.
Do you think local actors in the government did not understand this? No, everyone understood and I am sure all these billions are already where they are needed. In the future, no one was planning to pay a percentage of income to investors in Ukrainian bonds, as it is physically impossible even without a financial crisis. Just local authorities took the opportunity. And it is clear that this was an order from above.
_______________________________________________________________
EUR / RUB
I also did the EUR / RUB trading idea several days before the price increase at the lowest entry point when confirming support and the zone, I think this is also relevant, as it is the same trash currency.
Symmetric triangle. Trends Reversal zones.
The situation is now.
2 target achieved + 32%

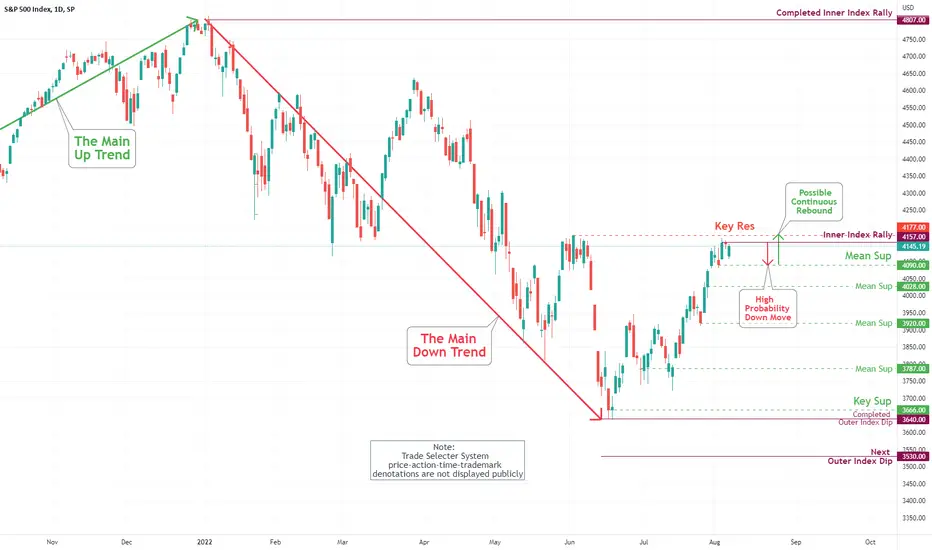
S&P 500 Daily Chart Analysis For August 5, 2022 Technical Analysis and Outlook
After completing our Inner Index Rally 4157, the index is in the mode of steady to higher - All things considered, the market will very likely retest not fulfilled Key Res 4177 before turning to the downside - Mean Sup 4090.
DXY D1 - Long term DXY Bull trend. DXY D1
Still working from these higher timeframes, the trends are very evident, we can't help but notice the higher structure HL's/HH's.
We have a sequence of earnings figures for US stocks and this has a knock on effect with the DXY and XAU. Fuelled by FED rate and FOMC comments... We have seen dollar pullback.
However, things data points and risk headlines are still in the backing of a USD dollar, and even with these corrections seen not directly correlating with data release... We are still holding structure. If 105.000 breaks, this could be the pivot.

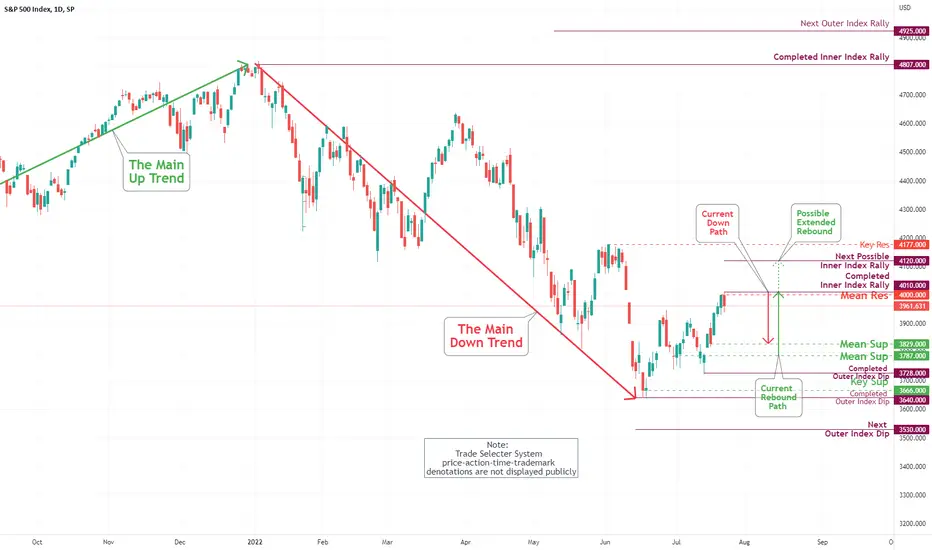
S&P 500 Daily Chart Analysis For July 29, 2022 Technical Analysis and Outlook
After retesting our completed Inner Index Rally 4010 and completing Inner Index Rally 4120 (As specified on S&P 500 Daily Chart Analysis For July 1), the index is steady to going higher - Inner Index Rally 4157 and Key Res 4177. All things considered, the market will very likely retreat and retest to Mean Sup 4028.

S&P 500 Daily Chart Analysis For July 22, 2022Technical Analysis and Outlook
After partially (July 18) fulfilling our down move, the index completed Inner Index Rally 4010. Currently, we have Mean Res 4000 in the making (Not confirmed by Trade Selecter System). However, all things considered, the market is very likely to retest Mean Sup 3829. before confirming and retesting the 4000 mark.
S&P 500 Daily Chart Analysis For July 15, 2022 Technical Analysis and Outlook
The S&P 500 market played out our down move to Mean Sup 3787 (See: S&P 500 Daily Chart Analysis For July 8). Currently, we have an upside momentum, and a retest of Mean Res 3912 is imminent, with a possible extended target to Mean Res 3940. Nonetheless, after that, the market will take us back to the Mean Sup 3787, completed Outer Index Dip 3728, Key Sup 3666, and very Next Outer Index Dup 3530 - this is a forward-looking mark.

Don't have a lot of hope for Blizzard right now. A predictionNot Financial Advice ~ A prediction
I think blizzard has met its newest level of resistance. In the upcoming weeks I expect ATVI to head back down to its latest level of support. To bounce back up, but I think the continuation bounce is going to be significantly lighter than the first.

Bitcoin's weekly RSI OVERSOLD! first time since $2k priceThis is the deep that we have been waiting for. I know we about to enter a DEPRESSION, theres no recession this time. But Bitcoin will be the fastest horse to get back to all time high after the depression is over by 2035
