$SOFI let's make some more money 👁🗨*This is not financial advice, so trade at your own risks*
*My team digs deep and finds stocks that are expected to perform well based off multiple confluences*
*Experienced traders understand the uphill battle in timing the market, so instead my team focuses mainly on risk management*
Today my team entered digital finance company $SOFI at $6.70 per share. Our take profit has been set at $10.
Our current portfolio: $MIRM, $SOFI, $BABA, and $EQX
Our entry: $6.70
Take profit: $10
If you want to see more, please like and follow us @SimplyShowMeTheMoney
Finance

Altria (MO) | Retesting The Breakout Area!Hi,
Since the end of 2020, Altria has started to show its strength by giving us a higher low. Since then it managed to push above the long-lasting downwards trendline which started from ATH at the beginning of 2017. Made a quite solid breakout with a strong and powerful candle as needed. To be said, if it is a strong trendline then it needs a lot of power to push through it and it got it.
The break smashed a couple of good criteria: managed to push above the downwards trendline, managed to break above the 50EMA, managed to break above mid-number $50, and managed to make a now and strong mid-term higher high! Quite impressive!
After the perfect trendline retest, it created another higher low and pushed into new HH above $50 and above a strong horizontal area.
Ńow, it has started to approach another retest and the price of Altria has reached inside a possible buying area.
Technically it would be a great investment which is supported by 50EMA, strong horizontal area, mid-number $50, minor trendline, and historically a strong horizontal price zone around $50.
Do your own research and if it matches with my TA you are ready to go.
Regards,
Vaido

Shriram City Finance BreakoutThe stock has broken out and retested, therefore may undergo a reversal rally. Trade is supported by Supports Nearby.
Risk Reward Ratio - 2:1
SL is placed below the support zone & the lower trendline. The target is placed near resistance.

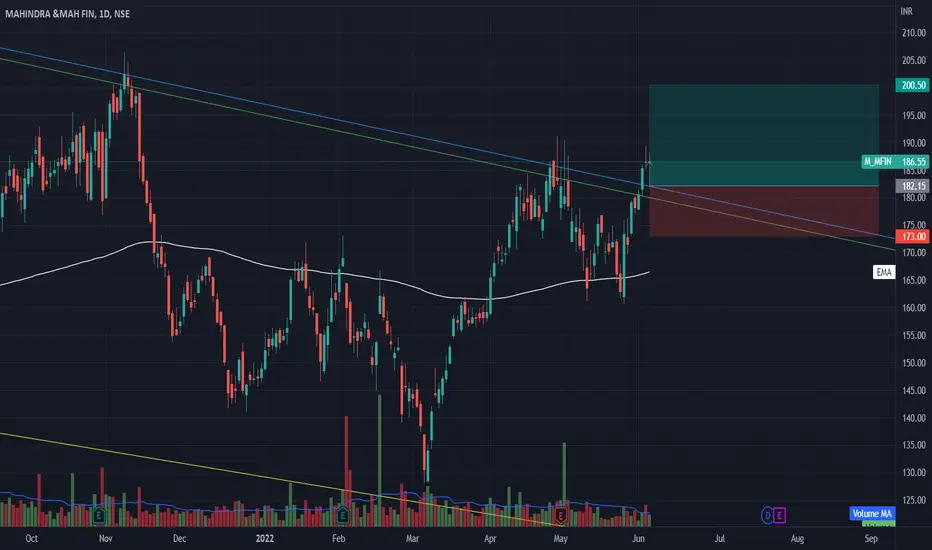
M&M Finance BreakoutThe stock has broken out and retested, therefore may undergo a reversal rally. Trade is supported by Supports Nearby.
Risk Reward Ratio - 2:1
SL is placed below the support zone & the lower trendline. The target is placed near resistance.
SQ - Block it out until JulyShort-term bullish for SQ Block from here. A 100% move into July is looking increasingly likely @ $170. This would be a re-test of the MA for resistance. It also coincides perfectly with a 0.382 fib retracement from the downtrend.
RSI is very oversold and making a higher low. There's now divergence vs the price - which is making a higher low.
We're also at the bottom of the purple exponential channel, having found support there. Same for horizontal support created first in 2018.
Stop loss down at 74, which is where we'd signal a new lower low (12%). Risk/reward is 33:1.
Entry will be confirmed on breakout of the dotted trend line - which many others have already made today.
Fundamentally, SQ is a strong business and profits were up 34% for the year. Price to earnings is still very high, but for a short-term trade - this seems like a great countertrend move to profit from until 2 months time.

What we doing on SPY Flag.. Rip.. Dip.. Whats happening? What are we doing?' Maybe it was just a pullback..
I think we breakout over $408.50

NASDAQ UPDATE 'Wedbush Tech Playbook'The Value Tech with Strong End Markets group of companies includes Nice (NASDAQ:NICE), Verint (NASDAQ:VRNT), and Progress Software (NASDAQ:PRGS). Finally, top EV names to consider are Tesla, LiCycle (NYSE:LICY), Xos (NASDAQ:XOS), and Hyzon Motors (NASDAQ:HYZN).

Spotify (SPOT) | Inside The Buying ZoneHi,
Criteria:
1. Clean channel projection and couple of short-term rejections from it.
2. Round number $100
3. Liquidity area
4. Fibo Extension
Do your own research and if it matching with my TA you are ready to go.
Regards,
Vaido

S&P500 PRICE CONFIRMATION @4300 RESISTANCES&P500 - We can see lower lows formation and also price confirmed 4300 resistance zone once gain. It went down to break previous lows and bears are in the control. However, it is possible to see bullish move soon.
Hourly indicators and moving averages are giving us sell signal.
*Keep on mind that these indicators and moving averages don't predict future moves and many times can give wrong signals.

Adobe (ADBE) | Quite Close To Technical Buying Area!Hi,
Criteria inside the box:
1. 50% drop from the ATH
2. Strong horizontal levels
3. The trendline
4. EMA's from different TFs
5. Mid-numbers
Do your own research and if its matching with mine then you are ready to go.
Regards,
Vaido

NIO (NIO) | Starting To Get Attractive Around $10Hi,
Criteria:
1. Channel projection (quite subjective)
2. Mid-number $10
3. Fibo Extension
4. Previous minor resistance can play a role inside the zone
5. Potential gap fill
Do your own research and if it matches with mine you are ready to go.
Regards,
Vaido

Skyworks Solutions (SWKS) | Stormy Times-Technically In The ZoneHi,
Criteria:
1. The trendline
2. Strong multi-yearly resistance becomes support
3. Fibonaccy retracement 62%
4. Round number $100
5. 50% drop from ATH
6. Some EMA's from different TFs are in the zone
Do your own research and if it matches with my TA then you are ready to go.
Regards,
Vaido

$SOFI earnings next week 👁🗨*This is not financial advice, so trade at your own risks*
*My team digs deep and finds stocks that are expected to perform well based off multiple confluences*
*Experienced traders understand the uphill battle in timing the market, so instead my team focuses mainly on risk management*
Today my team entered digital finance company $SOFI at $6.70 per share. Our take profit has been set at $10.
Earnings are expected to be reported next week.
Our entry: $6.70
Take profit: $10
If you want to see more, please like and follow us @SimplyShowMeTheMoney

My Technical Analysis NZDUSDTHello every traders
I hope all you have a good week in your trades
I want to talk with you about NZDUSD , because its on support zone and we can have a correction .
This is article not financial advice, always do your own research .
If you have any questions, you can write it in comments below and I will answer them.
And please don't forget to support this idea with your like and comment, thank you.

DXY H4 - Short Signal (dollar highs)DXY H4
Bank holidays yesterday, typically lighter conditions than usual, but not sure that was the case, we saw some decent moves.
Normal volume expected today, dollar seems to be topping out as we challenge an attempt to set a new high. Lets see how this 10am H4 closes. Could be time for a dollar correction.

Advanced Micro Devices (AMD) | Approaching Strong Support Zone!Hi,
2022 first Q results on May 3.
Technical criteria:
1. Strong horizontal price areas
2. Mid-number $50
3. Channel projection
4. AB=CD
5. Fibo retracement
6. Fibo Extension
7. Different timeframe EMA's
8.* 50% from ATH
Do your own research and if it's matching with my TA you are ready to invest.
Regards,
Vaido

Gold D1 - Short SetupGOLD D1
Gold seeing some break and retest play. Zones have been broken and well respected. Solid wick retest into that 1917 region before then seeing the same play around that 1900 price.
Target it 1827 respectively... with 1850 being the next area of support if we can blitz through this 1880 active support.

Amazon (AMZN) | 2018/19 Resistance Becomes Support!Hi,
A lot has happened, a lot to come but still cannot stay quiet to not share the technical buying zone for AMZN.
Criteria:
1. The trendline
2. Different TF EMA's
3. Strong resistance becomes support
4. Round number $2000
5. AB=CD
6. Fibo levels
7. Fibo Extension
8. 50% drop from ATH
Do your own research and if this matches with my TA you are ready to go.
Regards,
Vaido

$APE $APE $APE BEARISH BULLISH BEARISH
As we can see the market is currently bearish
on the 4hr.
BINANCE:APEUSDT
After creating a double top @24$ and stochastics
making a lower high. The market dumped hard.
Thereby failing to break the highs of 28$.
The trendline got broken and now we are
expecting a good pullback this neww week
to form a new lower high. Then a new low.
Before that happens, it will be best to see
price first tap 15.55$. Then we would look
for exhaustion around that area, when we
see it, Entries will be on lower timeframes.
16.25$ is also another level to watch out for
reversals.
Wish us a successful trading week ahead.
#$KC #Meekhillacademy #RICHMMDT

What do you think might happen in the next few days?Cardano must regain his composure as soon as possible ...
The issue is complicated for Cardano

DXY D1 - Short SetupDXY D1
As mentioned in the technical rundown video above, huge month of gains for the dollar this month. Month end flows possible for institutional rebalancing, already seems as though dollar wants to give back some-what.

DowjonesHi, here you have an analysis of the dowjones chart, we expect to have small move down at the beginning of the week to form the week lows, then we will take buy positions from the zone we consider it is a retest of both broken downtrend and the retest of the uptrend.
good luck !

Understand Commodity Price Speculation using a logarithmic scaleThere are two main reasons to use logarithmic scales in charts and graphs.
The first is to respond to skewness towards large values, cases in which one or a few points are much larger than the bulk of the data.
The second is to show percent change or multiplicative factors.
