USDJPY H4 - Short SetupUSDJPY H4 - Had this one marked up since Monday afternoon with that 107.250 region/retest zone in sight. Didn't respond to the supply zone, but consolidated and have now seen the rejection. Trendlines very discretionary, listen to the video rundown.
Finance

EURCHF H4 - Long Trade SetupEURCHF H4 - Still on fire the EUR edges higher, we broke that double top zone yesterday, saw a nice couple of H4 retests and have since taken off. Next area of resistance is 1.07600, a break of this should see up edge higher.

CADCHF H4 - Short Trade SetupCADCHF H4 - Broken the support zone on that previous closed H4. Retests due for entries short. Descending triangle and retest of S/R so two possibly short entry points, the initial parameters marked with entry, stoploss and take profit should seem most likely, given the fact 0.69200 is now a region of supply.

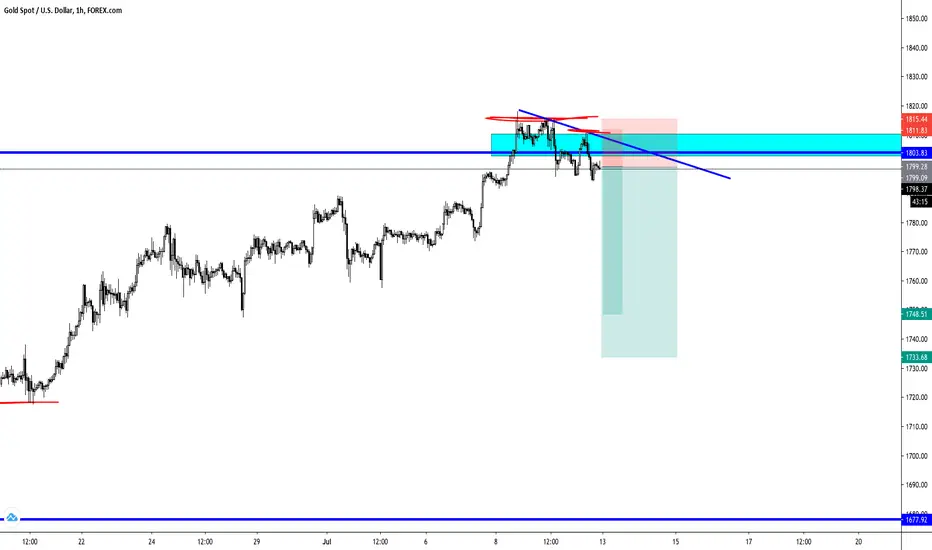

Gold H1 - Long Trade SetupGold H1 - Absolutely flying without any real retest of that 1785 number! Sitting 300 pips above that previous resistance without any real pullback. Saying that, we haven't even really had a retest of 2012 highs at 1795. Just want to keep following this pair and seeing if we keep breaking the new high levels.

CADJPY H1 - Long Trade SetupCADJPY H1 - Also moving really nicely, probably going to find a bit of resistance in the next 10-15 pips or so I imagine, need to break that counter trendline to maintain upside momentum.

BITCOIN | Minor Break on DailyHi,
The price of Bitcoin has made a tiny statement to the higher prices. In general, these breakouts are pretty promising but at the moment we have such a ranging market that can lower the success rate.
Still, worth to try it:
1) A daily break above the counter-trendline (blue)
2) Daily EMA50 acting as a support
3) 4H EMAs acting as support levels
4) 1H EMAs acting as support levels
5) Retest/entry area acting as a support
Regards,
Vaido


LUFTHANSA (LHA)Hi,
Strong support 8.000 - 9.000
Technical criteria:
1) Historically worked support level. 1995, 2003, 2009, and 2012. All rejections have been extremely profitable.
2) 2x equal waves from the top AB=CD
3) Fibonacci Extension 162% and 127%
4) Orange minor trendline third touch
5) Channel projection lower trendline worked perfectly
Regards,
Vaido

TALLINNA KAUBAMAJA (TKM1T)Hi,
Strong area 7.80 - 8.20
Technical criteria:
1) Rejection from the trendline
2) Rejection from the Monthly EMA 100
3) Fibonacci retracement 38%
4) Got a rejection from the channel lower trendline, considered as a bullish chart pattern called Bull Flag
Regards,
Vaido

SIAULIU BANKAS (SAB1L)Hi,
Strong support 0.27 - 0.31
Technical criteria:
1) Previously worked strong support level (2009)
2) Fibonacci retracement 62%
3) Fibonacci Extension 162%
4) 50% drop from the recent high
5) Minor trendline
Regards,
Vaido

COCA-COLA (KO)Hi,
Strong support 29 - 34
Technical criteria:
1) The trendline since 1989
2) Previous 2007/08 resistance level start to act as a support
3) Fibonacci retracement 62%
4) 50% drop from the recent high guides the price exactly to the green box, acting as a support.
Regards,
Vaido

YARA INTERNATIONAL (YAR)Hi,
Strong support 330 - 350.
Technical criteria:
1) The trendline since 2009
2) 2010 clean resistance matching perfectly with the trendline
3) Monthly EMA 100
Regards,
Vaido

NETFLIX (NFLX)Hi,
Strong support 330 - 375.
Technical criteria:
1) The trendline since 2016
2) 2018/2019 resistance become support
3) Weekly EMA 100 (blue)
4) Weekly EMA 200 (red)
Regards,
Vaido

STORA ENSO (STERV)Hi,
Strong support area 9.500 - 10.500.
Technical criteria:
1) Rejection from the trendline
2) Rejection from the Fibonacci retracement 62%
3) The round number 10.000
4) 50% drop from the recent high acting as a support
5) Historically really strong horizontal area acting currently as a support
6) Monthly EMA 100
7) Monthly EMA 200
Regards,
Vaido

EQUINOR (EQNR)Hi,
Strong support around 115 - 130.
Technical criteria:
1) Historically the third strong rejection from the round number 100
2) Rejection from the Fibonacci retracement level 62%
3) Historically strong support area
4) 50% drop from the recent top acting as a support
5) The trendline
Regards,
Vaido

SWEDBANK (SWED_A)Hi,
Strong support around 100 - 117.
Technical criteria:
1) Rejection from the round number 100
2) Rejection from the Fibonacci retracement level 62%
3) Previously worked tiny resistance levels become support
4) 50% drop from the recent high acting as a support
Regards,
Vaido

Bank of America small relief rallyafter a massive dump, believe we see a small rally and then another leg lower.
eXp World Hldngs $EXPI "SKY"$EXPI most likely will not stop till touch the pivot resistance
12 months Consensus Price Target: $17
if you find my charts useful, please leave me "like" or "comment".
Please don't trade according to the ideas, rely on your own knowledge.
Thx

Cannae Holdings $CNNE $CNNE is close to buy point of $40.27. I would watch for volume above the average before you get in.
12 months Consensus Price Target: $43
if you find my charts useful, please leave me "like" or "comment".
Please don't trade according to the ideas, rely on your own knowledge.
Thx

NZDCAD H4 - Long SetupNZDCAD H4 - Pushing resistance, now, looking to see a rejection and selloff back downside. This has always been a better setup to buy from support, rather than to sell from resistance. Purely because it's bullish consolidation and the wick zone is clearer from support than resistance.

EURAUD H1 - Long Trade SetupEURAUD H1 - Range box still intact, had a couple of bounces from this zone since we last had this marked up. Support is seeing responses but yet to have bounced enough to test resistance price.
