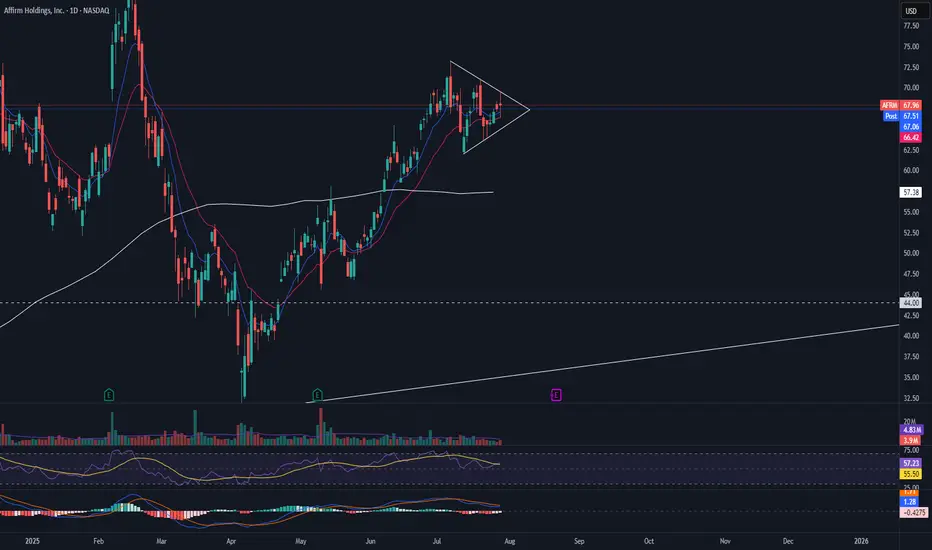
AFRM pre earnings triangleAFRM is currently in a symmetrical triangle with RSI and MACD beginning to show the pattern may come to an end. I would want to see this triangle break with volume before entering a long position.
Financials
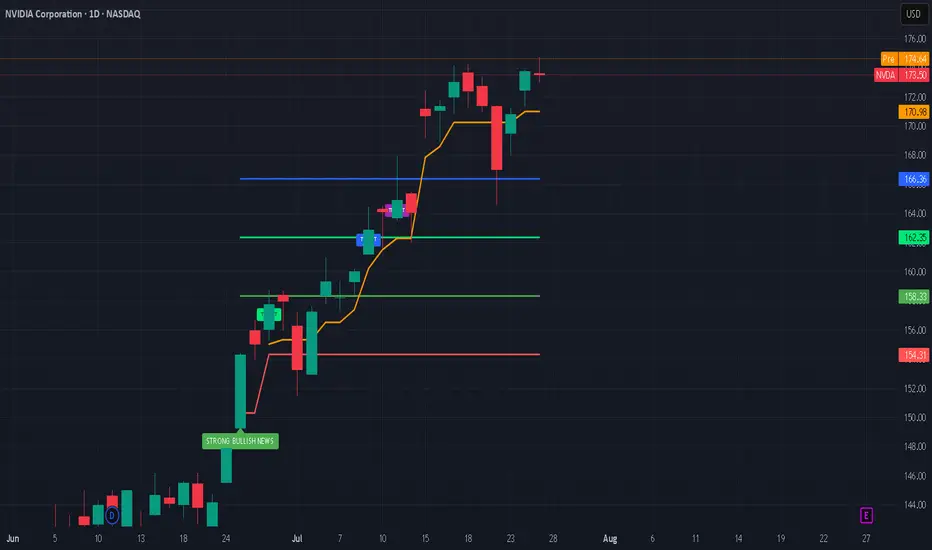
Nvidia’s Historic 2025 Stock Rally: What’s Driving It?Nvidia’s stock has once again captivated Wall Street in 2025, breaking records and fueling debates on whether its blistering momentum will continue or eventually ease. Here’s an in-depth look at why Nvidia is surging, the key drivers behind the rally, and what the long-term future could hold.
Nvidia’s Stock Rally: By the Numbers
As of July 2025, Nvidia stock has rallied more than 39% year-to-date, reaching new all-time highs above $170 and propelling the company’s market cap past $4 trillion, the largest in the world.
The stock has added nearly $2 trillion in valuation since April, outpacing tech giants like Microsoft and Apple.
Analyst price targets for the rest of 2025 vary: the average ranges from ~$174 to ~$235, with bullish forecasts up to $250 and more cautious targets down to $135.
What’s Powering the Rally?
1. Surging AI Demand:
Nvidia remains at the center of the artificial intelligence (AI) boom. Its graphics and AI accelerator chips (notably the new Blackwell AI family) are the backbone of AI infrastructure for Global Tech firms (Amazon, Meta, Microsoft, Google) and cloud service providers. This AI-centric demand has kept revenue growth robust and margins high (approaching 70%).
2. Easing China Trade Fears:
Earlier in 2025, U.S.–China export controls severely restricted Nvidia’s sales of advanced AI chips like the H20 to Chinese customers, causing a temporary selloff. However, a subsequent pause on tariffs by the U.S. and optimism about renewed China shipments reignited investor confidence, helping reverse earlier losses and extending the rally.
3. Massive Tech Investment Cycle:
The global rush to build out AI infrastructure is bringing huge investments from U.S. and international hyperscalers. Meta and Amazon alone have announced plans to pour “hundreds of billions” into AI data centers, much of it destined for Nvidia-powered hardware.
4. Strong Fundamentals and Diversification:
Nvidia sports some of the highest profit margins among mega-cap tech stocks. Its free cash flow, dominant market share, and expanding ecosystem, including platforms like Omniverse (for 3D and digital twins) and Drive (autonomous vehicles)—cement its leadership well beyond just chips.
What Could Slow Nvidia Down?
Despite the excitement, several risks linger:
Valuation Concerns: Nvidia trades at a premium (P/E above 50 for trailing earnings), raising worries of a pullback if growth slows.
Geopolitical and Regulatory Threats: Further U.S.-China tensions, new export regulations, or rising competition from rivals like AMD, Huawei, or custom silicon at cloud giants could erode growth or margins.
Cyclicality of the AI Boom: Some market watchers worry that AI infrastructure spending could prove cyclical, making Nvidia’s revenue growth more volatile in future years.
The Long-Term Outlook (2025 & Beyond)
Bullish Case: Most analysts expect continued dominance for Nvidia as AI, autonomous vehicles, robotics, and edge computing keep growing exponentially. Price targets range as high as $250 for 2025, climbing to $1,000+ by 2030 if AI adoption continues its rapid expansion.
Base Case: Moderate growth continues into 2026–2027, with a price target cluster around $180–$235 (2025) and $200–$428 (2027), assuming AI demand moderates, margins remain stable, and Nvidia fends off competitive threats.
Bearish Case: If U.S.-China relations sour and hyperscaler spending slows, the stock could retest support levels ($135–$150). However, few analysts expect a sustained collapse unless there is a fundamental change in AI or chip technology trends.
#nvda #stockmarket #finance #revenue #profit #financials #economy #technology #ai #chips
Bearish potential detected for SDFEntry conditions:
(i) lower share price for ASX:SDF along with swing of DMI indicator towards bearishness and RSI downwards, and
(ii) observing market reaction around the share price of $5.89 (open of 20th June).
Stop loss for the trade would be:
(i) above the potential prior resistance of $6.08 from the open of 4th December 2024, or
(i) above the potential prior resistance of $6.19 from the open of 3rd July 2024, depending on risk tolerance.

Bullish potential detected for BOQEntry conditions:
(i) higher share price for ASX:BOQ along with swing up of indicators such as DMI/RSI.
Depending on risk tolerance, the stop loss for the trade would be:
(i) a close below the 50 day moving average (currently $7.83), or
(ii) below previous swing low of $7.69 from the low of 23rd June, or
(iii) below previous support of $7.60 from the open of 12th May.

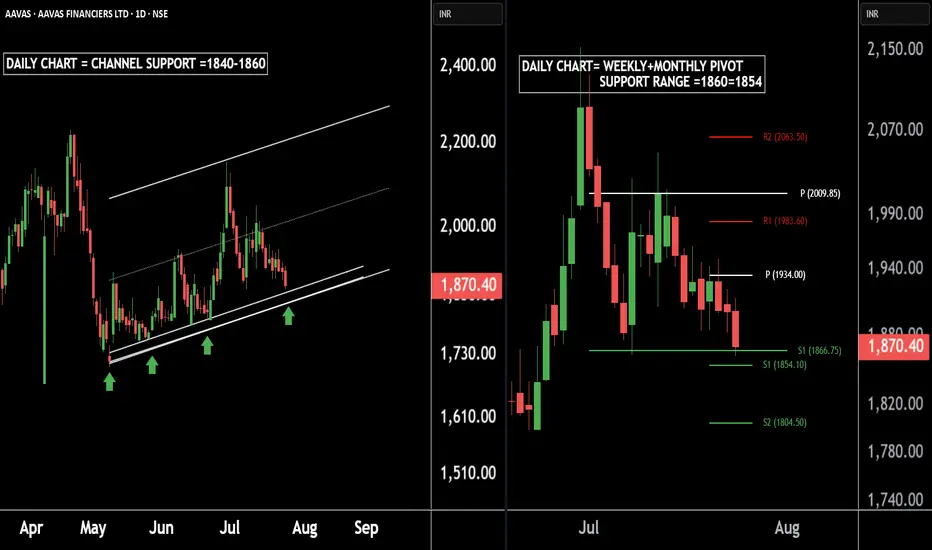
AAVAS Housing – A Hidden Gem for Medium-Term InvestorsThere are two charts of AAVAS FINANCIERS.
On the first chart AAVAS FINANCIERS is moving in a well defined parallel channel with support near at 1840-1860.
On the second chart AAVAS FINANCIERS is taking Weekly + Monthly support near at 1866-1854.
If this level is sustain ,then we may see higher prices in AAVAS FINANCIERS LTD.
Thank You !!
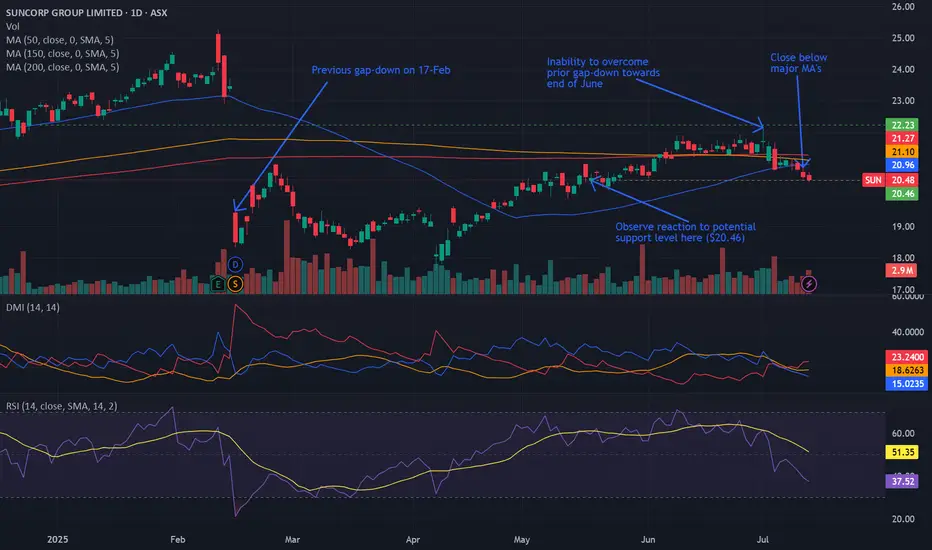
Bearish potential detected for SUNEntry conditions:
(i) lower share price for ASX:SUN along with swing of DMI indicator towards bearishness and RSI downwards, and
(ii) observing market reaction around the share price of $20.46 (open of 19th May).
Stop loss for the trade would be:
(i) above the potential prior resistance of $21.36 from the open of 5th June, or
(i) above the high of the recent swing high once the trade is activated (currently $22.14 from the high of 1st July), depending on risk tolerance.
Potential outside week and bullish potential for CNIEntry conditions:
(i) higher share price for ASX:CNI above the level of the potential outside week noted on 4th July (i.e.: above the level of $1.795).
Stop loss for the trade would be:
(i) below the low of the outside week on 30th June (i.e.: below $1.655), should the trade activate.

NewtekOne | NEWT | Long at $10.92NewtekOne NASDAQ:NEWT is a financial holding company providing business and financial solutions to small- and medium-sized businesses across the U.S. Services include Newtek Bank, business lending, SBA loans, electronic payment processing, payroll and benefits, insurance, and technology solutions. While the stock has taken a major hit recently, insiders have scooped up over $1 million in shares with an average price of $11.70. Currently trading at a P/E of 5.6x, forward P/E of 6.6x, and near book value, the stock may be poised for a move up soon with the anticipation of interest rates dropping. Revenue is up 24.93% from $271.15M (2023) to $338.73M (2024) and earnings are forecast to grow 11.63% per year, but the company does have a high debt-to-equity ratio (over 5x).
Tariffs could indirectly impact NASDAQ:NEWT by increasing costs for its small- and medium-sized business clients, particularly in industries reliant on imports (e.g., manufacturing, retail). Higher costs may reduce client profitability, increasing loan default risks or reducing demand for Newtek’s lending and payment processing services. But an interest rate reversal may greatly limit the impact (longer-term).
So, at $10.92, NASDAQ:NEWT is in a personal buy zone.
Targets into 2027:
$12.00 (+9.9%)
$14.00 (+28.2%)

Last week Bitcoin created massive liquidity at a key resistance!🚨 Bitcoin Update – A Bullish Storm Is Brewing? 💥
Last week, Bitcoin created massive liquidity at a key resistance zone, and guess what? That liquidity is still untouched. The market hasn’t fully tapped into it yet — and that’s a big deal.
Recently, BTC smashed through resistance and even left behind a Bullish Fair Value Gap (FVG), signaling strength. But hold on—after this breakout, the market is showing signs of a minor pullback, likely to retest its marked IRL (Important Reaction Level).
📉 It’s cooling off temporarily... but don’t blink. This zone could act as a springboard for the next big leg up.
💡 Here’s the kicker: there’s still a ton of liquidity waiting above. If the market wants it—and it usually does—there’s a high probability (80%+) of another bullish push.
👀 Watch this area closely. It’s a make-or-break zone.
📊 Do Your Own Research (DYOR) – this is not financial advice, just a friendly nudge from the charts.

COINBASE and it's massive inverse head and shoulders...observed in Coinbase chart formation indicates it has potential to become a trillion-dollar enterprise!
With a Logarithmic projection heading towards $4000 per shares.
#COIN has a market cap off $66 Billion right now
It has as just entered the SP 500
Is in the process of receiving a Banking Licence
And is the main custodian for all the major #crypto ETF's
Those are the drivers why this is likely to be a four figure stock in the coming years.

Why Financial Clarity Comes Before Any Forex Trade?Before any strategy or setup, I ask one thing: is my personal financial foundation strong enough to support this trade?
In this reflection, I explore the direct impact that personal finance management has on trading performance — not as an abstract idea, but as a daily reality. When financial clarity is missing, emotional decision-making creeps in. When it’s present, I trade with more patience, discipline, and perspective.
This is not trading advice. It’s a caution to those who see trading as a way out, rather than something built upon stable ground.
Guess what? I am on a Demo Account. I will keep on trading on a Demo Account until I know that I have a solid risk management plan and a trading methodology that both will give me consistent profits.
The whole Idea with personal finance management in forex trading is to know whether you can afford trading and once you know the answer to that what is your game plan.
Just a quick hint.. If your answer is no; meaning that today you cannot afford trading, don't be discouraged, there is still a plan that can be designed. Actually, I think the ones who cannot afford trading are in a better positions than those who can.
The ones who cannot afford trading today, can easily start learning without having the itch to open a live account.

9 Simple Ratios Every Great Investor Uses - Buffett Included!Forget the hype, headlines, or hope. These 9 financial ratios are what real investors actually use to pick winners, but...
P/E? ROE? EPS? 🧐
- What are they, or better yet, WHO are they? 🤯
- How high is “too high”?
- Is a low number always good, or just a trap?
- Do all industries follow the same rules… or is that another myth?
Buffett. Greenblatt. Graham. Lynch.
They didn’t rely on vibes — they trusted fundamentals
After years of relying on charts, I built a 9-point fundamentals checklist to filter stocks faster and smarter. Now I’m sharing it with real-life examples and key insights to help you spot what really makes a stock worth owning:
Easy enough for new investors diving into fundamentals
Sharp enough to level up seasoned pros
Real enough to avoid hype
…but the truth is: these numbers did flag companies like Amazon, Apple, and Nvidia before the market gave them credit.
-----------------------------------------------------
✅ Quick Reference Table
Scan the table, then dive into the stories…
First Pro Tip: Bookmark this. You’ll check these before every stock pick.
-----------------------------------------------------
📊 1. P/E Ratio | Price-to-Earnings
What it tells you: How much you pay for each dollar of a company’s profit.
Short Example: A P/E of 20 means you pay $20 for $1 of profit. High P/E? Expect big growth or risk overpaying.
Strong: Between 15 and 25
Caution: Above 30 (unless fast growth)
Industry Averages:
- Tech: 25–40
- Utilities: 10–15
- Consumer Staples: 15–20
- Energy: 10–20
- Healthcare: 20–30
Story: In early 2023, NVIDIA’s P/E ratio hovered around 25, near the low end for tech stocks. Investors who saw this as a steal amid the AI boom were rewarded—NVIDIA’s stock made 4x by the end of 2024 as AI chip demand soared.
Contrast that with Tesla in Q1 2025, when its P/E spiked above 40 with slowing sales and Tesla’s stock dropped 50% in weeks.
Pro tip: A low P/E is not always good. If growth is weak or falling, it's often a trap.
Example: A utility company with a P/E of 30 is probably overpriced. A tech stock with 35 might still be fair — if growth justifies it.
-----------------------------------------------------
🧠 2. PEG Ratio | Price-to-Earnings-to-Growth
What it tells you: If a high P/E is worth it based on future profit growth. Whether the earnings growth justifies the price.
Short Example: A PEG below 1 means you’re getting growth at a fair price. High PEG? You’re overpaying.
Strong: Below 1
Caution: Above 2
Industry Averages:
- Software: below 1.5 is solid
- Consumer Goods: Below 2 is more realistic
- Tech: Below 1
- Consumer Staples: Below 1.5
- Healthcare: Below 1.2
- Financials: Below 1.5
- Energy: Below 1.3
Story: In mid-2022, Salesforce’s PEG was 0.8 (P/E 35, forward EPS growth 45%) as cloud demand surged. Investors who spotted this steal saw the stock climb 130% by the end of 2024. Meanwhile, Peloton in 2023 had a P/E of 20 but near-zero growth (PEG above 3). Its stock cratered -50% as fitness trends faded.
Story: NVIDIA’s PEG hit 0.9 in Q3 2023 (P/E 30, growth 35%) during AI hype, a steal for tech (average PEG below 1.2).
PEG filters hype. A stock can look expensive until you factor in growth.
-----------------------------------------------------
🧱 3. P/B Ratio | Price-to-Book
What it tells you: How much you pay compared to what the company owns (like buildings or cash).
Short Example: A P/B below 1.5 means you’re paying close to the company’s asset value. High P/B? Expect strong profits or risk.
Strong: Below 1.5
Caution: Below 1 + poor earnings = value trap
Industry Averages:
- Banks: Below 1.5
- Insurance: Below 1.3
- REITs: Use NAV (aim below 1.2)
- Tech: Often ignored
- Energy: Below 2
Story: In 2024, JPMorgan Chase’s P/B was 1.4, solid for banks (average below 1.5). Investors who bought enjoyed 100% gains.
n 2023, Bed Bath & Beyond’s P/B fell below 1 with collapsing earnings. It looked cheap but filed for bankruptcy that year.
Tip: Only use this in asset-heavy sectors like banking or real estate.
-----------------------------------------------------
⚙️ 4. ROE | Return on Equity
What it tells you: How well a company turns investor money into profits.
Short Example: An ROE above 15% means the company makes good money from your investment. Low ROE? Weak returns.
Strong: Above 15%
Caution: Below 10% unless in slow-growth industries
Industry Averages:
- Tech: 20–30%
- Consumer Staples: 15–25%
- Utilities: 8–12%
- Financials: 10–15%
- Healthcare: 15–20%
Story: Coca-Cola (KO) has kept ROE above 35% for years, a sign of brand power and pricing strength.
Eli Lilly’s (LLY) ROE stayed above 25% from 2022–2024, a healthcare leader (average 15–20%). Its weight-loss drug Mounjaro drove consistent profits, lifting the stock 150%+ in two years. Checking ROE trends helped investors spot this winner.
Tip: If ROE is high but D/E is also high, be careful, it might just be leverage.
-----------------------------------------------------
💰 5. Net Margin | Profitability
What it tells you: How much profit a company keeps from its sales or what % of revenue ends up as pure profit.
Short Example: A 10% margin means $10 profit per $100 in sales. Low margin? Tough business or high costs.
Strong: Above 10-15%+
Caution: Below 5%
Industry Averages:
- Software: 20–30%
- Retail: 2–5%
- Manufacturing: 8–12%
- Consumer Staples: 10–15%
- Energy: 5–10%
- Healthcare: 8–15%
Story: Walmart’s (WMT) 2% net margin looks tiny — but it’s expected in retail.
A software firm with 5%? That’s a warning — high costs or weak pricing.
In 2023, Zoom’s (ZM) net margin fell to 5% (down from 25% in 2021), well below software’s 20–30% average. Pricing pressure and competition crushed its stock quite a lot. Meanwhile, Apple’s 25% margin in 2024 (tech average 20%) remained a cash cow.
Tip: Margins show whether the company owns its pricing or competes on price.
-----------------------------------------------------
💣 6. D/E Ratio | Debt-to-Equity
What it tells you: How much debt a company uses compared to investor money.
Short Example: A D/E below 1 means more investor cash than debt. High D/E? Risky if profits dip.
Strong: Below 1
Caution: Above 2 (except REITs or utilities)
Industry Averages:
- Tech: 0–0.5
- Industrials: 0.5–1.5
- REITs: 1.5–2.5 (manageable due to structure)
- Utilities: 1–2
- Energy: 0.5–1.5
Story: In 2024, Tesla’s D/E dropped below 0.3 (tech average 0–0.5) as it paid down debt, signaling strength despite sales dips - a massive rally afterward.
Tip: Rising debt + falling profits = a storm coming. Always check both.
-----------------------------------------------------
💵 7. Free Cash Flow (FCF)
What it tells you: Cash left after paying for operations and growth investments.
Short Example: Apple’s $100 billion cash pile in 2024 funded stock buybacks, boosting shares. Low cash? Trouble looms.
Strong: Positive and growing
Caution: Negative for multiple years
Sector notes:
- Tech: Lots of cash (think billions)
- Industrials: Up and down, check trends
- REITs: Look at FFO (cash from properties), aim high
- Energy: Has cash, but swings with oil prices
- Healthcare: Steady cash, not too high
Story: Netflix had negative FCF while scaling content. Once costs stabilized, FCF turned positive and stock re-rated sharply.
Pro tip: Profits don’t mean much without real cash. FCF is often more honest.
Cash is king: Companies need cash to pay bills, reduce debt, or fund growth. If FCF is falling, they might be burning through cash reserves or borrowing, which isn’t sustainable.
Potential issues : This mismatch could signal problems like poor cash collection, heavy spending, or even accounting tricks to inflate profits.
-----------------------------------------------------
🚀 8. EPS Growth | Earnings Power
What it tells you: How fast a company’s profits per share are growing.
Short Example: EPS up 10% yearly means more profit per share, lifting stock prices. Flat EPS? No growth, no gains.
Strong: Above 10%
Caution: Below 5%, flat/negative for 3+ years
Industry Averages:
- Tech: 15–30%
- Staples: 5–10%
- REITs: 3–6% (via FFO growth)
- Healthcare: 10–15%
- Financials: 5–10%
- Energy: 5–15% (cyclical)
Story: In Q1 2024, NVIDIA’s forward EPS growth of 30% (tech average 20%+) fueled a rally as AI chips dominated. Checking forward estimates helped investors avoid traps like Intel, with flat EPS and a drop.
Pro tip: A stock with flat EPS and no dividend? There’s no reason to own it.
-----------------------------------------------------
💵 9. Dividend Yield | Passive Income
What it tells you: How much cash you get yearly from dividends per dollar invested.
Short Example: A 3% yield means $3 per $100 invested. High yield? Check if it’s sustainable.
Good: ~3–4%
Red Flag: Above 6% with a payout ratio above 80-90%
Industry Averages:
- Utilities: 3–5%
- REITs: 3–6%
- Consumer Staples: 2–4%
- Tech: 0–2%
- Energy: 2–5%
-----------------------------------------------------
💡 Final Thought: How to Use All of This
Top investors don’t use just one metric. They look at the whole picture:
Good growth? Check PEG.
Good profits? Confirm with ROE and margin.
Safe balance sheet? Look at D/E and cash flow.
Fair valuation? P/E + FCF Yield + P/B.
Real power = Combining metrics.
A company with P/E 15, PEG 0.8, ROE 20%, low debt, and positive FCF? That’s your winner.
A stock with P/E 8, but no growth, high debt, and negative cash flow? That’s a trap.
-----------------------------------------------------
Real-World Combos
🎯Winners:
Tech Gem: P/E 20, PEG 0.8, ROE 25%, D/E 0.4, growing FCF, EPS 20%+ (e.g., NVIDIA 2023: AI-driven growth, stock soared).
Energy Steal: P/E 15, P/B 1.5, FCF positive, Dividend Yield 3.5% (e.g., Chevron 2023: Cash flow king).
⚠️Traps:
Value Trap: P/E 8, flat EPS, D/E 2.5, negative FCF (e.g., Peloton 2023).
Overhyped Tech: P/E 50, PEG 3, Net Margin 5%, D/E 1.5 (e.g., Rivian 2024).
-----------------------------------------------------
🚀 Share your own combos!
What do you personally look for when picking a stock?
If you spotted something off in the numbers, or have a valuable insight to add — please, drop it in the comments.👇
💡 Let’s turn this into a thread that’s not just good but superb and genuinely helpful for everyone.
-----------------------------------------------------
Final Thought
“Buy great companies at fair prices, not fair companies at great prices.” – Warren Buffett
This guide gives you the map.
Charts, tell you when.
These numbers tell you what, and why.
And this post?
It’s just the beginning!
These 9 metrics are part one of a bigger series I’m building — where we’ll go even deeper, with more advanced ratios, smarter combos, and real case studies.
If this guide helped you see financial numbers a little clearer, there’s a good chance it’ll help your investor friend too, especially if they’re just starting their journey...🤝Share it with them!
I built this as much for myself as for anyone else who wants to get better.👊
If you made it this far — thank you! 🙏
...and super thankful if you hit "The Boost" on this post 🚀
Cheers,
Vaido

Nat West breakoutClear breakout from 327, which was established resistance since 2016. Inverse Head and Shoulders pattern completed.
Volumes have been ramping up since Feb this year and the shares are not oversold on the weekly RSI yet.
Market likes their results today too.
In my opinion, heading for 400p.
Do your own research and this is NOT a solicitation to hold, buy or sell.

S&P 500 Daily Chart Analysis For Week of April 4, 2025Technical Analysis and Outlook:
During this week's trading session, the Index experienced lower openings, completing the Outer Index Dip at 5403, as highlighted in the previous week's Daily Chart analysis. This development lays a foundation for a potential decline targeting the Outer Index Dip at 5026, with the possibility of further extension to the subsequent target of the next Outer Index Dip, 4893. An upward momentum may materialize at either completed target level, with the primary objective being the Mean Resistance level of 5185.

ALL THE TARGET REACHED ON USDZARCheck Out All My Previous Post About USDZAR.
God is good all the time,My analysis was successfully.
Let chill and enjoy the profits,Non Farm Payroll is coming up on Friday.
Let be ready to prepare it.

GOLD 1H CHAR ROUTE MAP & TRADING PLAN FOR THE WEEKGOLD 1H Chart – 12th Feb 2025
Dear Traders,
Here’s the latest 1H chart analysis, outlining key levels and targets for the week.
Gold is currently trading between two critical levels, with a gap above 2905 and below 2883. A confirmed EMA5 crossover and lock above or below these levels will indicate the next price direction. Until then, expect price fluctuations as these levels are tested repeatedly.
Keep in mind that Inflation and CPI data are due today and tomorrow. While fundamental analysis plays a role in predicting gold's movement, our advanced technical analysis is essential for precise entry and exit points during these volatile geopolitical times.
Our strategy remains focused on buying dips and monitoring key levels to identify potential bounce opportunities. Stay sharp!
Resistance Levels: 2905, 2920, 2942, 2963, 2982, 3001, 3021, 3043
Support Levels: Gold Turn Levels : 2883, 2852, 2837, 2817,
Retracement Range: 2802 - 2817
Swing Range: 2747
EMA5 (Red Line) Analysis:
* Currently fluctuating between 2886 and 2905
* EMA5 positioning will be crucial in determining the next trading direction.
Bullish Targets:
EMA5 cross and lock Above 2905 → will open the following bullish Target 2920 ✅Done
EMA5 cross and lock Above 2920 → will open the following bullish Target 2942 ✅Done
EMA5 cross and lock Above 2942 → will open the following bullish Target 2963
EMA5 cross and lock Above 2963 → will open the following bullish Target 2982
EMA5 cross and lock Above 2982 → will open the following bullish Target 3001
EMA5 cross and lock Above 3001 → will open the following bullish Target 3021
EMA5 cross and lock Above 3021 → will open the following bullish Target 3043
Bearish Targets:
EMA5 cross and lock Below 2883 → will open the following bearish Target 2852
EMA5 cross and lock Below 2852 → will open the following bearish Target 2837
EMA5 cross and lock Below 2837 → will open the following bearish Target 2817
EMA5 cross and lock Below 2817 → will open the following bearish Target 2802 (Retracement Range)
EMA5 cross and lock Below 2802 → will open the following bearish Target 2747 (Swing Range)
Trading Plan:
* Stay bullish and buy pullbacks from key levels.
* Avoid chasing tops—focus on buying dips.
* Use smaller timeframes for entries at Goldturn levels.
* Aim for 30–40 pips per trade for optimal risk management.
* Each level can yield 20–40+ pips reversals.
Trade with confidence and discipline. Stay tuned for our daily updates! Please support us with likes, comments, and follows to keep these insights coming.
📉💰 The Quantum Trading Mastery

Learn To Invest: Global Liquidity Index & BitcoinGlobal Liquidity Index & BitCoin:
🚀 Positive Vibes for Your Financial Journey! 🚀
BITSTAMP:BTCUSD
Look at this chart! It's the Global Liquidity Index , a measure of how much extra money is flowing through the world's financial systems.
Why is this important? Because when this index is high, it often means good things for investments like #Bitcoin! 📈
Think of it like this: when there's more money flowing, people are often more willing to take risks and invest in things like Bitcoin.
See those "BullRun" boxes? That means things are looking bright! It's showing that money is flowing, and that's often a good sign for potential Bitcoin growth. 🌟
Even if you're not a pro, it's easy to see the good news here. Understanding these trends can help you make smarter decisions.
Let's all aim for growth and success! 💪

Applied Materials (AMAT) Stock Analysis ReportApplied Materials, Inc. (NASDAQ: AMAT) is a global leader in materials engineering solutions for semiconductor manufacturing. The company provides equipment, software, and services to help produce advanced chips used in various high-tech applications, including AI, 5G, and automotive industries. As a key player in the semiconductor equipment sector, AMAT competes with companies like ASML (ASML), KLA Corporation (KLAC), Lam Research (LRCX), Teradyne (TER), and Tokyo Electron.
Financial Performance Analysis
Profitability Metrics
Gross Margin:
47.46% (AMAT) vs. KLAC (61.19%), ASML (49.82%), Teradyne (54.83%)
Operating Margin:
28.95% (AMAT) vs. ASML (31.92%), KLAC (39.03%), Teradyne (19.46%)
AMAT maintains a strong gross margin but lags behind KLAC and ASML. However, its operating margin of 28.95% demonstrates effective cost control and efficient operations.
Return on Equity & Capital Efficiency
Return on Equity (ROE):
40.61% (AMAT) vs. KLAC (87.85%), ASML (48.19%), Teradyne (20.29%)
Cash-to-Debt Ratio: 1.43
While AMAT’s ROE is strong, KLAC significantly outperforms. AMAT’s cash-to-debt ratio of 1.43 suggests a manageable debt level, ensuring financial flexibility.
R&D Investment Efficiency
R&D-to-Revenue Ratio :
11.9% (AMAT) vs. ASML (13.95%), KLAC (13.06%)
A lower R&D-to-revenue ratio indicates AMAT is able to generate high revenue with relatively lower R&D spending, signaling operational efficiency and competitive advantages in innovation management. While ASML and KLAC invest more heavily, AMAT’s ability to maintain growth with a lower R&D ratio demonstrates strong execution.
Cash Flow
Free Cash Flow Margin : 27.55%
With a free cash flow margin of 27.55%, AMAT generates solid cash, supporting dividends and buybacks.
Industry Outlook & Growth Potential
The semiconductor industry is poised for strong growth due to increasing demand for AI chips, high-performance computing, and electric vehicles. However, the U.S. government’s new tariffs on Chinese semiconductor-related imports may impact AMAT’s global sales, particularly if China retaliates.
Despite this, AMAT remains well-positioned due to:
Its strong presence in leading-edge chip manufacturing.
Expansion in AI-related semiconductor production.
High free cash flow generation, allowing for reinvestment and shareholder returns.
Risks & Challenges
Impact of U.S.-China Trade Tensions
New U.S. tariffs on semiconductor equipment could reduce AMAT’s revenue from Chinese customers. If China restricts access to key materials, AMAT may face supply chain disruptions.
Competitive Pressure
ASML dominates the lithography equipment market, while KLAC and Lam Research lead in process diagnostics and wafer fabrication. AMAT must continue innovating to defend its market position.
Semiconductor Industry Cyclicality
Downturns in semiconductor demand could hurt AMAT’s revenue, as seen in previous industry cycles.
Investment Outlook & Valuation
Current Price: $155.68
Intrinsic Value: $207.38 (Safety Margin 24.93%)
Earnings Yield: 4.91%
Dividend Yield: 0.81%
AMAT’s intrinsic value suggests the stock is undervalued by 24.93%, making it an attractive long-term investment.
Bullish Case
Strong profitability and efficiency despite lower R&D spending.
High cash flow generation supporting shareholder returns.
Undervalued stock with strong upside potential.
Bearish Case
U.S. tariffs could impact sales in China.
Competition from ASML, KLAC, and Lam Research remains intense.
Semiconductor demand cycles may cause short-term volatility.
Final Verdict: Buy, Hold, or Sell?
Given AMAT’s undervaluation, strong margins, and efficient R&D spending, the stock presents a Buy opportunity for long-term investors. However, geopolitical risks should be monitored closely.
Investment Strategy:
Accumulate AMAT on dips, targeting a price range of $190-$210 over the next 12-18 months.

Goldman Sachs - Too Cheap to Ignore?NYSE:GS and the general financial services sector as a whole has faced extreme trauma over this past month. However, one that particularly stands out is the "bad guy" of the industry who has taken the equivalent to a roundhouse kick to the face, and the chart shows it. But does this mean that someone looking for a dip shouldn't pick up strong equity on a discount? I say no, lets be greedy while other are fearful just like that one guy said. Warren something... I don't really remember his name.
Let's examine the numbers before we do the finance equivalent of astrology. This means that value investing and it's rather elementary techniques are going to give us some sort of indicator of a buy or a sell. Here's what you need to know.
1. Sachs has an attractive dividend yield of 2.14% ($11.50/share) and a gleaming dividend payout ratio (DPR) of 21.50%.
2. It is far from its high annual EPS sitting at 41.21 sliding from its high last December at 60.35.
3. It's price to earnings ratio (PE) is lounging nicely at 14.00 meaning we are at a generally cheap share price. This metric is what we're looking for.
4. Unfortunately, it has a rather higher price to book ratio (PB) at 1.64 which somewhat contradicts the PE ratio examined in #3.
5. Other metrics to keep in mind is an EV/EBITDA at 53.90 and a PEG at 16.23 which are both considered undesirable to investors.
So as far as statistics are concerned, Goldman is sending some mixed signals making a decision difficult at the moment. This means we're going to have to examine the general sector sentiment and general outlook.
Firstly, I'd like to point out Goldman's enterprise value. Sachs' EV is currently reported at 855.93 billion, 673 billion (78.63%) being debt (long term or short). This means NYSE:GS is a debt heavy company and we all know how debt works (the entity taking on the debt owes principal + interest). Well, this means that NYSE:GS is heavily going to be influenced by interest rates even considering their strong revenue. So, if we plan on interest rates being lowered long term (which I'm sure we all do), Goldman will be able to borrow from the Fed at a cheaper interest price while simultaneously owing account holders and bond holders less in interest (or APY yield for that matter). However, in the event that inflation runs wild and the Fed raises rates, NYSE:GS will face some turmoil along with the other commercial investment banks.
Great, so now for the fun part. Let's see what the charts have to say about this and what it could be implying.
Here is the 4H chart looking back into last October.
As you can see, Goldman posted a sweet rally followed by our current pullback. However, we are being flashed with various bullish technical patterns and a strong explanation for the drop (even considering the tariffs threats and indices pullback). In summary, we are examining a stock in gradual freefall towards what appears to be several safety nets.
On a psychological level, I find that most investors in the business of "smart money" wont let Goldman drop too low before they put their boot down. I also imagine this will happen pretty soon, but we need to hold the $540 price level.
As far as the MACD is concerned, we are experiencing weakness from the buyers are the bears are clearly on offense.
And lastly, the GS implied volatility shows that options traders aren't pricing in anything particularly unusual, and the most usual movement for the market is to climb higher so that's good news.
So, what's the conclusion. In my humble opinion, I believe that Goldman Sachs' stock is trading too low to not buy. Financially, the company is not showing anything particularly concerning and may just need to show some strength before the mass cash chases this play. As of right now, I am long on NYSE:GS considering the financial statistics, general industry sentiment, and technical analysis which was used as an assistance tool. This trade could be last anywhere from 1 day to 1 year, but I am prepared to hold for much longer.

Good Financial Results.169 - 175 can be a Good Support Area.
Better Financial Results.
Should not Break 162 even in Worst Cases.
Crossing 180 may lead it towards 190 - 193.

A NEAR PSYCHOLOGICAL SUPPORT SEEN IN NSE: JBMA AUTO 🔸️A technical analysis of JBM Auto Ltd. (NSE: JBMA), outlining a long-term investment plan with an investment period of 3-5 months. Here's a breakdown of the levels and strategy:
✅️Entry Timing: Wait for the price to either approach ₹1,389 for an optimal entry or confirm an upward breakout.
☑️Entry: ₹1,389.10
🔴Stop Loss: ₹1,352.30
🔰Targets:
🟠TP1: ₹1,449.90
🟡TP2: ₹1,499.85
🔵TP3: ₹1,606.25
🟢TP4: ₹1,681.00
♻️Holding Period: 3-5 months.
🚰Strategy: Buy near ₹1,389, use stop loss, and book profits gradually at targets.
🔴Disclaimer:
I am not SEBI registered. This information is purely for educational purposes and not financial advice. The securities market is subject to market risks; please do your own research...
If you like this idea like share amd subscribe @Alpha_strike_reader

"HDFC Bank Swing Trade: Key Levels & 3-Month Investment Plan"A investment idea for HDFCBANK with a holding period of up to 3 months (till Q1). Here’s the analysis based on the marked levels:
Key Levels and Strategy:
1. Entry Point:
1,719.00: Recommended entry level.
2. Take Profit (TP) Targets:
TP 1: 1,778.55
TP 2: 1,818.70
TP 3: 1,906.55 (longer-term target).
3. Stop-Loss (SL) Levels:
SL: 1,697.25 (first risk level, can act as minor support).
Strict SL: 1,671.95 (final stop-loss level to limit risk).
Observations:
Risk-Reward: This strategy provides a well-defined risk-to-reward ratio, with three potential profit levels.
Support Zone: The area around 1,697.25 - 1,671.95 is critical. It might act as strong support if the price drops further.
Resistance Levels:
1,778.55: Could face selling pressure as it aligns with prior resistance.
1,818.70: A stronger resistance where bulls need momentum to break through.
Recommendation:
If the price moves to the entry level (1,719.00), ensure to set your stop-loss and gradually book profits at the mentioned TP levels.
Reassess market conditions if it approaches strict SL (1,671.95) to avoid excessive losses.
Disclaimer:
"I'm not SEBI registered. Please take any trade at your own risk. Market securities are subject to market risks. This is for educational purposes only.
Would you like further insights into technical indicators or additional strategies?
Thank you! Subscribe and like @Alpha_strike_trader."

JPM Leg 2?After a massive consolidation breakout, we are seeing a picture perfect ascending triangle forming,
Above $248 , $250 will come quick
