Pair Trade Setup : Short Sanlam vs. Long Standard BankSanlam has outperformed Standard bank by a margin of 27% from the lows we saw in May of this year. The chart of their relative ratios ( SLM / SBK ) has now approached an important area of resistance (0.46 to 0.477) which has been in place for the last two years. If you take a look at the individual charts of the underlying counters, one will notice that Sanlam has once again turned off important resistance levels between R82 and R85 while Standard Bank is not trading too far away from its 200 week moving average which has provided important support for the stock over the last two years. In Addition, the Standard Bank daily chart is trading in a triangle with support some R2 away from current levels. This would support my view on the pair trade as i believe that Sanlam will under-perform Standard Bank going forward, or at least, there is sufficient reason to believe that Standard bank has a better chance of climbing higher than Sanlam at this point in time. In Addition, the MACD indicator has made a lower high even though price made a slightly higher swing high which further reinforces my view that price action is weak and should see the pair ratio revert lower.
SLM -> PE ratio: 22.2x DY : 3.85%
SBK -> PE ratio 9.8x DY: 5.69%
From a fundamental perspective, Standard Bank's Price to Earnings Ratio is not demanding whilst also boasting a much better Dividend yield.
Suggested ratio entry point : 0.463 - 0.475
Suggested ratio stop loss: closed above 0.480
Suggested ratio exit point: 0.427 to 0.433
To be entered at a ratio of 1:1. i.e 100k nominal short position in Sanlam vs. 100k nominal long Position in Standard Bank.
Assuming we entered this pair at 0.465 today, used a stop loss at 0.480 and locked in profits @ 0.43, we are risking a move of 3.2% against us to make a potential profit of 7.5% for a risk reward ratio of just over 2.3x
Financials
REPOCALYPSE NOW!This is serious. Find out what 'REPOCALYPSE' is about. Protect your positions very carefully.
Get real - I don't know when it's happening nor does anybody else.
REPOCALYPSE is not just doom-saying stuff, though it might appear sensationalist. This is reality mates.
Those who keep there heads in the sand and do not take protective actions will be flushed out.
DISCLAIMER: All statements here are over-simplifications of very complex issues, and are speculative opinion. This is not constructed as advice for making decisions about trading in securities. Your losses are your own.
Declaration : This post is consistent with Tradingview's house rules on text-based analyses.
Possible AUD/CAD Short Position!!SMP TRADING
SELF DEVELOPMENT/METHODOLOGY/PSYCHOLOGY
Chart time frame - H4
Timeframe - 1-3 Days
Actions on -
A – Activating Event
Market will meet resistance in zone @ Current Levels - .... and fall to the 0.892 . In order to enter, the pair MUST be in line with my Entry Procedure....
B – Beliefs
Market move towards the first Target 1 level @ 0.892
FX:AUD/CAD
Trade Management
Entered @ .....
Stop Loss @ .....
Target 1 @ 0.892
Target 2 @ ....
Risk/Reward @ 3.1
Happy trading :)
Follow your Trading plan, remain disciplined and keep learning !!
Please Follow, Like,Comment & Follow
This information is not a recommendation to buy or sell. It is to be used for educational purposes only!
TESLA continuation of previos roadmap!So guys here it is my new chart for TESLA continuing previous road-map from last chart, following nicely except of big pullback because of the news of quarterly earning that pulled down the price to 220$ levels but, thats I think good think cause give us a little windows to hop back in to LONG position again.
I personalty did snatched a little at 235$ level didn't get lower but for now holding with the stops just bellow that price, or if you got in at 220$ STOP there.
So if we follow first wave purple like on previous chart and hit 260$ level we pass 50% fib that I think will be our sign and decision for future, here we will have up or down movement long term.
1. GREEN wave first sell target at around 78% fib and previous wiggle around level 330$, then second sell target at previous 2y HIGH at 390$
For getting these levels I think that we have to have change of sentiment for TELSA as for now is bad because of all financial problems TESLA company is going trough and off course Elon Musk himself.v If we get a turnaround we could easily hit those sell points.
2. As for RED wave we could surpass 50% extension, retest it, and then fall back down to 200$ and then further to 170$ish levels where will be our firs buy zone ad if we even fall further to previous support (ORANGE line) we hit buy zone II. and from here we should go up with best RR ratio for next wave up, and very nice profit!
Lets see what would sentiment be, and driven by that more than technical analysis price will hopefully follow my road-map and we will act accordingly.!
Thanks for support, likes, and following!
Very much appreciated!
Stay in green, peace!
SPX 500 Index, Daily Chart Analysis July 25Technical Analysis and Outlook
The S&P500 index closed higher and by doing so, obsoleted the relatively weak Key Res 3016 . The higher-range closure sets the stage for a steady to higher advancement towards the Inner Index Rally 3040 , and ultimately to the Outer Index Rally 3125 (The sixth phase). Currently, there are no significant resistance levels: the downside there is established Mean Sup 2976 , and distance Key Sup marked at 2914 .
Near 20-year lows, Amneal is still too riskyGeneric drug maker Amneal has been slowly melting down since 2015, falling from $50 per share to today's closing price of $3.44. Amneal makes money, though it missed estimates last quarter by about $0.04 per share.
S&P Capital IQ rates it an undervalued, high quality, and financially healthy company, but I think that overstates the case. In my opinion this company is at real financial risk. Amneal's cash reserve shrank by 3/4 year-over-year, while its accounts receivable grew in an equal amount. That suggests that while Amneal's assets may look good on paper, it may not be very liquid. Amneal may need to do a better job with collections. Furthermore, ongoing litigation over price fixing and the opioid epidemic exposes Amneal to potential damages of $1.2 billion, almost its total current assets.
Amneal has some support at its current share price as it approaches lows from back in 2008 and 2002-2003. It also got an analyst upgrade today from SVB Leerink after the analytics firm determined that of the major generic drug makers, Amneal has the least exposure to that ongoing litigation I mentioned. (Endo Phramaceuticals has the most exposure, and Teva comes in second.) However, given the enormity of the drug makers' exposure, saying Amneal is the least exposed doesn't mean much.
If the litigation plays out in the generic drug makers' favor, Amneal will be a great stock available at bargain basement pricing. Until then, this stock is much too risky. It may continue to fall to its 1998 lows of under $1 per share.
GS Long-Term Uptrend; End of 2019 Price Target: $200Goldman Sachs has been harried by the 1MDB scandal as of late. Look for the company's robust business to shake off the short-term concerns over 2019 and regain the old highs. The first green trend line gives us an idea of what the trend COULD have been for GS. The second green line delivers a more accurate picture of what the trading behavior will resemble in the long-run. Right now: be wary of this stock as it could reach 145-150 levels before the stock regains its momentum. After that, it should be clear skies ahead!
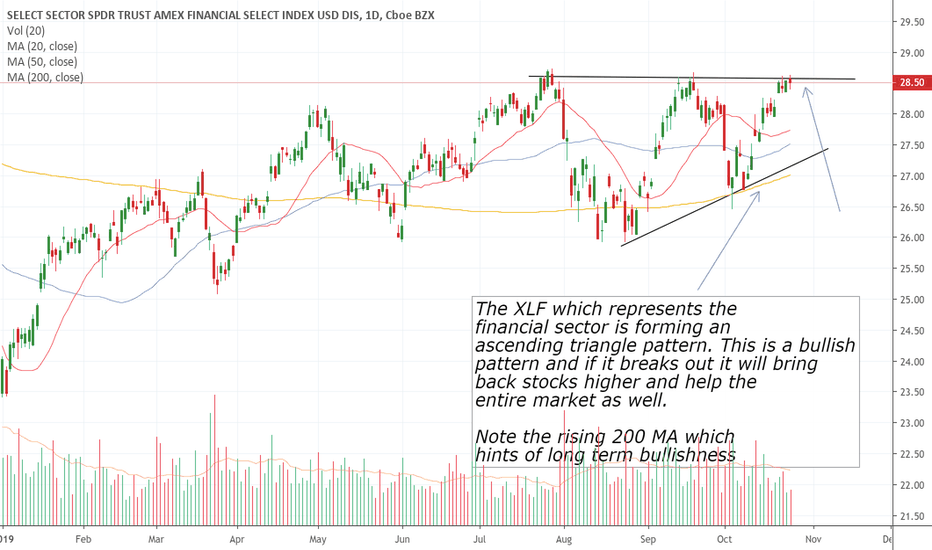
Double Top and profit taking XLF has reached to the final target zone of a bullish setup (posted in my Facebook page)
Now, with a double and a resistance zone, we can see some pullback (or even a strong bearish wave).
This can be a warning signal for stocks...
SPX also struggles to close in new records highs territory - Back below 2960 and generates a potential false break and a potential daily Pinbar (still a couple of hours to the daily close)
Warning Warning Warning - Trump and Powel in need for the rescue
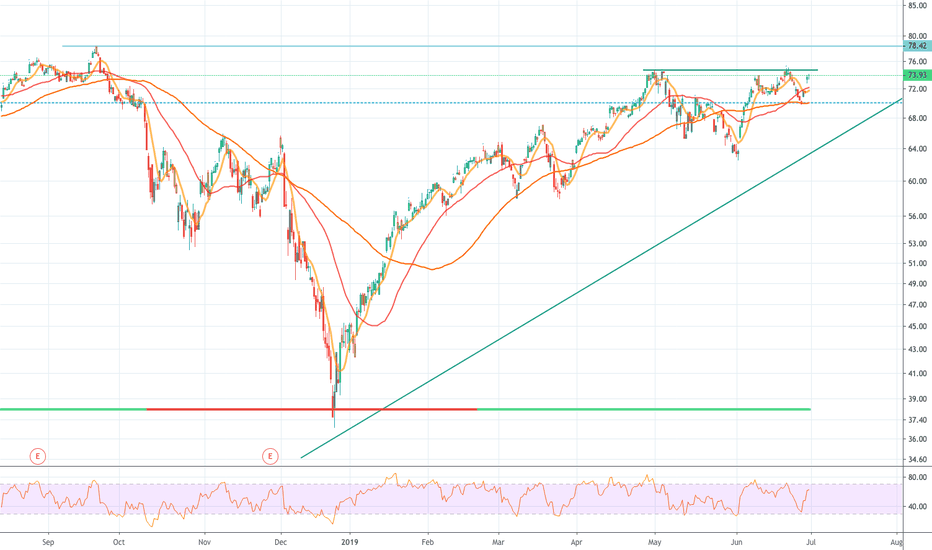
Financials Passing Overhead Resistance in Pre-marketA very bullish sign for the Financial sector when FAS passed the double top overhead resistance at around $74.93 in premarker trading. New resistance is at $78.42 which is good for a further 3.5%. Given the events of Saturday I expect this to continue marching forward.
EUR/USD, Daily Chart Analysis June 21Technical Analysis and Outlook
It seems like we have a currency war. Euro Dollar sank after dovish Super Mario - Draghi comment and surged after dovish Fed chair Powell remarks.
The short-term surge of the Euro Dollar trend sentiment remains semi-bullish and current rebound is producing push into Outer Currency Rally $1.1376 . The relatively weak Mean Res $1.3333 will be a showdown of this fake push towards higher prices, with aged Key Res $1.1410 looming above.
On the downside, there is a Mean Res $1.1193 a distance away, while the significant Key Res $1.1330 is sitting below.
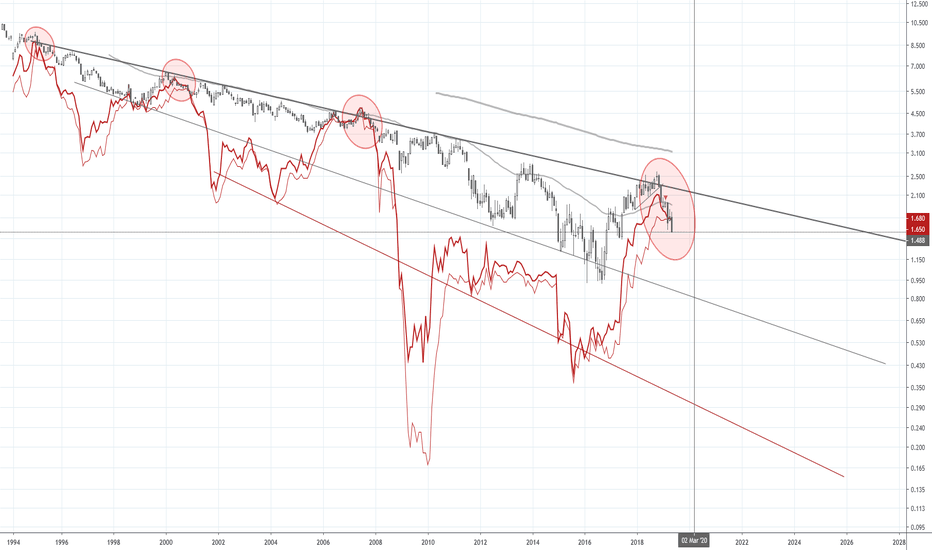
Canada | Recession WatchThe 10 year Canadian yield is now below the 1 year and 3 month yield, which is a good indicator of a potential recession ahead. Rates follow economic growth, so we can interpret yields as a function of the economy. These interest rates also impact the price of money (CAD interest rates). One way to interpret lower interest rates in the Canadian economy is that economic activity is lower and cheap money indicates a discount on loans due to a lack of credit demand. Lack of credit demand could be an issue related to demand itself, access, or credit worthiness. So lower interest rates can quickly impact CAD valuations against other currencies in the FX market.
The trend is pretty clear going back to the early 90s; the 10 year provides a kind of ceiling for yields. There is a kind of megaphone pattern as well, which could indicate that rates will go sharply lower in the coming years, with short term rates bottoming out hard and perhaps even going negative.
CIBC | 40% Short Trade SetupConfirmation: 99.65 (weekly candle)
Invalidation: Local high
Type of Trade: Countercyclical (EMA50 above EMA200)
Target: 56.46
TF: Weekly
Leverage: 2x
Pattern: 1) monthly rising wedge reversal with 2) break of weekly support, and 3) break of major support line.
Monthly view:


