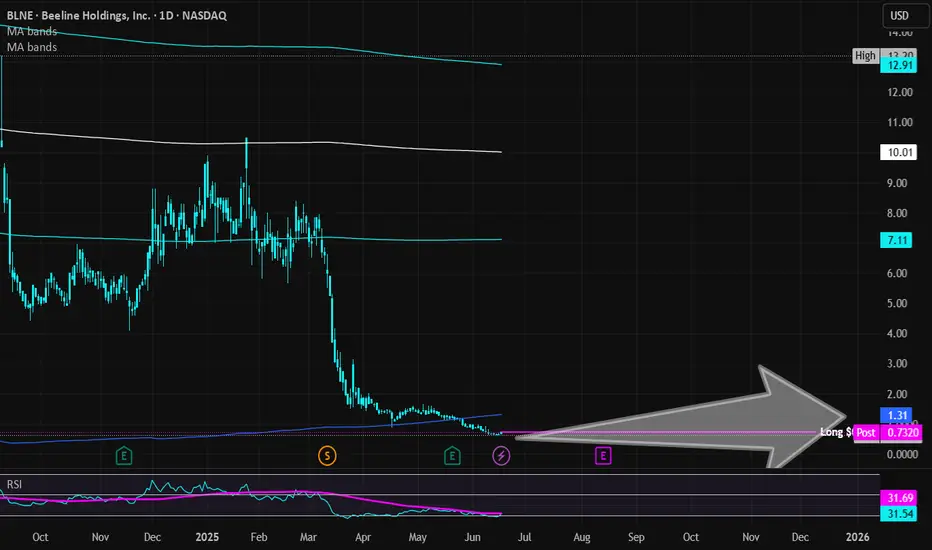
Beeline Holdings | BLNE | Long at $0.72**This is a VERY risky penny stock. Please do not invest if you are risk averse.**
Beeline Holdings NASDAQ:BLNE
Book value = $5.00-$6.00
Revenue past 12 months: $5.21 million (grew by 27.4% over the past year)
Debt-to-equity: 0.21x (low)
Insiders purchased almost $500k in shares in the past 6 months and volume increasing
6 million float, 1.96% short interest, 0.85 days to cover
This is purely a gamble play based on value and insider purchases. Thus, at $0.72, NASDAQ:BLNE is in a personal buy zone.
Targets:
$1.00
$1.25
Financialstocks
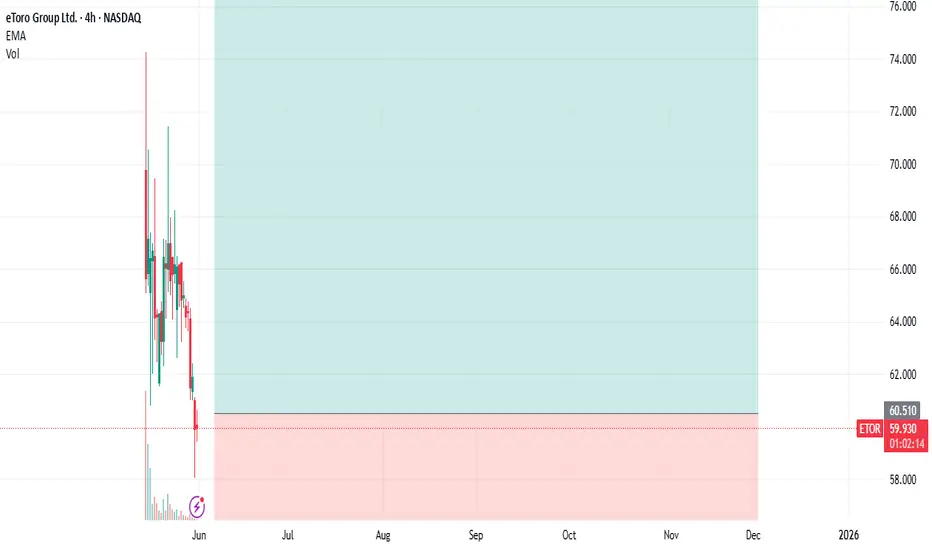
ETOR : Entry after IPOKind of social trading platform.
Etoro Platform also uses artificial intelligence.
I researched that it also allows trading of crypto assets.
$10B SPAC initiative canceled in 2022.
We re approaching mid 2025 .
Current market cap: around $5-5.3B.
Ground for progress may be present in good market conditions.
While institutions bought at $52, individuals were most likely able to buy above $70.
This was a great misfortune.
Very high opening of the IPO caused sharp sales, but holding for the medium term may be beneficial.As I briefly mentioned above, parameters that will bring momentum to stock may occur.
Constantly looking at the screen so much in such instruments can create a huge sense of panic and failure.
Target price: 90.00 - 94.00
Stop: 50.00
Amount: 1/3 of your portfolio's financial technology stocks ( e.g)
Risk - Reward Ratio > 2.80
Regards.
GOLD WEEKLY CHART MID/LONG TERM ROUTE MAP UDPATEDWeekly GOLD Analysis – Quantum Trading Mastery
Hello Everyone,
Here’s the latest update on the GOLD weekly chart we’ve been diligently tracking and trading. Below is a comprehensive breakdown of the current range and key levels we’ve identified.
Recap of Last Week’s Analysis:
Last week, our predictions aligned perfectly with market movements:
* A strong resistance level at 2790 caused a short-term reversal near 2735.
* The FVG acted as dynamic support at 2735, sustaining the bullish momentum.
* The EMA5 crossed and locked above the key level at 2735, solidifying upward movement.
* As predicted, the resistance was broken, leading to a new all-time high of 2817.
Our analysis delivered precise predictions, allowing you to trade confidently and minimize risks.
What’s Next for GOLD This Week?
Key Level: 2735
Bullish Targets:
* TP1: 2877
* TP2: 3018
* TP3: 3160
Bearish Targets:
* 2735
* 2680
* 2595
This week, we have identified two critical GOLDTURN levels at 2735 and 2595. While we anticipate GOLD reaching TP1 at 2877, there may be short-term reversals around these key levels and GOLDTURN zones.
Recommendations:
To better understand the support structure and identify optimal dip-buying opportunities, review our smaller time-frame analyses (daily, 12H, 4H, and 1H). These insights will help you navigate the market with precision, keeping long-term gaps in perspective.
We’ll continue to provide daily updates and insights to keep you informed.
Thank you for your continued support! Don’t forget to like, comment, and share this post to help others benefit as well.
The Quantum Trading Mastery

GOLD 12H CHART ROUTE MAP ANALYSIS FOR THE WEEK12H GOLD Chart: Updated Analysis and Strategic Outlook (10the Feb 2024)
Hello Traders,
Here’s the latest 12H GOLD chart update, featuring a detailed review of recent movements and actionable insights for the upcoming market sessions. Our diligent tracking since October 2023 has consistently delivered 100% target accuracy, as evidenced by the marked Golden Circle areas on the charts. Let’s dive into the highlights and what lies ahead.
Previous Chart Review
* Entry Level 2814: ✅ DONE
* TP1 2858: ✅ DONE
* The price broke above the resistance level 2858 and reached a new ATH at 2886 last week.
* EMA5 held above 2858, which fueled the strong bullish push during Friday’s NFP release.
What’s Next for GOLD? Bullish or Bearish?
The price is currently consolidating around 2858, with EMA5 playing a crucial role in determining the next trajectory.
Resistance Levels: 2903, 2948, 2993
Support Levels (Activated GOLDTURN Levels):
2813 (Critical Weighted Level)
2770 (Critical Weighted Level)
2710 (Critical Weighted Level)
2664 (Major Support Level)
2599 (Lower Major Demand Zone and Retracement Range)
EMA5 Behavior (Red Line):
* Currently sitting below TP1 (2858) but indicating sustained bullish momentum.
* EMA5’s crossing and locking above or below key levels will signal the next move:
Bullish Scenarios:
Scenario 1: If EMA5 crosses and locks above TP1 (2858), expect a bullish rally toward 2903.
Scenario 2: If EMA5 crosses and locks above TP2 (2903), the next target is 2948.
Scenario 3: A further cross and lock above 2948 could drive the price to 2993.
Bearish Scenarios:
If EMA5 fails to sustain above TP1 (2858) and resistance levels hold, expect a pullback toward support zones:
Scenario 1: A cross and lock below Entry (2813) could lead to a decline toward 2770.
Scenario 2: A further drop below 2770 may target 2710 as the next support level.
Scenario 3: Continued bearish momentum could push the price toward 2664 and, ultimately, 2599 (Retracement Range).
Short-Term Strategy:
Anticipate possible reversals at weighted GOLDTURN levels 2813 and 2770.
Leverage 1H and 4H timeframes to capture pullbacks around these levels.
Target 30–40 pips per trade, focusing on shorter positions for effective risk management.
GOLDTURN levels provide reliable bounce opportunities, allowing you to buy at dip levels.
Long-Term Outlook:
Maintain a bullish bias while using pullbacks as buying opportunities.
Buying near key support levels ensures better entry points and mitigates risks, avoiding the pitfalls of chasing tops.
Final Thoughts:
Trade with precision, discipline, and confidence. Our accurate, multi-timeframe analysis equips you to navigate the market effectively. Stay updated with daily insights to remain ahead of market trends.
We appreciate your support! Don’t forget to like, comment, and share this post to help others benefit.
Best regards,
📉💰 The Quantum Trading Mastery Team

GOLD DAILY CHART MID/LONG TERM UPDATEGOLD Daily Chart Update: Precision Analysis for Confident Trading (10th Feb 2024)
Hello Traders,
Here’s the latest update on the GOLD daily chart that we’ve been meticulously tracking and trading. Below, we provide an enhanced breakdown of recent movements, updated key levels, and actionable insights for the days ahead.
Recap of Recent Success in our previous chart:
Our recent analysis delivered remarkable accuracy:
* ENTRY LEVEL 2744: ✅ DONE
* TARGET TP1 (2807): ✅ DONE
* TARGET TP2 (2870): ✅ DONE
* EMA5 crossed and held above both Entry Level (2744) and TP1 (2807), confirming bullish momentum toward TP2 (2870). ✅ DONE
* The FVG zone at 2790 acted as strong support, facilitating upward momentum. ✅ DONE
* EMA5 correction at 2839 was completed successfully. ✅ DONE
* GOLD achieved a new ATH at 2886 after hitting TP2 (2870). ✅DONE
What’s Next for GOLD?
The price is now oscillating between critical weighted levels, with gaps both above and below 2870.
Key Levels to Watch:
Resistance Level: 2870
* A daily candle close above 2870 will confirm bullish momentum, with potential targets toward higher levels.
* Failure to close above this level may trigger a short-term reversal.
EMA5 Behavior:
* Or If EMA5 crosses and locks above 2870, it strengthens the bullish case.
* If EMA5 fails to hold, expect a pullback to key GOLDTURN levels.
Updated Support Levels (GOLDTURN Zones):
2801
2744
2671
2595
Key Scenarios:
* A bullish scenario could see the price retesting 2870 as resistance before pushing higher.
* A bearish scenario may unfold if the price fails to sustain above 2870, leading to a retest of
Recommendations:
* Capitalize on Dip Opportunities: Use smaller timeframes (1H, 4H) to trade around GOLDTURN levels, targeting 30–40 pips per trade.
* Stay focused on shorter trades in this range-bound market to manage volatility effectively.
Long-Term Bias:
Maintain a bullish outlook while viewing pullbacks as buying opportunities.
Accumulate positions near key support levels for a safer approach instead of chasing highs.
Final Note:
Trade with confidence and precision. Our analysis ensures you’re well-prepared to navigate the evolving market landscape. Stay updated with our daily insights across multiple timeframes for deeper clarity.
Thank you for your continued trust! Don’t forget to like, share, and comment to support our work.
Best regards,
The Quantum Trading Mastery Team

Visa: Bottom Already Established?Visa might have already reached the low of the magenta wave ; however, for now, we allow slightly more room for the downside. Nonetheless, once this interim correction has concluded, the price should proceed higher during the magenta wave and surpass the resistance at $366.34. We currently consider it 34% likely that the stock will break above this level to form a fresh high with the magenta wave alt. . But primarily, we view the regular wave as already complete.

GOLD 4H CHART ANAYLSIS / BULLISH OR BEARISH? READ CAPTION PLZ4H Gold Analysis – 7th Feb 2024
Dear Traders,
Today's market movement aligns with our strategy of buying dips. Here's a summary of key insights:
Previous Chart Review (5th Feb)
* Target 1 (2850.15) ✅ – Successfully hit
* Target 2 (2876.95) ✅ – Successfully hit
* Target 3 (2903.76) – Pending
Key Resistance Levels Activated: 2850, 2876
Goldturn Levels Hit: 2852, 2828
What is next for Gold? Bullish or Bearish?
* Price Action Expectation: Movement between Goldturn levels with EMA5 confirmation for trend direction.
* Strategy: Monitor EMA5 crosses for trade entries.
Bearish Case
* If EMA5 stays below 2850, expect a retest of Goldturn levels.
* Scenario 1: Below 2823, likely drop to 2803.
* Scenario 2: Below 2803, expect 2776.
* Scenario 3: Below 2776, target 2747 (major demand zone).
Bullish Case
* Scenario 1: Above 2852, target 2876 ✅ DONE
* Scenario 2: Above 2876, target 2903.
* Scenario 3: Above 2903, target 2925.85.
Trading Strategy
Short-Term:
Use 1H/4H timeframes for pullbacks at Goldturn levels.
Target 30-40 pips per trade for optimized risk management.
Long-Term:
Maintain a bullish bias, viewing pullbacks as buying opportunities.
Avoid chasing tops; buy dips from key levels for better trade positioning.
Trade with confidence and discipline. Stay updated with our daily insights to stay ahead.
Support us with likes, comments, boosts, and follows!
📉💰 The Quantum Trading Mastery

15M CHART ANALYSIS UPDATEDear Traders,
We are very happy we provided you accurate analysis earlier.
In our previous 15M Chart analysis we shared, If EMA5 cross and lock above 2761, then you can enter bullish. Otherwise stay away. There could be a small correction downward.
That is what exactly happened.
Please see our new analysis for today Friday 24 Jan 2025
Key Update:
ENTRY LEVEL: 2754.200
Bullish Target: 2762, 2771, 2780
Bearish Target: 2738, 2720
To achieve these targets, follow these steps.
BULLISH TARGETS:
EMA5 CROSS AND LOCK ABOVE 2755 WILL OPEN THE FOLLOWING BULLISH TARGET
2762
EMA5 CROSS AND LOCK ABOVE 2762 WILL OPEN THE FOLLOWING BULLISH TARGET
2771
EMA5 CROSS AND LOCK ABOVE 2771 WILL OPEN THE FOLLOWING BULLISH TARGET
2780
BEARISH TARGETS:
EMA5 CROSS AND LOCK BELOW 2750 WILL OPEN THE FOLLOWING BEARISH TARGET
2738
EMA5 CROSS AND LOCK BELOW 2738 WILL OPEN THE FOLLOWING BEARISH TARGET
2720
please support us by leaving our comments and boost the charts.
TheQuantumTradingMastery

Deutsche Bank: Unlocking New Heights!Deutsche Bank AG ( NYSE:DB is currently trading at $17.48 , reflecting a slight decrease of 0.11% from the previous close.
Our proprietary quantum probability indicator signals a strong buy, suggesting a favorable outlook for the stock.
The technical chart reveals a bullish flag formation, characterized by an initial surge to the $17.20 resistance level, followed by a consolidation phase.
A decisive breakout from this pattern indicates potential for continued upward movement, with a mid-term target of $24.31 .
From a broader perspective, the development of a cup and handle pattern is evident.
This bullish continuation pattern suggests a long-term projection above the major resistance at $27.28.
Recent developments further support this positive outlook.
Deutsche Bank has shifted its stance to "overweight" on European equities, citing lower interest rates and expectations of a strong corporate earnings season amid an improving political landscape.
Analysts highlight that Europe offers the most attractive equity risk premium among developed markets, with the European benchmark index projected to rise by 15% by the end of 2025 .
Additionally, Deutsche Bank's CEO, Christian Sewing , has emphasized the need for structural reforms and reduced regulations to enhance Germany's economic competitiveness, which could positively impact the bank's performance.
In summary, the technical indicators and recent strategic positions of Deutsche Bank point to a positive trajectory, with significant upside potential in both mid-term and long-term projections.

VISA Best buy opportunity since 2022.Visa Inc (V) is trading again above its 1W MA50 (blue trend-line) for the 3rd straight week following the rebound on early August's Low. That low apart from a Double Bottom is also a technical Higher Low formed at the bottom of the 2-year Channel Up.
The previous Double Bottom in October 2023 was exactly on the 1W MA50 and even though not at the bottom of the Channel Up, it did manage to kickstart a +27.36% rally. The Bullish Leg before it rose by +34.04% before also correcting back to the 1W MA50.
With the 1W MACD about to form the first Bullish Cross in 9 months, we have at hand the best buy opportunity on Visa, whose last 1W MACD this low was back on the September 2022 bottom! Our Target for the end of the year is $320.00 (+27.36%).
-------------------------------------------------------------------------------
** Please LIKE 👍, FOLLOW ✅, SHARE 🙌 and COMMENT ✍ if you enjoy this idea! Also share your ideas and charts in the comments section below! This is best way to keep it relevant, support us, keep the content here free and allow the idea to reach as many people as possible. **
-------------------------------------------------------------------------------
💸💸💸💸💸💸
👇 👇 👇 👇 👇 👇

MASTERCARD Short-term pull-back has begunLast time (August 23 2023, see chart below) we looked at Mastercard (MA) the 1D MA50 (blue trend-line) gave us a solid buy opportunity, which easily hit our 415.00 Target:
The price is now starting to pull-back after marginally breaking the top (Higher Highs trend-line) of the 1.5 year Channel Up (blue). It already broke below the medium-term (dotted) Channel Up and is headed towards the 1D MA50 (blue trend-line).
With the 1D RSI already on Lower Highs (i.e. a Bearish Divergence against the stock's Higher Highs), we believe this is an early Sell Signal on the short-term. The March 13 2023 Target was the 0.382 Fibonacci retracement level, so we are currently aiming for $440.00.
-------------------------------------------------------------------------------
** Please LIKE 👍, FOLLOW ✅, SHARE 🙌 and COMMENT ✍ if you enjoy this idea! Also share your ideas and charts in the comments section below! This is best way to keep it relevant, support us, keep the content here free and allow the idea to reach as many people as possible. **
-------------------------------------------------------------------------------
💸💸💸💸💸💸
👇 👇 👇 👇 👇 👇

UBS Group (UBSG): A Golden Opportunity for Investors?UBS Group (UBSG): SIX:UBSG
Considering that Switzerland is one of the first European countries potentially associated with interest rate cuts, sectors across the board, including the banking sector and specifically UBS Group, become quite intriguing. We've had to adjust and modify our analysis due to a breakout to the upside, suggesting a further upward trend before concluding the overarching trend. Please pay close attention if you're following along. We posit that Wave 2 concluded at 13.87 CHF, placing us in Wave 3.
We anticipate the reemergence of subordinate Wave ((iv)), which, in this case, should find support between the 23.6% and 38.2% levels. Given that all previous Wave 4s in UBS Group's pattern have been short and swift, we expect a repetition of this pattern, suggesting no further significant drops. Should we indeed pivot at the 38.6% extension level of 28.55 CHF and begin to develop Wave ((v)), we will issue a limit order once we observe tangible weakness in the price action. If there's an additional climb, our zone will be accordingly adjusted upwards.

📈 CITIGROUP GETS UP TO RECOVER, BREAKS THROUGH MULTI WEEK HIGHSCitigroup stocks hit highest since March 2022, last up 5% as brokerage Morgan Stanley upgrades NYSE:C to "overweight" from "underweight", as well as NYSE:BAC and NYSE:GS to "overweight" from "equal-weight".
Brokerage sees a rebound in capital markets amid growing signs of an imminent rebound in dealmaking. Also expects regulators to ease the Basel III Endgame proposals, a set of rules that will make capital requirements stricter for banks, which have been one of the flashpoints in the industry for months.
Brokerage says the proposals could be eased to be more aligned with Europe so that European banks do not have an unfair advantage.
Any easing of the draft rules will open the door for a significant increase in stock buybacks, as large-cap banks sit on the highest excess capital levels ever - NYSE:MS .
The main technical graph says that NYSE:C shares add +5.25% on Tuesday, break through multi week highs, with possible further recovery to multi year top $80 level.

ACIC Engulfing Price Spike, Long Uptrend Insurance ACIC on the daily chart looks like a solid swing trade until at least the next earnings. The last
trading session had a hugh 10-15% move with a corresponding spike in buying volume.
The earnings report is about a month away. I will drill down to a 120 minute time frame
and look for bottom pivots from which to accumulate a position for the pre-earnings
run up. It is an insurance stock, a conservative financial services play which from the chart
looks safe with a good possibility of some gains in the upcoming month.
Yeah if you look at the chart carefully you will notice that ACIC did 8X in 2023.

$BTCUSD Retraction Point Approaching The BITSTAMP:BTCUSD pair is nearing a crucial resistance level at $46,177, signaling potential price retraction.
Our indicator ( w.aritas.io ) suggest a gradual exhaustion of bullish momentum, with increased short positions. Additionally, the Relative Strength Index (RSI) is approaching the overbought (OB) zone, indicating a potential reversal.
Caution is advised, and a retracement to around $39,375 is anticipated. Traders should closely monitor these levels for potential trend changes.

Market Meltdown: Wall Street's Shocking Symphony Unveiled!In the heart of financial dynamics, where numbers narrate tales and markets hum a melody, we stand on the cusp of a riveting chapter. The surge in bond yields, the resonance of conflict in Gaza, and the corporate crescendos echo through Wall Street, crafting a narrative that captivates and challenges.
As we step into this unfolding saga, each market movement becomes a note in a symphony—a symphony where every rise in bond yields, every geopolitical tremor, and every corporate revelation plays a crucial role. Join me as we unravel the Overture of Wall Street, decoding the melodies that shape the financial landscape and beckon us into the intriguing world of global finance.
Bond Yields Surge: Unraveling the Threads of Economic Sentiment
The recent surge in the benchmark 10-year U.S. Treasury yield, cresting above 4.9%, serves as a seismic event with far-reaching implications. Traditionally, higher yields spell caution for equity markets, diminishing the allure of stocks in comparison to the safety of fixed-income assets. The market's reaction, characterized by a 1.3% dip in the S&P 500, underscores the anxiety stemming from heightened borrowing costs for both corporations and households.
This surge in bond yields is not merely a statistical blip; it's a harbinger of a delicate dance between the Federal Reserve and the broader economic landscape. The specter of swelling U.S. debt looms large, and as Bloomberg Economics warns, the increase in yields could act as a drag on economic growth, akin to the impact of a Fed rate hike.
Geopolitical Turmoil: A Catalyst for Market Volatility
The geopolitical tableau adds a layer of complexity, with the Gaza conflict acting as a catalyst. The deadly explosion at a Gaza hospital and the subsequent cancellation of a summit with Arab leaders have injected fresh uncertainties into the market psyche. Beyond the tragic human toll, the conflict reverberates through financial markets, notably elevating oil prices.
Oil, the lifeblood of economies, rose nearly 2% to $91.50 a barrel. The Israel-Hamas conflict and optimistic outlooks for Chinese demand became twin engines propelling oil's ascent. Investors, already grappling with bond yield tremors, now face the added challenge of navigating an energy market rife with geopolitical uncertainties.
Corporate Performance: A Tapestry of Triumphs and Tribulations
Against this backdrop, corporate performances play a pivotal role in shaping market trajectories. Morgan Stanley's stock stumbled after reporting a drop in quarterly net income, emblematic of challenges within the financial sector. Simultaneously, Procter & Gamble's shares surged as the company reported a quarterly profit boost, underlining the impact of strategic pricing decisions in an inflationary environment.
The corporate stage is set, with companies wielding the power to either fortify or erode market confidence. In the case of United Airlines, a 7% early decline in shares following a cut in year-end earnings forecasts exemplifies the tightrope walked by companies in a tumultuous market environment.
Market Performance: A Symphony of Red and Green
As the final notes of the market day resonated, the S&P 500, Nasdaq Composite, and Dow Industrials bore the weight of a 1.3%, 1.6%, and 1% decline, respectively. The Russell 2000, reflecting smaller companies, faced a more substantial 2.1% dip. This symphony of red underscores the impact of mixed corporate reports and the tightening grip of rising Treasury yields.
The decline is not confined to domestic shores; the MSCI World index echoes the sentiment, falling in tandem with its U.S. counterparts. The markets, in their collective wisdom, are sending signals of caution, reacting to the interplay of global and domestic variables.
Deciphering the Market's Sonnet
In conclusion, Wall Street's current state is akin to a sonnet, weaving together verses of bond yield surges, geopolitical tumult, and corporate performances. Each stanza contributes to the larger narrative of market sentiment, reflecting the delicate balance between risk and reward. Investors must read between the lines, understanding that every rise in bond yields, every geopolitical tremor, and every corporate report shapes the verses of the market's sonnet.
As we navigate these turbulent waters, an agile and discerning approach is paramount. The future remains unwritten, and while challenges abound, opportunities await those who can decipher the intricate melodies emanating from Wall Street's financial symphony.

Unity Software Inc.: The Future of Real-Time 3DUnity Software Inc. (U) is a leading provider of real-time 3D development tools. The company's platform is used by game developers, artists, architects, and other creative professionals to create interactive experiences.
Fundamental Analysis
The fundamental analysis of U stock is positive. The company is growing rapidly, and its financials are strong. U is also well-positioned to benefit from the growing demand for real-time 3D content.
Technical Analysis
The technical analysis of U stock is mixed. The stock is currently trading below its 20-day and 50-day moving averages, which are bearish signals. However, the stock is also trading near its support level of $37.00, which could provide a buying opportunity.
Overall, the fundamental analysis of U stock is positive, while the technical analysis is mixed. Investors should carefully consider both factors before making a decision about whether to buy or sell the stock.
I hope this post is helpful.
This analysis represents my thoughts at the date it is posted.
This analysis does not represent professional and/or financial advice.
You alone assume the sole responsibility of evaluating the merits and risks associated with the use of any information or other content found on this profile before making any decisions based on such information.
Any feedback is encouraged and appreciated. Thank you and have a nice day!

SOFI vwap crossover earnings 2 days LONGOn Friday the 28th SOFI had a good day. I am looking for more of the same going
into earnings. It dropped through the middle VWAP bands and remarkably rebounded.
Great volatility to be exploited. Some consolidation at the +1 Standard Deviation band
is normal and healthy. SOFI as a financial technology has been honing its margins
in a challenging environment. I see a long trade here and will take it being careful
to take profits quickly and pay attention to the earnings release. A stock trade on an
the intraday basis is considered. A 1 % stop loss is good enough since price is sitting on
dynamic support. The target is 10.0, the pivot high of mid-July, This is 2.5% for a modest
quick trade with a risk of 1 for a reward of 2.5. Just a basic trade at a good entry.

The Financials - back to the scene of the crimeTo the top of this channel again, and my guess is we go back down one more time. I'm thinking similar for the market - down for a nice drop and then a smaller bounce up to create more long term sideways action. The financials may outperform to the downside over the next few weeks/months, but should find support again around 31 - so a 20% drop is what I'm expecting soon. What would cause it? I have no idea.

Mastercard: Master the Hurdle! 🚧Mastercard should activate more upwards momentum to make it above the resistance at $390 – a feat in which it has succeeded already, albeit temporarily. Once above this mark, the share should vault into the green zone between $429.57 and $453.90 to complete wave B in green before returning below $390 again. However, we must keep in mind our alternative scenario with a probability of 33%: Mastercard might drop below the support at $340.21 to develop a new low first before heading further upwards. We would then expect this new low in the form of wave alt.(X) in magenta in the magenta-colored zone between $319.74 and $289.16.

Moody's Corporation WCA - Inverted H&S
Company: Moody's Corporation
Ticker: MCO
Exchange: NYSE
Sector: Financial Services
Introduction:
Hello and welcome to our technical analysis! Today we're examining the weekly chart of Moody's Corporation on the NYSE. A fascinating pattern within a pattern is currently unfolding, with an inverted head and shoulders formation potentially serving as a bottom reversal.
Inverted Head and Shoulders Pattern:
An inverted head and shoulders pattern typically serves as a bullish reversal pattern, signifying the transition from a downtrend to an uptrend. It's characterized by three successive lows with the middle low (the head) being the deepest and the two other lows (the shoulders) being shallower.
Analysis:
Moody's previous trend was clearly bearish, interrupted by a consolidation phase taking the form of an inverted head and shoulders. This pattern has been developing over 392 days.
Although the usual symmetry between the shoulders is absent, the right shoulder sitting higher than the left is typically a positive sign. Intriguingly, the right shoulder itself seems to be forming as a smaller head and shoulders pattern, all occurring above the 200 EMA.
The horizontal neckline of this pattern is at $325. A breakout above this level could provide an opportunity for a long position entry. Upon a successful breakout, our projected price target would be at $418.30, translating into a potential price rise of approximately 28.83%.
Conclusion:
The weekly chart of Moody's Corporation presents an interesting pattern within a pattern, where a short-term head and shoulders pattern forms within a longer-term inverted head and shoulders pattern. A confirmed breakout above the neckline could offer a promising long position entry.
As always, it's important to conduct your own due diligence and employ appropriate risk management strategies before making any investment decisions. Not financial advice
Thank you for joining this analysis. If you found it insightful, please like, share, and follow for more market updates. Happy trading!
Best regards,
Karim Subhieh

Financials Gain With Tech In PainWhen central banks raise rates, financial sector outperforms. That is until credit crumbles by which time all bets are off.
As federal funds rates spike and stay elevated for longer, lending rates will climb higher relative to deposit rates. Net Interest Margin ("NIM") which is the difference between lending and borrowing rates continues to favour financial services firms.
Inflation while softening remains high in developed and emerging markets. Hopes of Fed pivot on rates is fading as inflation is starting to spike again in some countries. Central banks on either side of the Atlantic are determined to tame it down.
Continued rate hikes push economies into recession, crush consumer demand while increasing credit (corporate & personal) defaults. At that stage, even the financial industry (“financials”) starts to feel the pinch. But growth and tech stocks will be hurt even more. These stocks will plummet as present values of future distant profits get discounted at higher rates.
As financials gain from attractive NIMs, growth stocks meanwhile are likely to get hammered from elevated rates. This case study articulates a spread trade to harness yields from these anticipated market moves.
Investors with portfolio exposure to S&P Financial Select Sector Index ("Financials Index") can participate in industry's outperformance. This index provides exposure to banks, mortgage firms, consumer financial firms, capital markets and insurance firms, among others.
A long position in CME E-Mini Financial Select Sector Futures and a short position in CME Micro E-Mini Nasdaq-100 Index Futures will deliver >2.7x reward to risk ratio.
HISTORICAL NEXUS BETWEEN TECH-HEAVY NASDAQ & FINANCIALS INDEX
Over the last 10 years, the ratio of the Financials Index relative to Nasdaq-100 touched a high of 0.0917 in July 2013 and a low of 0.0342 in November 2020. The ratio rises when financials outperform Nasdaq.
The ratio hovered around 0.072 on average from 2013 until the onset of pandemic linked monetary stimulus. It plunged when the monetary policy taps were let loose. Valuations of tech, high-growth, non-profitable firms soared relative to staid financials.
However, with QE substituted by QT i.e., from monetary easing to tightening, financials are set to fight back.
Frail demand with layoffs is the uncertain path ahead for tech. In contrast, financials appear poised with resilient balance sheets to swing the ratio back in its favour.
DEMYSTIFYING S&P FINANCIAL SELECT SECTOR INDEX
The Financials Index is market cap weighted and rebalanced quarterly. As of end February 2023, there were sixty-seven companies in total with the top-10 representing 53% of the index. Top-10 index constituents by weight and their 12-month price targets are summarised below.
Price targets (PT) for the top-10 point to an average appreciation of 12%. The average of maximum PT among the top-10 delivers a spectacular gain of 29%. However, the average of minimum PT among the same group shows a drop of 8%. Clearly analyst targets are skewed towards a healthy upside gain with limited downside risk.
FEDERAL FUNDS RATE TO STAY HIGHER FOR LONGER
In speaking to Barron’s, Brian Moynihan, CEO of Bank of America said that the Fed is going to have to leave the rates at a higher structure than people may believe. The Fed were late to the game, and they have got to keep rates high for long until it works through the system.
ELEVATED RATES HURTING DEMAND BUT INVESTORS REMAIN EERILY BULLISH
Tech sector is feeling the heat of melting demand. Revenues of S&P 500 tech firms is expected to grow only 2% this year. It is the slowest since 2016 as per Bloomberg Intelligence.
Q4 earnings have been sending worrying signals for the largest tech companies. Earnings from Apple, Microsoft, Alphabet, Amazon & Meta missed estimates by 8% on average, as per Bank of America.
Despite cracks in Q4 earnings, investors’ enthusiasm for tech stocks remains bubbly. Nasdaq is up 13% this year.
Rising share prices coupled with shrinking earnings estimates is pushing Nasdaq valuations into lofty zone. The Nasdaq is now priced at 24-times one-year forward earnings, compared to an average of 20-times over the last decade. Overpriced by 20% based on historical standards.
In contrast, financials price-earnings ratios, as represented by Financial Select Sector SPDR ETF is at a humble14.5-times. Every dollar of earnings per year requires $14.5 in financials compared to $24 in Nasdaq. In theory, the Nasdaq is 66% more expensive than financials.
Bullish markets this year has pushed Nasdaq stocks well ahead of price targets. This phenomenon might be the result of a bear market rally or short covering or rising retail participation or all of them. Consequently, ratio of financials to Nasdaq has slumped 9% so far this year setting the scene for an attractive spread trade entry.
TRADE SET UP
As central banks are determined to keep inflation down by keeping rates higher for longer, this paper demonstrates a long position in CME E-Mini Financial Select Sector Futures expiring in June 2023 (“financial futures”) and a short position in CME Micro E-Mini Nasdaq-100 Index Futures expiring in June 2023 (“Micro Nasdaq”) will deliver >2.7x reward to risk ratio.
Spreads require that the notional values of each leg of the trade to be identical. Each financial futures provides an exposure to $250 x S&P Financial Select Sector Index. Meanwhile, each Micro Nasdaq provides an exposure of $2 x Nasdaq-100 Index.
As of March 3rd, financial futures expiring in June 2023 settled at 446.4 while the Micro Nasdaq settled at 12,446.50.
Balancing each leg of the trade requires 2-lots of financial futures (2 lots x $250 x 446.4 = $223,200) and 9-lots of Micro Nasdaq (9 lots x $2 x 12,446.50 = $224,037).
Entry: 0.0359 (446.4/12,446.5)
Target: 0.0405
Stop: 0.0342
Profit at Target: $ 28,800
Loss at Stop: $10,350
Reward-to-Risk Ratio: >2.7x
MARKET DATA
CME Real-time Market Data helps identify trading set-ups and express market views better. If you have futures in your trading portfolio, you can check out on CME Group data plans available that suit your trading needs www.tradingview.com
DISCLAIMER
This case study is for educational purposes only and does not constitute investment recommendations or advice. Nor are they used to promote any specific products, or services.
Trading or investment ideas cited here are for illustration only, as an integral part of a case study to demonstrate the fundamental concepts in risk management or trading under the market scenarios being discussed. Please read the FULL DISCLAIMER the link to which is provided in our profile description.

GRIN. Holdings Ltd. for steady growth in global shippinJoin the smart investors who are banking on Grindrod Shipping Holdings Ltd for steady growth in the global shipping industry. With a diversified portfolio, strong financials, and experienced management team.
Diversified Shipping Services: Grindrod provides a diversified range of shipping services, including dry bulk shipping, liquid bulk shipping, and container shipping, which can potentially provide stability and reduce dependence on any single business segment.
Emerging Markets Exposure: has a significant presence in emerging markets, which can offer growth potential as these economies continue to develop and demand for shipping services increases.
Strong Financial Performance: has a history of strong financial performance, with steady revenue growth and profitability, which can indicate a well-run and efficiently managed company.
Growing Demand for Shipping Services: The global shipping industry is expected to grow as a result of increasing trade and economic activity, which can provide tailwinds for Grindrod's business.
Experienced Management Team: has an experienced management team with a strong track record of running the company and making strategic decisions, which can provide confidence to potential investors.
It's important to keep in mind that this is just one possible investment thesis and that past performance is not a guarantee of future results. It's crucial to conduct thorough research and consult with a financial advisor before making any investment decisions.
