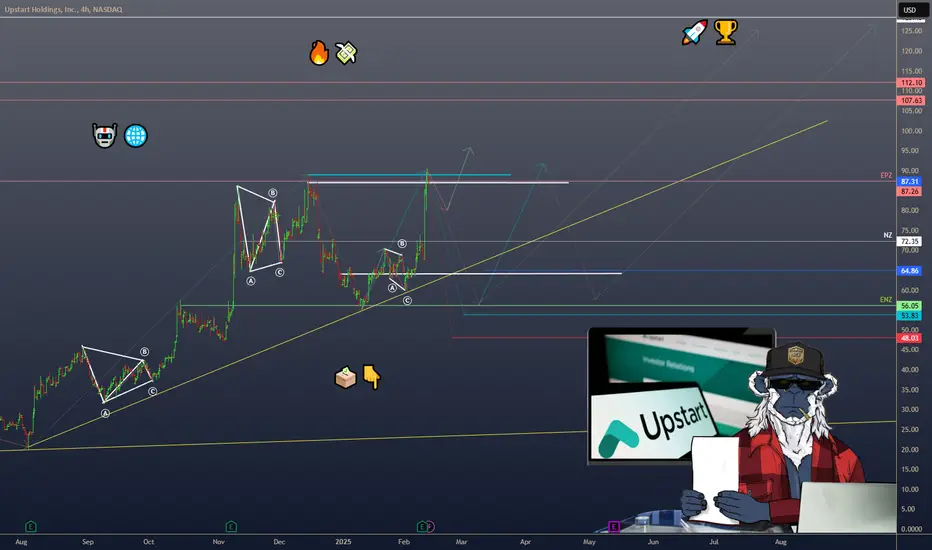
UPSTART ($UPST): AI-DRIVEN LENDING ON THE RISEUPSTART ( NASDAQ:UPST ): AI-DRIVEN LENDING ON THE RISE
1/8 – REVENUE & EARNINGS BLAST
• Q4 2024 revenue: $219M (+56% YoY) 🔥
• Powered by a 68% jump in loan originations 💸
• EPS: $0.26, beating estimates by $0.30 (analysts expected -$0.04) 🚀
• Positive Adj. EBITDA—Upstart’s inching closer to sustained profitability 🏆
2/8 – BIG FINANCIAL EVENTS
• Strong focus on AI model innovation + expanding funding supply 🤖
• Management bullish on earnings call—AI improvements = growth catalyst 🚀
• Renowned for bridging lenders & borrowers via advanced, automated credit assessments 🌐
3/8 – SECTOR COMPARISON
• Some valuation measures say overvalued (e.g., GF Value ~$28 vs. market ~$65) 🧐
• Outpacing fintech peers like SoFi, PayPal, Ally in revenue growth 📈
• Profitability & multiples (P/E, P/S) lag behind due to recent net losses 😬
• Unique AI-lending angle may justify a premium—if it pays off 💡
4/8 – RISK ASSESSMENT
• Partner Dependence: A few big lenders = high exposure ⚠️
• Economic Sensitivity: Loan defaults rise if consumer conditions worsen 🌪️
• Regulatory Hurdles: Shifting financial rules could dent operations 🏛️
• Credit Risk: Holding loans on the balance sheet—watch out in downturns 💥
5/8 – SWOT HIGHLIGHTS
Strengths:
• Advanced AI for credit analysis 🤖
• High automation in approvals ⚡️
• Scalable via partner expansions 🌍
Weaknesses:
• Limited operating history ⏳
• Recent financial losses 📉
• Reliance on key partners 🤝
Opportunities:
• New loan products (auto, HELOC, etc.) 🚗🏠
• Expanding digital lending market 🌐
• Gaining market share as AI evolves 🔬
Threats:
• Fierce fintech competition 🏁
• Possible regulatory changes ⚖️
• Macro headwinds affecting credit demand 🌩️
6/8 – UN/UNDERVALUATION DEBATE
• Some see big future potential → undervalued by growth prospects 💹
• Others worry about multiples & an over-reliance on economic upswings 😬
• Recovery depends on broader economic rebound & strong risk management 🏦
7/8 Is Upstart a gem or a risk?
1️⃣ Bullish—AI lending will transform fintech 🏅
2️⃣ Cautiously Optimistic—Need more stability 🤔
3️⃣ Bearish—Valuation & macro risks are too high 🚫
Vote below! 🗳️👇
8/8 – STRATEGY WATCH
• Keep tabs on new loan products & partnerships 🛠️
• Monitor economic indicators (defaults, credit demand) impacting revenue 💼
• Regulatory shifts can either boost or bury AI-lending advantage ⚠️
Fintech
$PYPL PAYPAL’S FINANCIAL LANDSCAPE: VALUATION & OPPORTUNITIESPAYPAL’S FINANCIAL LANDSCAPE: VALUATION & OPPORTUNITIES
1/8
PayPal ( NASDAQ:PYPL ) has been on the move lately—announcing a FWB:15B buyback and posting mixed but intriguing earnings results. Let’s dive into what’s making this fintech giant tick! 💳💡
2/8 – Recent Revenue Growth
PayPal’s revenue soared during the digital payment boom but has moderated recently.
Although the exact figures aren’t in the latest posts, growth since 2017 is substantial.
Stabilization might indicate a new normal in digital payments.
3/8 – Earnings & Guidance
Some quarters saw EPS pop by 61%—pretty impressive! 🚀
Mixed guidance ahead: margin expansion concerns and flat-to-down cash flow.
The FWB:15B buyback suggests management sees long-term potential.
4/8 – Valuation vs. Peers
Forward P/E near 10, PEG ratio of 0.52—that’s cheap compared to Visa/Mastercard.
PayPal straddles fintech + payments, competing with everyone from Square ( SET:SQ ) to Apple Pay.
Lower growth vs. some peers, but strong operating margins help PayPal stay ahead.
5/8 – Risk Factors
1️⃣ Regulatory: New rules could cramp expansion.
2️⃣ Market Saturation: Need emerging markets to fuel next leg of growth.
3️⃣ Competition: Stripe, Apple Pay, & countless fintech upstarts.
4️⃣ Tech Disruption: Blockchain, AI, or next-gen payments could reshape the landscape.
6/8 What’s PayPal’s biggest near-term challenge?
1️⃣ Regulatory Hurdles
2️⃣ Competition
3️⃣ Market Saturation
4️⃣ Tech Disruption
Vote below! 🗳️👇
7/8 – SWOT/SCOT
Strengths: Massive user base, recognizable brand, buyback confidence.
Weaknesses: Slowing user growth, uncertain future margins.
Opportunities: Emerging markets, strategic partnerships, AI integration.
Threats: Fierce competition, cyber risks, evolving payment tech.
8/8 – Your Next Move?
PayPal’s at a pivot—undervalued or a value trap? 💰
Let’s see if NASDAQ:PYPL can keep up the momentum!
#PayPal #Fintech #DigitalPayments #PYPL #Investing #Earnings #Valuation #Finance

Can AI Predict the Future of Payments?PayPal stands at the vanguard of the digital payment revolution, not merely as a facilitator but as an innovator through its strategic use of artificial intelligence (AI). This article delves into how PayPal is harnessing AI to redefine the parameters of financial transactions, challenging the reader to envision the future landscape of digital payments.
PayPal's integration of AI into its operational core has transformed it from a standard payment gateway to a leader in financial technology. By enhancing payment authorization rates and strengthening fraud prevention, PayPal leverages AI to predict and adapt to user behaviors and transaction patterns. This predictive capability ensures smoother, faster, and more secure transactions, pushing the boundaries of what was previously thought possible in digital payments.
The application of AI to improve payment authorization is particularly groundbreaking. Through sophisticated analysis of vast datasets, PayPal's AI models can predict declines, suggest retry strategies, and optimize transaction processing. This not only led to higher authorization rates but also improved user experience, prompting businesses and consumers to reconsider the effectiveness of digital transactions.
In the realm of fraud prevention, PayPal's AI-driven approach sets a new standard. By employing machine learning and graph technology, PayPal maps out transaction networks to spot anomalies in real-time, drastically reducing fraud while minimizing disruptions from false positives. This dual focus on security and user experience presents a compelling case for how technology can be both a guardian and a facilitator in the financial world, urging us to consider the balance between innovation and safety in our digital interactions.
PayPal's journey with AI doesn't just highlight its current capabilities but also signals its readiness for future challenges in the digital payment landscape. As we ponder the implications of such technological advancements, we are invited to explore how AI could further shape the economy, security, and daily financial interactions, making PayPal not just a leader today, but a visionary for tomorrow.

Profile Software: DORA and lightning speed at 6.20 eurosProfile Software (PROF) has been hitting new all-time highs in its share price for six consecutive years. Nothing in its fundamental development indicates that it will miss the rendezvous of the all-time highs in 2025, 2026, 2027,…
It is perhaps the only stock on the Hellenic Stock Exchange that has not fallen below the Volume-Weighted Moving Average (VWMA) index in the last seven years, which uses the volume-weighted average price (VWAP).
This index shows that wherever a medium-term investor bought the stock within the 80-day range represented by each printed candlestick, he would come out a winner.
So Profile, with its backlog of projects of 120 million euros in combination with recurring revenues, without entering into any new agreements in the coming years, will generate 10 million euros of net cash annually, which means that by 2027 the group will have a fund of 30 million euros, where if we add the current 10 million euros, we go to 40 million euros.
That is 1/3 of the current capitalization and this without hypothetically the group having income from new agreements for 3 years. We are talking about such a strong package that it can easily cover even an acquisition of more than 60 million euros, thus radically changing all the data of the sizes that we know.
The diagrammatic analysis of the share gives, through the upward channel “Q”, a price forecast for 2025 that reaches 7.24 to 8.04 euros. The stock has developed peculiar triangular formations in an upward direction since 2019, mainly after formations of stabilization and upward division and escape to higher price levels.
Most recently, in the long-term chart of 80-day candlestick prices, the upward breakdown occurred at 1.846 euros and spread to 4.64 euros. Now, this level has been bypassed upwards and the spread to new unexplored price levels extends to 8.04 euros or +55% from current price levels. In fact, due to the strong slope, the movement from 5.30 to 6 euros will be lightning fast, that is, in a short period of time.
A movement that is very likely to be brought to us by … DORA (Digital Operational Resilience Act). The regulation is a modern EU law to strengthen the digital resilience of financial institutions, in view of the growing challenges in the digital world and given the high need to shield banks from cyberattacks.
The rest coming soon.

$USIO breaking outBased on this technical chart USIO is about to go through major correction. We see volumes picking up after Q3 results and two months of accumulation. My price target for 2025 is $5+ with future above $10. At that point we'll reevaluate.

Long TIGR (Maybe Double Up)
NASDAQ:TIGR is a fintech company incorporated in Singapore and headquartered in Beijing. Think HOOD for asian markets, and having direct access to those equities. From the chart you can see they clearly align with the China trade and do get a huge boost if we see China's market pick up.
Current Position:
Average Share Price $5.87 and continuing to buy this up.
Options
$6 12/20/2024
$4 01/17/2024
$5.50 04/17/2025
$5.50 01/16/2026
$5.50 01/15/2027
Still adding. I think $10 is pretty likely even in the short term, but obviously taking some long plays as well, and just picking my spots to grab options when IV is reasonable and I can get some deals. If the China / Asia trade gets some legs, I don't think $20-$25 is out of the question.
My Reasoning
They just did a pretty sizeable offering Oct 23 at $6.25 of 15 million shares, with underwriters getting the opportunity to buy an additional 2.25 million in the 20 days after the offering. (Which they did). This caused approximately 10% dilution to existing share holders. Share price held up pretty well and already trading well above the offering, even while the rest of China continues to downtrend or chop.
2024 Q3
- Revenue: $101 million - record high (44.1% year-over-year increase).
- Net Revenue: $30.84 million - the highest in 3 years (15% year-over-year increase).
- Net Income Attrib. to Ordinary Shareholders: $17.8 million (34.0% year-over-year increase).
- Assets under management: $19.8 billion (115.9% year-over-year increase).
- Funded Accounts: 1,035,000 (19.3% year-over-year increase).
- Total Accounts: 2,370,000 (10.2% year-over-year increase).
- Trading Volume: $163 billion, (103.1% year-over-year increase).
- Net Profit Margin: 17.6% (-1.3% year-over-year decrease).
All while the Asia trade has been pretty much a no go.
In January 2024 they were issued a Type 1 license (Allowing crypto on the platform) and in July 2024 they got Type 9 license (Allowing client asset management services). Two other brokerages have also been given Type 1 licenses in 2024 FUTU and HKVAX (HKVAX also got type 7 for automated trading).
FUTU is a significant competitor with 12x the market cap of TIGR, 2x the assets under management (grew 40% year-over-year), and 4x the revenue (grew 29% year-over-year), and greater brand recognition. But with 12x the market cap and lower growth numbers, TIGR seems like the better play for now, although I might add some FUTU as well.
TIGR has not released specific geographic breakdowns but they have mentioned 75% of funded accounts are outside of mainland China (Q1 2024). Singapore, New Zealand, Australia, United States all mentioned as growth stories.
They have a sizeable user base now, and growing rapidly. If you are long enough term you also just have the cultural tides in your favor as Asia, India are seeing retail investor participation increase rapidly.
I look at this and see a double up just based on the companies growth story while Asia trade has been less than ideal . If we get an actual China pump 2.5x, 3x not out of the question.
Risks
I mean China right, TIGR is incorporated in Singapore which is slightly better and analysis would lead me to believe that a majority of their assets under management are in Singapore but we all know China could yank a license, attack Taiwan, or do some other bull and send the stock tumbling. It's a foreign company, the reporting requirements are different, more opaque, and harder to analyze. Other risks include just the history of the company, offerings are not super rare occurrences and the balance sheet historically is not pretty. This was not a well oiled machine from the beginning. Still a chance management blows it, you also have real competition with FUTU.
However, you can't just luck into the numbers above so things are changing. IMHO.

Square ($SQ) Set to LAUNCH! 84% Upside!🔥 Square ( NYSE:SQ ) Ready to Skyrocket! 84% Upside! 🚀
📢 High Five Setup Alert on Block ( NYSE:SQ )!
My H5 Indicator is flashing green, signaling a prime opportunity to take a position in $SQ!
Key Highlights:
Bullish Breakout: We’ve broken out of the Bullish Falling Wedge pattern and successfully retested.
Volume Ignition: Launching off the volume shelf with a volume gap to fill, setting up for a powerful move.
📈 Price Targets:
Primary Target: $149
Main Move Target: $162
This setup is primed for action! Will you be adding NYSE:SQ to your watchlist? Stay tuned for more insights!
👍 Like | Follow | Share 👍
Stay updated with weekly trade ideas using my HIGH-FIVE SETUP trading strategy. Don’t miss out on the next big move!

SQUARE is retesting the Inverse H&S before heading 80% higher! NYSE:SQ SQUARE (BLOCK) is retesting the Inverse H&S before heading 80% higher!
The trading gods have blessed us with a pullback to around $90ish, as requested. This is the retest of the Inverse H&S pattern.
-H5_L indicator is GREEN
-Already broken out of falling wedge.
-Launched off Volume Shelf and filling the GAP.
-Fintech is starting to run
-Stage 2 is just starting!
Buying more here!
🎯$110
🎯$149
🎯$162
NFA

SQ multi month breakoutAbove $90, there’s clear skies until $115
This chart is looking phenomenal !!
We can see a massive bull run for the next couple of months. Fintech stocks have been strong compared to the overall market.

High Five Setup Alert on Block $SQ !! 84% Upside!🔥 Square ( NYSE:SQ ) Ready to Skyrocket! 84% Upside! 🚀
I posted this earlier, but a couple of people requested a video analysis on Square (BLOCK), so here it is; enjoy!
📢 High Five Setup Alert on Block ( NYSE:SQ )!
My H5 Indicator is flashing green, signaling a prime opportunity to take a position in SQ!
Key Highlights:
Bullish Breakout: We’ve broken out of the Bullish Falling Wedge pattern and successfully retested.
Volume Ignition: Launching off the volume shelf with a volume gap to fill, setting up for a powerful move.
📈 Price Targets:
Primary Target: $149
Main Move Target: $162
This setup is primed for action! Will you be adding
SQ
to your watchlist? Stay tuned for more insights!
👍 Like | Follow | Share 👍
Stay updated with weekly trade ideas using my HIGH-FIVE SETUP trading strategy. Don’t miss out on the next big move!

MULTIBAGGER Series - Stock 3Hello everyone!
I am back with 3rd company of the multibagger series.
The company is Zaggle Prepaid Ocean Services Ltd. Zaggle builds world-class financial solutions and products to manage the business expenses of corporates, SMEs, & Startups through automated and innovative workflows. It is at an intersection of SaaS (Software as a service) and Fintech. It has made strategic alliances with many other companies. The company has an esteemed list of corporates like Tata Capital, Inox, NSDL, DBMS, Wockhardt, Yes Bank, Greenply, etc. It has also made an agreement with VISA and the deal is valued at approximately $20 million over the next five year.
The company has shown more than 10x growth in both sales and profit made in the past 4 years. Last year sales was 776 cr and profit was 44 cr. The quarterly sales and profit is also continuously increasing and the company is expected to grow at a good pace from here. They have made visionary targets for the year 2025. Ace investor Ashish Kacholia has also invested in this company.
Investing in such companies will make our portfolio diverse and as they are smallcap company, chance of giving multibagger returns are more from such companies.
Investing in such companies bring a high risk factor so please do your own analysis before investing.
Hope you learned something new from this post.
Do like, share and follow me. Thank you!

SoFi Technologies (SOFI) AnalysisCompany Overview: SoFi Technologies NASDAQ:SOFI has been on an impressive growth trajectory, with its member base increasing by over 40% year-over-year to reach 8.8 million as of Q2 2024. This significant expansion underscores SoFi's ability to not only acquire new members but also retain and cross-sell to its user base, positioning the company as a major player in the fintech space.
Key Catalysts:
Product Mix Shift: The strategic shift from a reliance on lending products to a broader array of financial services products—which now outpace lending offerings—boosts margins and improves the lifetime value of SoFi’s customers. This diversification strengthens the company's business model by lowering its dependence on traditional loans.
Earnings Momentum: SoFi has consistently outperformed earnings expectations, evidenced by 11 upward revisions in the last 90 days. This signals strong financial management and operational efficiency, which is expected to drive further investor confidence.
Growing Member Base: SoFi's ability to grow its member base at a 40% annual rate is a clear sign of the company’s competitive advantage in the fintech space, particularly through the seamless cross-selling of products across its ecosystem.
Investment Outlook: Bullish Outlook: We are bullish on SOFI above $9.00-$10.00, as the company’s ability to grow its member base and shift to higher-margin products sets the stage for sustained growth and stock appreciation. Upside Potential: Our upside target for SOFI is $15.00-$16.00, driven by strong earnings performance, a diversified product mix, and expanding membership, all of which contribute to improving financial metrics and stock valuation.
🚀 SOFI—Fintech Leader on a High-Growth Path. #Fintech #FinancialServices #EarningsOutperformance

$SOFi soared 8 days straight, 15minOn Thursday, Oct 10 I purchased two NASDAQ:SOFI 15 NOV 24 9c @ $64 ($128 total).
ENTRY @ $8.72 (12:27pm, Thu, Oct 10) because I noticed NASDAQ:SOFI had been undergoing a temporary recovery to the upside.
EXITs @ $9.99 & $9.93
- 1 contract - Profit taking at 120% ($64 -> $141), Mon, Oct 14 @ 1:18pm
- 1 contract - 6% trailing stop triggered at 114% ($64 -> $137), Mon, Oct 14 @ 2:15pm
Total revenue: $278 || Profit: $150
This is a good point to grab profit because price is around the 0.214 fibonacci and there is a gap to fill to the bottom which increases the chances of the stop dropping below continuing its journey to the upside.

Fiserv: Trading Opportunities!Recently, the FI stock surged directly into our green Target Zone (coordinates: $186.40 – $207.40). This year alone, it has gained over 40%. With the recent arrival in our Zone, the time is now ripe for an overarching trend reversal. Because: by hitting our Zone, the price has reached the absolute minimum target for the green wave . From a technical perspective, an immediate trend reversal and a transition into wave II are now possible. At the moment, we place Fiserv in the turquoise wave 3, which should be followed by another dip below our Target Zone. Ultimately, the entire turquoise upward impulse should complete the overarching uptrend of the beige wave I. Thus, our Zone can be used to take profits from existing long positions or to initiate new short trades. Such potential short positions can be hedged with a stop 1% above the 78.60% retracement level (at $207.40).

MercadoLibre (MELI): A Powerhouse in Latin America! MELI is solidifying its position as a dominant player in the e-commerce and fintech markets across Latin America. With Argentina’s economic surge and aggressive expansion in Brazil and Mexico, MELI is poised for significant growth.
📈 Key Highlights:
Economic Recovery in Argentina driving e-commerce activity.
Expansion into logistics and food delivery diversifying revenue streams.
Growing adoption of Mercado Pago enhances its financial ecosystem.
While I see strong fundamentals supporting a buy rating, a 5% drop could offer a better entry point. My fair price estimate is $2,709, based on a 5 year DCF analysis.
Let's keep an eye on the support levels around $1,936 and $1,824.
#MELI #MercadoLibre #Investing #StockMarket #Ecommerce #Fintech #LatinAmerica #GrowthStocks #InvestmentOpportunities #Stocktobuy #Pullback

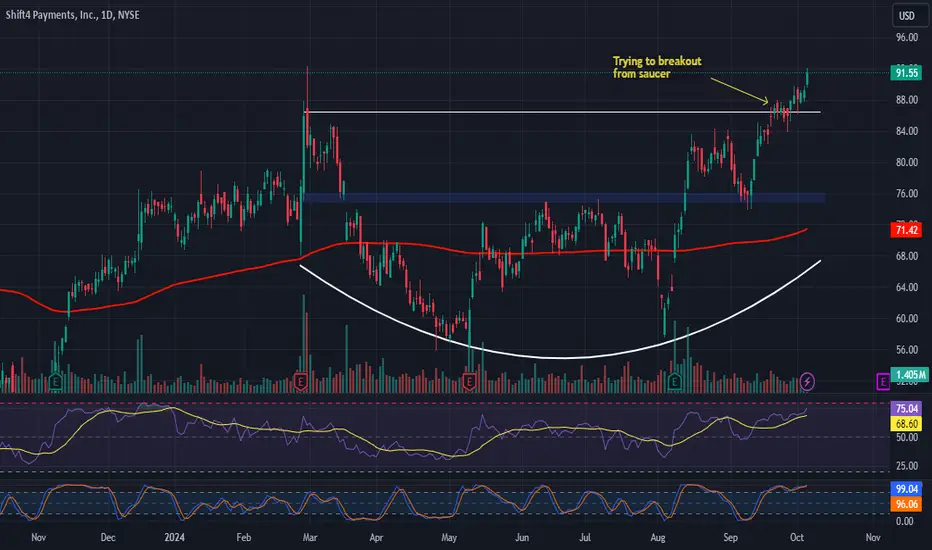
Shift4 Payments (FOUR) Analysis Company Overview: Shift4 Payments NYSE:FOUR continues to demonstrate impressive growth, specializing in payment solutions tailored for industries such as hospitality, entertainment, and sports venues. With a unique focus on vertical integration, Shift4 is capturing more market share through high-profile partnerships and technological innovation.
Key Catalysts:
Strong Payment Processing Growth: In Q2 2024, Shift4 processed a remarkable $40.1 billion in payments, up from $26.8 billion in Q2 2023. This marks a 75% CAGR since 2020, highlighting sustained growth in its core business.
High-Profile Partnerships: Recent partnerships with Nobu Hotel and the Chicago Bears stadium reflect its expanding reach and capability to serve large-scale clients in major industries.
Insider Confidence: CEO Jared Isaacman’s purchase of 86,000 shares underscores strong insider confidence in the company’s long-term growth prospects.
Investment Outlook: Bullish Outlook: We are bullish on Shift4 Payments above $75.00-$76.00, given its accelerating growth in payment processing and strategic partnerships. Upside Potential: Our upside target is $118.00-$120.00, based on continued market share gains and operational momentum.
🚀 FOUR—Revolutionizing Payments with Strong Growth. #Payments #Shift4 #Fintech
Is PayPal's Rise Unstoppable?PayPal, once a mere online payment facilitator, has evolved into a financial powerhouse. Its strategic partnerships, innovative ventures, and consistent financial performance have solidified its position as a dominant player in the digital payments landscape.
The company’s recent investment in Chaos Labs, a blockchain risk management firm, underscores its commitment to staying ahead of the curve and embracing emerging technologies. This strategic move not only positions PayPal as a leader in the blockchain space but also highlights its ability to identify and capitalize on future trends.
Moreover, PayPal’s partnership with Amazon has significantly expanded its reach and boosted investor confidence. By integrating PayPal as a checkout option for third-party merchants, Amazon has effectively made PayPal a more accessible and convenient payment method for millions of consumers. This strategic alliance has not only driven revenue growth but has also fueled PayPal's stock price.
Beyond Amazon, PayPal's collaborations with Shopify, Adyen, and other industry leaders have further diversified its business model. These partnerships have allowed PayPal to tap into new markets, reach a wider customer base, and enhance its value proposition.
The increasing confidence of institutional investors in PayPal is a testament to its strong fundamentals and growth potential. As investors continue to seek out stable and profitable investments, PayPal’s consistent performance and strategic initiatives make it an attractive option.
In conclusion, PayPal's journey from a simple online payment platform to a financial powerhouse is a testament to its ability to adapt, innovate, and deliver value to its stakeholders. With its strategic partnerships, blockchain ventures, and solid financial performance, PayPal is well-positioned to continue its upward trajectory and remain a dominant force in the digital payments industry.

RDFN fintech small cap reverses higher LONGRDFN on the 15 minute chart has move up from a low pivot which included a mass index
indicator triggering. ATH was $85 so current price is 7-8% of that ATH. I will take a long trade
here. My targets are the May high pivot at $8 and the January high pivot at $10 with a stop
loss at $6 to be managed as the price moves toward 8. RDFN to a certain degree is subject to
rates and federal actions. I am convinced that when the time is ripe the Biden administration
will pressure the " independent" fed into a rate cut which should give RDFN the momentum it
needs to push toward those targets or even higher.

TGL Fintech with a push discounted 96% from ATH LONGI am watching TGL for a short squeeze. A recent pivot high in the past year was about 37 and
the ATH of 168 was the winter and spring of late 2022 and early 2023. This is an app that
matches merchants and consumers with incentives to both to deal and make transactions.
I believe that it has been heavily shorted while in a persistent trend down. Relative strength
has been rising and the TTM triggering. A spike in relative volume was more than 50X. I have
taken a position and have an unrealized profit of 22% however, I expect more and will add to
the position given a dip from the high of 8 down to 6. For the time being the targets are 10.5
and 12, where I will take off 25% of the position at each level. IF TGL can squeeze and maintain
momentum over the weekend, next week could be a bigger move.

GRAB - Penny Stock Volatility Based LONG GRAB is a multi-dimensional fintech company serving SouthEast Asia. It does there what DASH
UBER and PYPL do in the US. Like many other or even most penny stocks it has volatility
which is the foundation for swing trading it for good profits. On the 60 minute chart are
the horizontal supply and demand zones as well as dynamic areas of high volume and volatility
as anchored VWAP bands and lines used for analysis that GRAB is now in the area of the
first lower band line and is predicted by the Luxalgo regression forecast to fall into the
demand zone confuent with the second lower band line. For forecast for after a predicted
bounce, GRAB will move higher toward the supply zone on the chart. Accordingly,
I will watch GRAB to fall into the demand zone where it will pick up long buyers such as
myself. I sell set a stop loss at 2.90 and two targets, the first being the mean VWAP level
of 3.2 for a close of 1/3rd of the position and then 3.4 ( first upper VWAP) for a close
of another 1/3rd of the position and finally a target of 3.55 just under the demand zone.
The trade is for a trade of about 15% gain over 1-2 weeks which needs little attention when
alert/ notification price levels are set. This allows for stress free trading without much
effort or screen time.

FTT: trade in renge📊Analysis by AhmadArz:
🔍Entry: 1.84
🛑Stop Loss: 1.72
🎯Take Profit: 1.95-2.05
🔗"Uncover new opportunities in the world of cryptocurrencies with AhmadArz.
💡Join us on TradingView and expand your investment knowledge with our five years of experience in financial markets."
🚀Please boost and💬 comment to share your thoughts with us!

Is PYPL ready for recovery?n the daily chart PYPL is at its six-month lows sitting on the support /demand zone after recent
earnings which were helpful in showing earnings and revenues holding up. Upside to resistance
is about 25%. The volume profile shows heavy volumes at both the current price and at $75
Any upward price action would likely experience volatility at $7 5 as that is where a large
a number of institutional traders are situated. This is also approximately where the mean long
term anchored VWAP is extending. The MACD indicator's lines have crossed under the histogram
which is now green and positive. They are approaching the horizontal zero line. Trading volumes
have increased since the last earnings and so shares are being accumulated which usually
results in prices rising gradually over time.
I see this as an excellent long trade setup targeting first $ 75 and then $87 just under the
resistance zone with a stop loss in or under the support.

PYPL falls into deep oversold zone LONGPYPL on the 30-minute chart over the past week fell 10 %, Based on the anchored
VWAP bands as well as the volume profile it is in deep oversold territory potentially
as a reaction to the stablecoin plan. Volumes are relatively hig while the ZL MACD
has had a line cross under a flipping histogram. I see this as an excellent long
swing trade setup targeting the mean VWAP or the POC line as the first target for 50%
of the trade and 25% each targeting the upper VWAP lines. I will take a combination
of a number of stocks and a put option 2-3 months out for some trade risk insurance.
