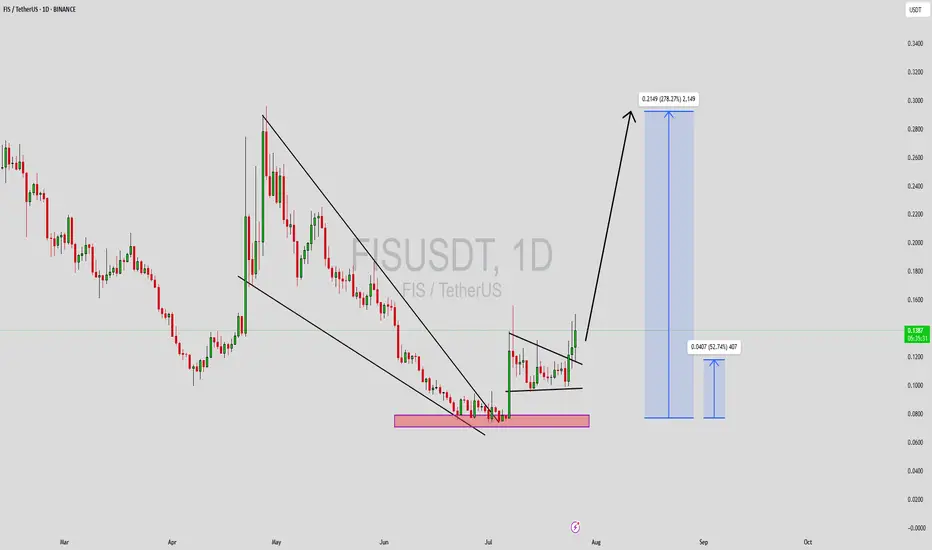
FISUSDT Forming Falling WedgeFISUSDT is forming a textbook falling wedge pattern on the daily timeframe, a well-known bullish reversal signal that often precedes explosive upside breakouts. After an extended corrective phase marked by declining price and compressed volatility, the asset appears to be nearing a breakout zone. The narrowing structure of the wedge, paired with a gradual increase in volume, is a promising setup that signals growing buyer accumulation and a potential shift in market sentiment.
The falling wedge is one of the most reliable bullish continuation and reversal patterns in technical analysis, especially when backed by solid volume, as we’re now observing with FISUSDT. Once the price decisively breaks above the wedge’s resistance line, momentum could accelerate rapidly, triggering a sharp move to the upside. Based on current market conditions and historical price behavior, a target of 240%–250% gain is not out of the question as FIS reclaims previous support levels turned resistance.
Increased investor interest in this project is another key factor to monitor. Social metrics and on-chain activity suggest renewed enthusiasm in the ecosystem, which often precedes strong price performance. Coupled with favorable technicals and a bullish overall structure, FISUSDT offers a compelling opportunity for traders and long-term investors looking for high-risk, high-reward setups.
As always, patience is crucial when trading patterns like the falling wedge. But with technicals aligning and volume confirming accumulation, FISUSDT may soon begin its breakout phase and enter a powerful uptrend.
✅ Show your support by hitting the like button and
✅ Leaving a comment below! (What is You opinion about this Coin)
Your feedback and engagement keep me inspired to share more insightful market analysis with you!
FIS
FISUSDT Forming Bullish WaveFISUSDT is currently showing an interesting bullish setup, capturing the attention of crypto traders who are watching for fresh altcoin opportunities. The formation of a bullish wave pattern, supported by steady volume, suggests that FIS could be primed for a strong breakout in the near term. Technical analysts are forecasting a potential price surge of 40% to 50%+ if the bullish momentum sustains and key resistance levels are cleared with conviction.
The sentiment around FIS is improving as more investors recognize its utility and real-world use cases within decentralized finance and staking solutions. The network’s continuous development and strategic partnerships are adding to its long-term growth narrative. This has helped FIS build a loyal community and attract new capital inflows, which is crucial for maintaining positive price action.
From a technical perspective, traders should look for confirmation of this bullish wave pattern by tracking the breakout above trendline resistance and keeping an eye on volume spikes. If the breakout is supported by strong buying interest, the coin could deliver impressive returns in the coming weeks. The crypto market’s overall uptrend could further support this move, making FISUSDT one to watch closely for swing trading setups.
✅ Show your support by hitting the like button and
✅ Leaving a comment below! (What is You opinion about this Coin)
Your feedback and engagement keep me inspired to share more insightful market analysis with you!

FISUSDT Forming Falling WedgeFISUSDT is currently displaying a classic falling wedge pattern, which is widely regarded as one of the most reliable bullish reversal signals in technical analysis. This pattern suggests that sellers are gradually losing their grip, while buying pressure is steadily building up inside this narrowing range. With volume starting to align positively with this structure, the setup is gaining momentum for a potential breakout that could yield an impressive 190% to 200%+ upside move if confirmed.
StaFi (FIS) is an innovative project that focuses on unlocking liquidity for staked assets — an area gaining increasing traction within the DeFi ecosystem. As investors look for opportunities to maximize yield without compromising on network security, interest in projects like StaFi is expected to grow. This increasing attention could act as a strong fundamental catalyst, complementing the promising technical setup and fueling sustained buying interest in FISUSDT.
For traders watching this pair, it’s crucial to monitor the breakout zone above the descending trendline. A decisive close above this resistance, backed by strong volume, could trigger a significant rally towards key psychological price levels. Historically, falling wedge breakouts can deliver explosive moves as sidelined investors jump in to catch the momentum. This makes FISUSDT a compelling chart for both swing traders and position traders seeking high-risk, high-reward opportunities.
Keep an eye on the broader crypto market sentiment as well, since a supportive macro trend can further amplify this breakout. With the perfect blend of technical strength, solid fundamentals, and growing investor interest, FISUSDT could be set to surprise many market participants with its next major move.
✅ Show your support by hitting the like button and
✅ Leaving a comment below! (What is You opinion about this Coin)
Your feedback and engagement keep me inspired to share more insightful market analysis with you!

The opportunity to earn money on the vib exit pumpIn the coming days, against the background of the beginning pullback in the market, oversold coins from the delisting announcement may become very interesting for speculators, since for strong altcoins that have shown good growth this month, the probability of falling within the rollback prevails, and the threat of assigning the monitoring tag in the second half of the week hangs over weak coins. Today, there was not enough volatility in the market for the breakdown of vib wing and pda due to the lack of futures on them. After the stock market closes over the weekend, there is a possibility of a stable payback of these instruments with major breakouts. There is also a possibility of growth impulses at the beginning of the new week, especially from Tuesday evening to Wednesday, as part of a pullback on the current monthly candle, and on May 1st, a new monthly candle. Against the background of the beginning of the sales period, there is a possibility of disruptions tonight and from Sunday to Tuesday. Vib is in an extremely oversold position, and therefore a slight additional drawdown is possible. If the price approaches 0.01, there will be a good opportunity to buy, which will bring up to 150% profit even with weak dynamics and a retest of 0.025. An additional drawdown of up to 0.5 is possible for wing, and up to 0.00600-750 for pda. With sufficient volatility, there is a chance of growth up to 0.050-75 for vib, 2.5-3.5 for wing and 0.021-25 for pda.
Working with coins from the delisting announcement is extremely dangerous due to high volatility, but it can be extremely profitable, which we observed during the pumps of the previous delisting and the example of alpaca.
In the second half of the week, after assigning the monitoring tag, I will select coins without the tag that are insured against delisting.

The end of seasonal growth, reducing work positionsThe seasonal growth cycle is ending this week. For most of the market, the sales cycle begins on Sunday. In the new week, we can still expect pumps for the turn of the month for individual coins. From Sunday to Tuesday, the probability of a market drawdown prevails as part of a pullback on the current weekly candle and shadow rendering for the new week. For coins that have already attempted to turn the month around, the probability of stable sales until the end of May already prevails from this week. From Tuesday to May 7-9 or 11-12, there will still be a flat period, when, with a general market pullback, individual coins may show growth, then the probability of a return of ether to 1500-1600 prevails, with a possible reversal and drawdown of the altcoin market. Today and tomorrow, I recommend reducing positions on coins, especially those that have shown good growth, in order to avoid drawdowns in the new month.
In the first half of the new week, growth impulses for coins that have not yet attempted to turn the current monthly candle into a bullish one are more likely. In particular, pumping is possible using vib wing and pda, which are awaiting delisting. For coins without the monitoring tag, it is better to make further purchases after the announcement of the tag assignment in the new week, because after the rollback from Sunday to Tuesday, coins can lose up to 50% additionally in the second half of the week if the tag is assigned. I will collect the list of coins for work in May after the announcement of the tag assignment.

Stafi Long-Term PREMIUM Full Trade-Numbers (PP: 2063%)Stafi is now trading at bottom prices after hitting a new All-Time Low and this is a great place to enter. This is the perfect chart setup for spot traders.
Here I will share the full trade-numbers for this pair, FISUSDT, and share some of the chart technicals with you that reveal the upcoming change of trend.
Let us start with how to predict a bottom based on the chart structure and the candles.
Notice the "bearish wave" on the left side of the chart. Notice the size of the wave, the length, strength and duration. A "bear market." Simply a long-term correction.
Now, notice the "bottom wave" on the right side of the chart (orange). Notice the size, the length and duration. It is very steep. It goes very fast and it is small thus short-lived.
» The first one is a market phase/cycle while the second one is a market reaction.
» The first one led to a sideways market while the second one will lead to a change of trend.
There are two sets of numbers. Here I am only using one for the trade below but I would still like to explain this method that I use in case you want to learn to do your own numbers by looking at charts.
The first set of numbers uses the All-Time High and the bear market bottom. In this case this would be the peak price 01-March 2021 and the low set 09-May 2022. The low is the zero and the peak the one using the Fibonacci extension tool. The 1.618 is the standard ATH projection. If you are feeling confident, the market is producing strong higher lows, the pair is good, there is strong volume, etc. You can also consider the 2.618 level which is not shown on this chart. Of course, if you move the chart up a little bit you can easily see it.
The second set uses the current market bottom, in this case the low 7-April 2025 and the previous high, 09-Dec 2024. This will give you a set of numbers that you can use to extract also some short-term targets. The first set would only have long-term targets.
When a trading pair produces new All-Time Lows we say that a new All-Time High is not likely but this isn't necessarily true, this is a technical assumption. The truth is that anything is possible and not even the insiders and exchanges who control the bots that control the price of a chart know how far up a pair can really go. When the euphoria phase of a bull market starts it is hard to maintain control.
A bullish wave can be neutralized with massive selling pressure. This is done all of the time. If any trading pair starts to grow organically for whatever reason on any exchange, the bots owned by the exchange immediately start selling and balance thing out, they just don't like things moving in ways that they do not control.
Anyway, let's continue; Full trade-numbers below:
_____
FISUSDT (PP: 2063%)
CURRENT PRICE: $0.1263
ENTRY:
1) $0.1420
2) $0.1150
3) $0.0999
TARGETS:
TP1: $0.1852
TP2: $0.2361
TP3: $0.3206
TP4: $0.3889
TP5: $0.4571
TP6: $0.5543
TP7: $0.6781
TP8: $0.8888
TP9: $1.0356
TP10: $1.2566
TP11: $1.4140
TP12: $1.6141
TP13: $2.1926
TP14: $2.7711
STOP: Close monthly below $0.0990
_____
No stop-loss. When trading spot you should be ready to wait for years. That's the mindset. If you are not ready to wait for years, well, you can do whatever you want of course but with this mindset you can never go wrong. There are many ways to approach a trading pair but sometimes we are ready to wait 3 months for a bullish wave and yet it takes 6 months for the wave to develop. Next time we are ready to wait 6 months to see prices go up but the wave starts in 12 months and so on. So always be ready to wait 4-5 times longer than what you initially think is the necessary time for the market to change course. Never place a stop-loss in an exchange because that is just bad for the market, the bots will sell just to active your stop.
Stop-loss orders should be avoided at all cost if you are a beginner or a spot trader. Simply buy and hold.
You can use a stop-loss trading short-term and in many different systems but I am talking about reality here, it is not the same.
Never close a trade out of a whim. Either you do it or yo don't. Either you plan or you don't trade.
If you plan you will be successful and you will achieve success. If you don't plan, you can make money but you will be gambling and this gambling will end up in negative results in the long-term. So, if you are not ready to plan/prepare then just wait, the market is not going away. When you are ready, enter with a plan and you will win for sure.
The plan is easy, what to do when the market moves in a certain way. If it rises, will I sell or hold? If it drops, will I sell or hold? If you decide the answer is to hold then, for how long? If you decide the answer is to sell, how much? Just prepare for all scenarios. You don't have to do anything really other than buy low (now) and sell high (later), but doing the mental exercise will save you from stupid mistakes when excitement (or anxiety) grows.
Just practice.
Success is yours.
Thanks a lot for your continued support.
If you enjoy the content, just follow.
Namaste.

FIS - Triple Bottom Formation with Massive Targets |1H- 1W VIEWTECHNICAL ANALYSIS: 🎯
Pattern Structure:
- Price: $0.4667 (-2.24%)
- Timeframe: Weekly (1W)
- Clear triple bottom formation (2022-2024)
- Strong horizontal support: $0.42
Major Price Targets:
TP1: $1.2867 (344.08% potential)
TP2: $2.3459 (501.44% potential)
Technical Insights:
- Triple bottom pattern confirmed with three tests of $0.42 support
- Multiple touches of resistance at $0.90-1.00 zone
- Clear bullish divergence on weekly timeframe
- Moving averages showing potential golden cross setup
THIS 1H CHART VIEW
Key Levels:
▪️ Major Support: $0.42 (Must Hold)
▪️ Immediate Resistance: $0.90
▪️ Breakout Level: $1.00
Risk Management:
- Entry Zone: $0.45-0.48
- Stop Loss: Below $0.40 (Weekly close)
- Risk:Reward ratio
• To TP1: 1:15
• To TP2: 1:25
Timeframe: Weekly
Bias: Strong Bullish on Break
Pattern: Triple Bottom / Accumulation
Note: Such high targets require patience and proper position sizing. This is a long-term setup. Not financial advice.
#FIS #Crypto #TechnicalAnalysis #Binance
Key Observation: Pattern suggests massive accumulation phase since 2022, with potential for significant upside movement on volume confirmation.

FISUSDT: This Key Metric Could Define the Future - Stafi◳◱ On the BINANCE:FISUSDT chart, the Bband Breakout Super-Trend pattern suggests an upcoming trend shift. Traders might observe resistance around 0.4346 | 0.4671 | 0.5427 and support near 0.359 | 0.3159 | 0.2403. Entering trades at 0.5039 could be strategic, aiming for the next resistance level.
◰◲ General Information :
▣ Name: Stafi
▣ Rank: 714
▣ Exchanges: Binance, Huobipro, Gateio, Mexc
▣ Category / Sector: Financial - Derivatives
▣ Overview: None
◰◲ Technical Metrics :
▣ Current Price: 0.5039 ₮
▣ 24H Volume: 1,992,676.241 ₮
▣ 24H Change: 5.463%
▣ Weekly Change: 24.00%%
▣ Monthly Change: 53.27%%
▣ Quarterly Change: 69.61%%
◲◰ Pivot Points :
▣ Resistance Level: 0.4346 | 0.4671 | 0.5427
▣ Support Level: 0.359 | 0.3159 | 0.2403
◱◳ Indicator Recommendations :
▣ Oscillators: BUY
▣ Moving Averages: STRONG_BUY
◰◲ Summary of Technical Indicators : STRONG_BUY
◲◰ Sharpe Ratios :
▣ Last 30 Days: 4.56
▣ Last 90 Days: 2.55
▣ Last Year: 0.73
▣ Last 3 Years: 0.25
◲◰ Volatility Analysis :
▣ Last 30 Days: 1.16
▣ Last 90 Days: 0.88
▣ Last Year: 1.15
▣ Last 3 Years: 1.20
◳◰ Market Sentiment :
▣ News Sentiment: N/A
▣ Twitter Sentiment: N/A
▣ Reddit Sentiment: N/A
▣ In-depth BINANCE:FISUSDT analysis available at TradingView TA Page
▣ Your thoughts matter! What do you think of this analysis? Share your insights in the comments below. Your like, follow, and support are greatly valued and help sustain high-quality content.
◲ Disclaimer : Disclaimer
The content provided is for informational purposes only and does not constitute financial, investment, or trading advice. Always conduct your own research and consult a qualified professional before making any financial decisions. Use of the information is solely at your own risk.
▣ Explore the Power of Charting with TradingView
Unlock a wide range of financial analysis tools, data, and features to elevate your trading experience. Take a tour and see the possibilities. If you decide to upgrade your plan, you can receive up to $30 back. Discover more here - affiliate link -

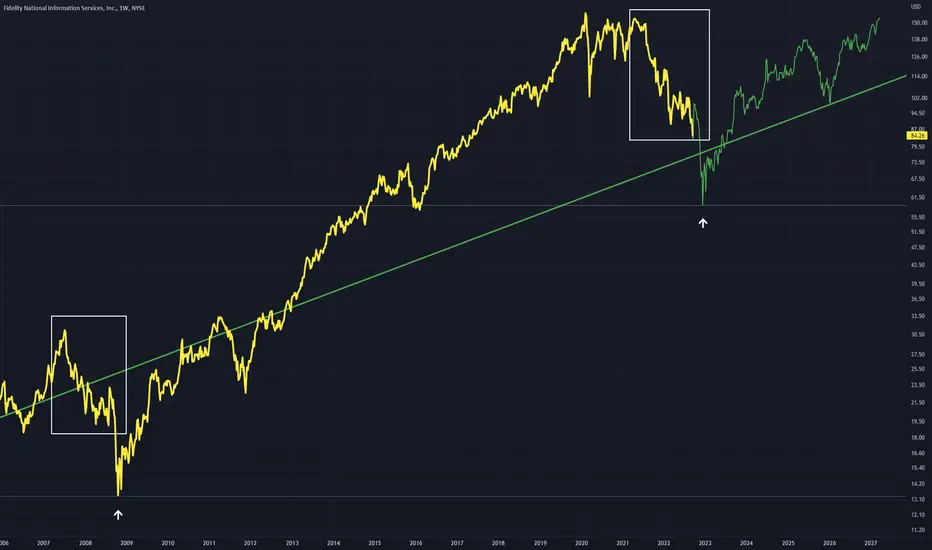
Fidelity National launches climate risk assessment modelFidelity National Information Services Inc., a renowned financial services and outsourcing solutions provider, recently unveiled a new product to address climate risk assessment. As businesses grapple with the increasing uncertainty brought about by global climate change, Fidelity is positioning itself as a key player in the market for analytical tools.
Fidelity National’s newly introduced service, named the Climate Risk Financial Modeler, operates on a Software-as-a-Service (SaaS) subscription basis and is designed to assess risks associated with the physical assets of businesses and non-profit organisations. This tool is tailored for financial professionals seeking innovative methods to manage risk throughout the economic lifecycle.
Exploring potential trading opportunities, let’s review the technical analysis of Fidelity National Information Services Inc. (NYSE: FIS):
On the Daily (D1) timeframe, the stock has established a resistance level at 78.55 USD and support at 73.40 USD. The stock has been in an uptrend since the end of October 2023. If a downtrend begins, a potential downside target might be set at 60.10 USD.
However, if the current uptrend maintains its momentum and the stock price surpasses the resistance at 78.55 USD, there could be an opportunity to buy with a short-term target of 85.15 USD. For a medium-term investment strategy, the stock price might rise to 94.00 USD if the positive momentum continues.
__
Ideas and other content presented on this page should not be considered as guidance for trading or an investment advice. RoboMarkets bears no responsibility for trading results based on trading opinions described in these analytical reviews.
The material presented and the information contained herein is for information purposes only and in no way should be considered as the provision of investment advice for the purposes of Investment Firms Law L. 87(I)/2017 of the Republic of Cyprus or any other form of personal advice or recommendation, which relates to certain types of transactions with certain types of financial instruments.
Risk Warning: CFDs are complex instruments and come with a high risk of losing money rapidly due to leverage. 69.88% of retail investor accounts lose money when trading CFDs with this provider. You should consider whether you understand how CFDs work and whether you can afford to take the high risk of losing your money.

FIS LOOKS BULLISHIt has a boolean structure.
It has a good range for rebuy, which we have marked with green color
The targets are clear on the chart.
Closing a daily candle below the invalidation level will violate the analysis
For risk management, please don't forget stop loss and capital management
When we reach the first target, save some profit and then change the stop to entry
Comment if you have any questions
Thank You

#FIS/USDT#FIS
We have been in a descending triangle since the beginning of 2022.
Supported by stability above Moving Average 100
We have upward momentum and support from a good area.
Current price 0.4157.
The first target 0.5739.
Second target: 0.7350
The third goal 0.9712

FISUSDT.1DBased on the provided market data, the FIS currency is currently trading at $0.51 against the USDT. The Relative Strength Index (RSI) for 4 hours, 1 day, and 7 days is 73.86, 80.24, and 67.06 respectively. The RSI values suggest that the currency is currently in the overbought territory, especially on the 1-day chart, which might suggest a potential downward correction in the near term.
The Moving Average Convergence Divergence (MACD) for 4 hours, 1 day and 7 days is 0.011, 0.0175, and 0.034 respectively. The positive MACD values indicate that the currency is on an upward trend.
The Bollinger Bands (Bb) for 4 hours, 1 day and 7 days are all at 0.51, which is exactly at the current price, indicating a balanced market with equal buying and selling pressure.
The support levels for 4 hours, 1 day, and 7 days are $0.48, $0.45, and $0.38 respectively, while the resistance levels are $0.52, $0.53, and $0.53. The currency is currently just below the first resistance level on all charts, suggesting a strong resistance at this level.
In summary, the FIS currency is currently in an upward trend but is in the overbought territory, suggesting a potential downward correction. However, the MACD indicates continued upward momentum. It's a mixed signal situation where caution is advised. As always, additional factors should be considered and getting professional financial advice is recommended.

Looking extremely bullish on FIS.Thank you as always for watching my video! Please feel free to like, share, and comment on this video!

FIS/USDT Broken Out of Descending Channel? 👀🚀FIS Analysis💎 Paradisers, direct your focus to FISUSDT, as it's currently displaying significant market activity. The asset is hinting at a possible bullish progression from a key support level.
💎 Recently, StaFi encountered resistance at the $0.468 level. If FIS manages to uphold its position at the important support level of $0.36, we may witness a continuation of the bullish trend.
💎This optimistic outlook is further supported by FIS's robust performance above the EMA, suggesting a continued upward trajectory from this support level.
💎 Conversely, if FIS struggles to maintain its footing at the $0.36 support, a strategic shift might be in order. In this scenario, we could prepare for a potential bearish movement from a lower demand zone. A crucial level to monitor is if FIS drops below this support, as it could signify a transition towards a bearish market trend.
💎 Stay alert and strategically prepared, Paradisers. Your ParadiseTeam is here to equip you with essential insights, helping you navigate these market conditions and ensuring that your trading decisions are both informed and strategically sound.

$FIS Bearish Parallel Trend Line BreakNYSE:FIS : The stock has recently experienced a break in its bearish parallel trend line, signaling a reversal from bullish to bearish. Given this technical shift, we are now turning our stance to buying positions in $FIS.

FIS lookin' ready for a sendFIS lookin' ready for a send
Currently at resistance
Forming a flat top triangle
Accumulating just below resistance trendline
Ready for a send towards trendline above

Fis Looks Promising For Another Breakout Seems like getting ready for further continuation
Forming bulish pennant in h4 timeframe incase of breakout expecting another 45 -50% Bullish Move

WtcUsdt Showing Signs Of Massive recovery
Symmetrical Triangle Breakout Has Confirmed Expecting 80 - 90a% Bullish Move
& Wtc Will Test Major Trend line And If Trend line Got Cleared Too Midterm Target Would be 400 - 450%

StaFi (FIS) formed a bullish Gartley for upto 42.50% moveHi dear friends, hope you are well and welcome to the new trade setup of StaFi ( FIS ) coin.
On a daily time frame, FIS has formed a bullish Gartley move
Note: Above idea is for educational purpose only. It is advised to diversify and strictly follow the stop loss, and don't get stuck with trade


FIS USDT TODAYEntry Point Green Box : by part Top zone 40%
Bottom Zone 30%
SL Near Zone 30%
Take profit Zones Are shown in yellow color.

FIS - Similar Downward Structures If these downward periods are comparable FIS is in for a very sharp yet brief drop
From here price will lead to a recovery and maintain this green trend line
Downward structures in white boxes
📈StaFi #FIS $FIS (July-16)Since mid-May until now, the $0.3-0.35 zone has been an accumulation zone and has continuously had flash pumps and has brought a lot of opportunities for us to take profits. Therefore, accumulation of FIS in this zone is a good plan and expect flash pumps in the near future.
However, FIS pumps are usually flash pumps so what we should do is place sell orders to avoid losing profits.
If FIS loses the $0.3 zone, we can still buy it back at $0.2 zone because the buying power here is very strong and there may be a flash pump as strong as May 12.
