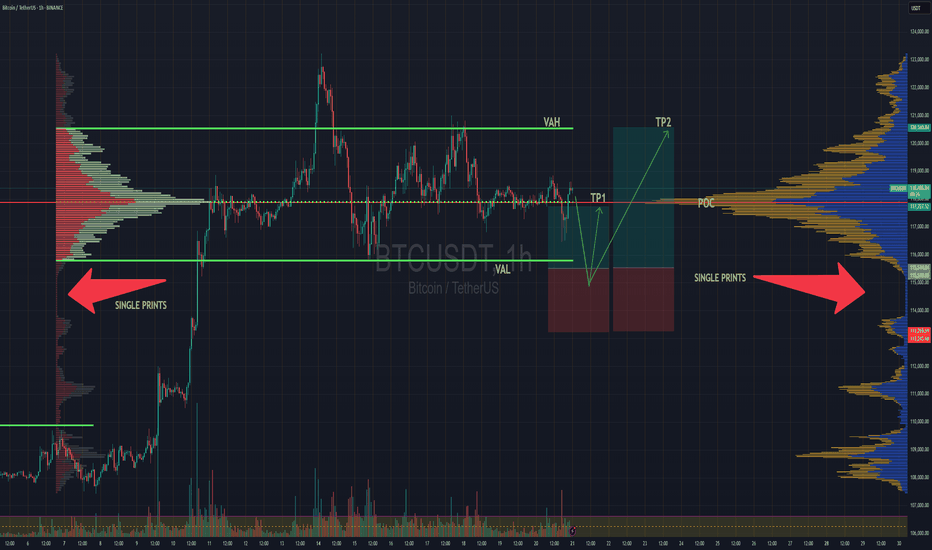
BTC Balanced Volume Profile BTC is now trading in a textbook D-Shape Volume Profile. In english - Buyers & Sellers are happy to transact here and will stay inside the value area & consolidating sideways until further notice.
Consolidation at POC is a signature of this profile, and one of the easiest and least stressful trade setups because now, your mission, should you chose to accept. Is to fade the Highs (VAH) and Lows (VAL) and avoid the middle unless you love donating money to the market.
I'll have buy limit orders waiting right below the VAL where we have the single prints. It doesn't get any easier than this.
Doesn't mean price cant rip through, but this is always the best entry with less risk, especially when the single prints have not been tested yet..
BINANCE:BTCUSD CME:MBT1!
Fixedrangevolumeprofile
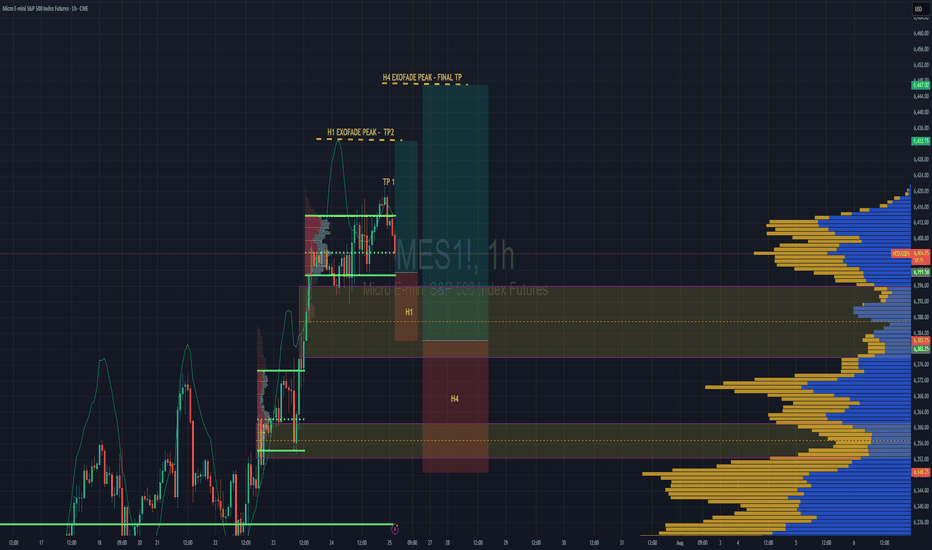
S&P 500 Intraday & Swing Entries H1 entry is close to getting activated for intraday.
If you want a swing trade then wait for H4 entry (you might be waiting a while obviously)
Reason for entries - We have broken out of Balance since July 25th and currently in a trend phase until we establish a new value area, or return to the one we broke out from.
So since Trend and Momentum is UP, then we should find Low Volume Areas to enter in the direction of the trend for a classic pullback entry trade.
Using LuxAlgo SMC Free indicatorSometimes Indicators helps calculates the swing points without any effort especially during live trading.
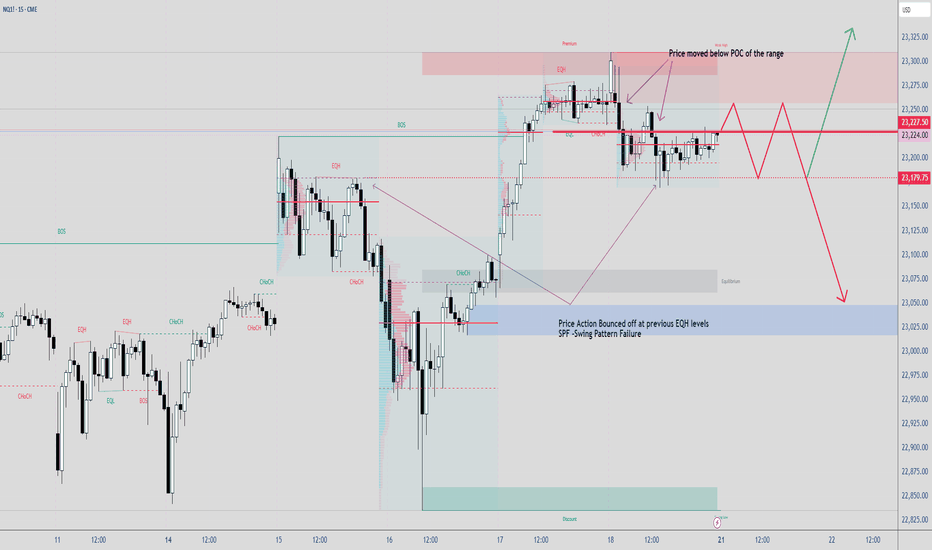
POC is part of a tool called Volume Profile. In this case, Im using select Fixed Range VP to identify short term POC to see where PA can bounced from.
When markets moving sideways or in a Trading Range, PA tends to be choppy.
Nobody knows about the future, if they claimed to know, just run away. Here are some probabilities how PA would do next.
Long & Short Entry Forecast For GoldCooling war tensions seem to be cooling the Gold bullish rally as well.
But we're still in the same range since April 15th and will likely stay in the range until further notice *or the next tweet*
The Sell entry is great now cos we're near the top of the high volume node, so even if we consolidate around that POC this sell entry will still be putting us closest to the top of the node.
Hold your sell and TP at the VAL . We have a very deep low volume area there and its being a point of support since April. So we can place bets with small risk on hoping it holds cos if it doesn't, it wont be pretty. That is still the best place to buy regardless. So manage your risk accordingly
TP 1 for the Buy trade is at the POC , which also happens to be the top of the huge volume node. Totally make sense to take a decent chunk of profit of your position there, then move you stop loss into profit and grab some pop corn. Depending on the news , the best case scenario of for the uptrend is to continue all the way up to TP2 which is at the VAH
Secure the bag :)
Enjoy
Pepe large time frame PoC 1 March 2025Fixed Range Volume Profile from Sunday 3 November 2024 1am. At the moment we're at the VaL (Value Area Low) BUT resistance at the PoC (Point of Control).
Having said that, this is on a 12 hour chart. Momentumm looks weak. Trade cautiously.
Zoom out for all Volume Profiles that I'm using.
By low, sell high is what they say. In this case were at a low.
This idea correlated with the recent ideas:
and:
SUPER BULLISH ON THIS PROJECTIf the previous months value area high holds or does not, there are two ways i'm expecting the price action to play out.
#ONDOFinance #RWA
Calculate Your Risk/Reward so you don't lose more than 1% of your account per trade.
Every day the charts provide new information. You have to adjust or get REKT.
Love it or hate it, hit that thumbs up and share your thoughts below!
This is not financial advice. This is for educational purposes only.
AVAX 17% PUMP OR 5% DUMP INCOMING.If we can flip $34.50 (Monthly Value Area Low) into support, I would expect price to rotate to at minimum the POC (Red Line). the next target would be The value are high 17% away from current price.
If rejected, 5% drop could follow.
#Avalanche
Calculate Your Risk/Reward so you don't lose more than 1% of your account per trade.
Every day the charts provide new information. You have to adjust or get REKT.
Love it or hate it, hit that thumbs up and share your thoughts below!
This is not financial advice. This is for educational purposes only.
7% PUMP OR DUMP INCOMING FOR CHAINLINKCurrently trading at resistance. we need to flip this $24.75 level into support to then aim for a 7% pump to the upside.
If we reject here, I would expect a 7% dump to the value area low.
#Chainlink #Crypto #Oracle
Calculate Your Risk/Reward so you don't lose more than 1% of your account per trade.
Every day the charts provide new information. You have to adjust or get REKT.
Love it or hate it, hit that thumbs up and share your thoughts below!
This is not financial advice. This is for educational purposes only.
SUI 10% PUMP OR 16% DUMP INCOMING#SUI needs to flip last weeks value area low into support $4.18, then I would expect a 10% rise to the value area high.
If we get rejected here, a 16% drop to support is likely.
#Crypto #Blockchain #Altcoin
Calculate Your Risk/Reward so you don't lose more than 1% of your account per trade.
Every day the charts provide new information. You have to adjust or get REKT.
Love it or hate it, hit that thumbs up and share your thoughts below!
This is not financial advice. This is for educational purposes only.
KIRLOSBROS - Cup & Handle patternAll details are given on chart. If you like the analyses please do share it with your friends, like and follow me for more such interesting charts.
Disc - Am not a SEBI registered analyst. Please do your own analyses before taking position. Analysis provided on chart is only for educational purposes and not a trading recommendation.
MANTA 400% Gain IncomingOMXHEX:MANTA - Technical Analysis Request
Three distributions shown. The current range is likely an accumulation before a breakout.
The value are lows shown of the previous ranges will be the most important resistance zones.
From current price 400% possibility to ATH #MantaNetwork
Lows of the range has been swept. Next challenge is to break the trendline and continue upwards.
Calculate Your Risk/Reward so you don't lose more than 1% of your account per trade.
Every day the charts provide new information. You have to adjust or get REKT.
Love it or hate it, hit that thumbs up and share your thoughts below!
This is not financial advice. This is for educational purposes only.
SHORT IDEA in BITCOINHello, fellow traders!
I’m sharing a short idea on BTC. Bitcoin has recently reached over 79,300, and I’m opening a short position with a stop-loss (SL) at 80,200 and a take-profit (TP) at 76,200.
While I agree with the overall bullish trend on BTC, it seems like the price is moving up a bit too quickly. I’m expecting a possible pullback to around 76K, with a further potential drop to the 72-73K range. Based on this, I’ve decided to open a short position.
Looking forward to hearing your thoughts on this trade!
Very Important Update!Price action is currently trapped between two key value areas. Until we reclaim the VAL above, i'm expecting lower prices to come, and the point of control below (yellow line) is the next target. CRYPTOCAP:BTC #BTC
Calculate Your Risk/Reward so you don't lose more than 1% of your account per trade.
Every day the charts provide new information. You have to adjust or get REKT.
Love it or hate it, hit that thumbs up and share your thoughts below!
This is not financial advice. This is for educational purposes only.
Sweet spot to sell USD/JPYHopes of feds cutting rate is getting more credit across the market and we also have Powell about to speak in the morning.
If he further confirms what the rate cuts anticipation, then it's fair to expect a continuation of the USD/JPY dump . At the least we can take some profit at value area low and leave a runner for an expected lower low
30% Rise Incoming#Cardano has held price above the major VAL and weekly level for a few days. I'm expecting higher prices. The POC 30% away is the target.
Calculate Your Risk/Reward so you don't lose more than 1% of your account per trade.
Every day the charts provide new information. You have to adjust or get REKT.
Love it or hate it, hit that thumbs up and share your thoughts below!
This is not financial advice. This is for educational purposes only.
JASMY Key Areas To Look For A GREAT TradeAfter a reclaim of the previous week VAL, there a higher probability price moves up to the daily level $0.0303. That area is where I would look to short and the area I'm interested in longing is $0.0241
Calculate Your Risk/Reward so you don't lose more than 1% of your account per trade.
Every day the charts provide new information. You have to adjust or get REKT.
Love it or hate it, hit that thumbs up and share your thoughts below!
This is not financial advice. This is for educational purposes only.
Litecoin Has A Battle Ahead!! Lets Go LTC!There's always a few ways things can play out but I'm thinking something like this.
Bullish move to the upside breaking through the POC. There's a lot of resistance right above around $75. If Flipped we have another Major level, the Monthly and POC at $83 &$84 after that is flipped I would expect $105 to $$115.
Keep in mind we can dump to $62 first to test the untapped weekly.
Calculate Your Risk/Reward so you don't lose more than 1% of your account per trade.
Every day the charts provide new information. You have to adjust or get REKT.
Love it or hate it, hit that thumbs up and share your thoughts below!
This is not financial advice. This is for educational purposes only.
Volume Profiles Are Important! :)Price respects these value levels. They increase your trade potential exponentially.
Calculate Your Risk/Reward so you don't lose more than 1% of your account per trade.
Every day the charts provide new information. You have to adjust or get REKT.
Love it or hate it, hit that thumbs up and share your thoughts below!
This is not financial advice. This is for educational purposes only.
BONK LOOKS VERY BULLISH AFTER I SAW THIS!Played around with the #FRVP tool and loving it.
The red lines are the POC for the previous months.
You can clearly see where the highest amount of volume has been traded over the past 5 months.
We are now above it! This is very bullish for #BONK as long as we stay above it! #Memecoin
Calculate Your Risk/Reward so you don't lose more than 1% of your account per trade.
Every day the charts provide new information. You have to adjust or get REKT.
Love it or hate it, hit that thumbs up and share your thoughts below!
This is not financial advice. This is for educational purposes only.
40% Increase on the horizonLets keep it simple. We flipped the VAH into support and continue to build value above, next area to test is the VAL above 40% higher. A nice pump is incoming and keep in mind, if the crypto market is bullish so is Robinhood.
Stay focused.
Calculate Your Risk/Reward so you don't lose more than 1% of your account per trade.
Every day the charts provide new information. You have to adjust or get REKT.
Love it or hate it, hit that thumbs up and share your thoughts below!
This is not financial advice. This is for educational purposes only.
RUM Struggling & aims for $6.00If we start closing high time frame candles below $6.80, the target will be $6.00. It left behind a massive FVG & Single print with the buy side imbalance.
Stay focused.
Calculate Your Risk/Reward so you don't lose more than 1% of your account per trade.
Every day the charts provide new information. You have to adjust or get REKT.
Love it or hate it, hit that thumbs up and share your thoughts below!
This is not financial advice. This is for educational purposes only.
XRP 16% PUMP To Next Resistance.XRP has broken out of a downtrend which started in March. We manage to close a weekly and daily candle above the POC.
There's a daily level we have failed to close above, over the past 3 days.
Flip that level into support and I would target $0.62 next 16%
Calculate Your Risk/Reward so you don't lose more than 1% of your account per trade.
Every day the charts provide new information. You have to adjust or get REKT.
Love it or hate it, hit that thumbs up and share your thoughts below!
This is not financial advice. This is for educational purposes only.
THE ONLY TRADES I'M TAKING - KEY LEVELSI went ahead and marked out a few key levels that I am interested in trading in the next 24 hours.
WE CAN ALSO FLIP THE RESISTANCE INTO SUPPORT. If that happens a would be interested in a long on the retest,
Let me know your thoughts below.
Calculate Your Risk/Reward so you don't lose more than 1% of your account per trade.
Every day the charts provide new information. You have to adjust or get REKT.
Love it or hate it, hit that thumbs up and share your thoughts below!
This is not financial advice. This is for educational purposes only.


