💯 AMD not a lot of sell pressure down here. Watch itFor a swing I'll try to get a good entry on AMD. I've been trading it up and down for 2 weeks now. See my ideas. At 108 I said it should get rejected and fall back to support. We are at 103.XX now. I ideally want 99-101 for a long entry but I don't think there's too much selling pressure here anymore.
Watch it above 104.60 for a breakout.
We all see the flag on AMD daily chart:
Follow and like this idea for more insights. Welcome to join my community! Thanks for reading.
FLAG

📈 AMD back @ flag's top trend. Watch for breakout/ rejectionJust a recap of this trade so far:
Posted this @ 108 calling for a bearish rejection.
After it failed to bounce from 101-103, I was certain it'd head over to 95-98, or the bottom TL at most.
When we hit the bottom TL, I called for a buy signal @ 95.
Will tag all these for proof.
Now we are at the top TL, which is the ultimate PT from 95. We hit this in 2 days. +10% in 2 days. That's right.
When you wait for swings to come to you, you will make the most money.
Here's the alert @ 95-96:
We waited a week or two for this perfect bounce. That's the best way to swing.
One way to swing is to buy, buy more, buy more, and buy some more. Another way, is to wait for the right moment and wait for the trade to come to you. If you miss it, you miss it. All good, there's tons of trades on the market.
NASDAQ:AMD NASDAQ:QQQ AMEX:SPY NASDAQ:TSLA NASDAQ:NVDA

Bitcoin - 39k in December! (last chance to buy low)
Bitcoin will hit 39k this year in December 2023, according to my technical analysis and calculations. This new analysis is on the 12h chart and shows very important technical data!
First, we need to consider the major yellow descending trendline. This trendline has been destroyed by the bulls, and we also had a successful retest of it! This is your chance to buy / long BTC at the current low price. Thank me later!
Before BTC hit 39k, we had some resistance on the way up. Of course, we are not going to go to 39k in a straight line. The first resistance is the 0.618 FIB of the previous wave, which is at 29167 USDT. We also have a POC of the previous structure near this point, so it's a big deal. There is no next resistance until 31804, which is the major previous swing low.
I don't know how about you, but I am prepared for the bull market that is coming in the next few weeks until January! Expect January to be a bearish month.
From the Elliott Wave perspective, I see this uptrend from 24900 to 28500 as a strong nest (1-2-1-2) or an expanding leading diagonal wedge (1-2-3-4-5). Both of them are bullish patterns and support the start of the bull market!
Let me know in the comment section (right now) what you think about BTC and have you bought it.
Thank you, and for more ideas, hit "Like" and "Follow"!
This analysis is not a trade setup; there is no stop-loss, entry point, profit target, expected duration of the trade, risk-to-reward ratio, or timing. I share my trades transparently and privately.

BTC Liquidity: Will This Time's Trend Reversal Be Real?The Liquidity Lure:
It's not uncommon for price action to accumulate liquidity near significant support levels or trendlines. Traders often place their buy orders just above these lines, hoping for a quick bounce when prices approach. 🎣
A Second Chance at Reversal:
Now, let's examine the intriguing aspect of this situation. We've seen liquidity left behind in the past, only for the market to disappoint and continue the downtrend. However, this time could be different. 🔄
The Case for Reversal:
Market Sentiment: Cryptocurrency markets are notably influenced by market sentiment. If the sentiment shifts, it can trigger a genuine change in direction. 📈📉
Fundamentals: Keep an eye on fundamental factors that could drive demand for cryptocurrencies. News of adoption, institutional involvement, or regulatory clarity can play a pivotal role. 🏦💼
Technical Indicators: Look for confirmation from technical indicators such as higher lows, bullish candlestick patterns, or increased trading volume. 📊📈
Trading Strategy:
Caution: While the signs may be encouraging, remain cautious. Wait for confirmation of the trend reversal before committing significant capital. 🚦
Risk Management: Always use risk management techniques, like setting stop-loss orders, to protect your investments. ⚖️
Diversification: Consider diversifying your portfolio to spread risk across different assets. 🌐
Conclusion:
The cryptocurrency market is known for its volatility and unpredictability. While the presence of liquidity below a downtrend line offers hope, it doesn't guarantee a trend reversal. It's crucial to combine technical analysis, market sentiment, and sound risk management in your trading strategy. And remember, even in the world of crypto, patience can often be the key to success. 🗝️
Will this time be different? Only time will tell, but one thing's for sure – it's a market that continually keeps us on our toes. 🌟
Trade with our closed community !
❗️Get my 3 crypto trading indicators for FREE! Link below🔑

Sell XAUUSD Bearish FlagSell XAUUSD Bearish Flag
Sell XAU/USD @ 1925
Tp - 1909
SL - 1933
Use 2 % Risk only per Trade, overtrading leads to loss only..✔️✔️
its good chance to sell today,
Thank you

Sell EURUSD Bearish FlagSell EURUSD Bearish Flag
EURUSD - M30 Chart -Bearish Flag Formation
Its good chance to sell today.
Thank you

$AMD falling wedge to end today's action. Good signGood sign on NASDAQ:AMD with that falling wedge on the 15 min.
When a stock's been hammered for no reason at all except market volatility, we usually try to look for bullish reversals or bullish signs to enter on a swing.
Closing in a falling wedge is good. Doesn't ALWAYS pay off, but if you are swinging it likely means 4-12 weeks anyway, so it's relatively safe here.
Also looking on the Daily chart, it's right on the bottom of the flag trendline:
Follow for more insights.

USDJPY Bullish USDJPY has been Bullish for quite some time and still we can observe a Bullish Continuation Pattern with no Divergences

Sell GBPJPY Bearish PennantSell GBPJPY Bearish Pennant
GBP/JPY - M30 Chart - Price breaks the bearish pennant pattern now,
Its good chance to sell now.
Thank you

SILVER Will Go Down! Sell!
Hello,Traders!
SILVER broke out of
The bearish flag pattern
While trading in a local
Downtrend so I will be
Expecting bearish continuation
Sell!
Like, comment and subscribe to help us grow!
Check out other forecasts below too!

✅SILVER BEARISH FLAG BREAKOUT|SHORT🔥
✅SILVER is now breaking
Out of the bearish flag
Pattern so IF the breakout
Is confirmed then we will
See a further move down
SHORT🔥
✅Like and subscribe to never miss a new idea!✅

GBPNZD ShortGN, has formed a Bearish Flag continuation pattern and has retraced from the 0.5 Fib level making a LH and will most likely make a new LL.

NZDJPY LONGNZDJPY has formed a Bullish Continuation pattern and has retracted at the 0.382 level , making a HL and will most likely make a HH from here on.

📈 AUDJPY: Watch This Textbook Bullish Flag Breakout!Full-time trader. Follow for more free tips & like/ share this idea. Thanks in advance!
Bullish flags typically typically show some profit-taking after a strong uptrend without any violent selloffs. The pole needs to have an impulsive and violent move upwards. The breakout from the flag should be followed by a volume spike. This is exactly what we have on the FX:AUDJPY
Watch how this plays out in the next few weeks. Learn from it, then do it again on another pair.
Possible max target at 101. Of course, like with any currency or stock, expect bumps and dips along the way. Look for higher lows which would void the bullish flag.
First resistance break (see chart) should cause an impulsive move upwards, as many traders will spot the pattern and FOMO into it.
The lower timeframe shows a nice trend forming. This strong trend can help break resistance faster than expected:
If you don't have experience trading this pattern, it's better to sit this one out and watch it unfold and take notes.
If you trade stocks, you'll love our community. Link below!

Learn To Trade Breakout/Flags More Efficiently - Part IIn my first tutorial, I tried to show how price channels can be used to identify and validate strong trade setups. Additionally, I attempted to show you how to identify better trade setups from what I consider invalid trade setups.
Understanding and maintaining at least a 2:1 Reward-to-risk factor for any trade you consider taking is essential. Secondly, it is essential to understand and use proper allocation levels for trades.
The simple way to understand allocation levels is to focus on the RISK amount. If your trade risks $5 per share and you can't afford to risk $500 on this trade, then you should NOT attempt to trade 100 shares of this stock.
Set your risk level based on how much you intend to risk for the trade - nothing more.
If you can only risk $250, then you would only trade 50 shares.
If you can only risk $125, then you would only trade 25 shares.
Learning to find and identify proper trade setups on Daily and Weekly charts is critical for success in the long run. I firmly believe price tells us everything we need to know about a chart, and indicators reflect price.
As you continue to learn some of the techniques I use in various price chart setups, I hope you can refine your techniques to become better traders.
I will likely create a PART II and PART III version of these types of advanced trade setups.
Hope you enjoy.

🔥 AMD filled gap to bottom of flag. Watch for bounce + breakoutAMD going to be explosive here if it bounces & confirms the flag.
Watch it close.
Always plan for dips, never add full position. NFA. Follow for more insights.
I called it out to drop from top of TL @ 108. See what happened.

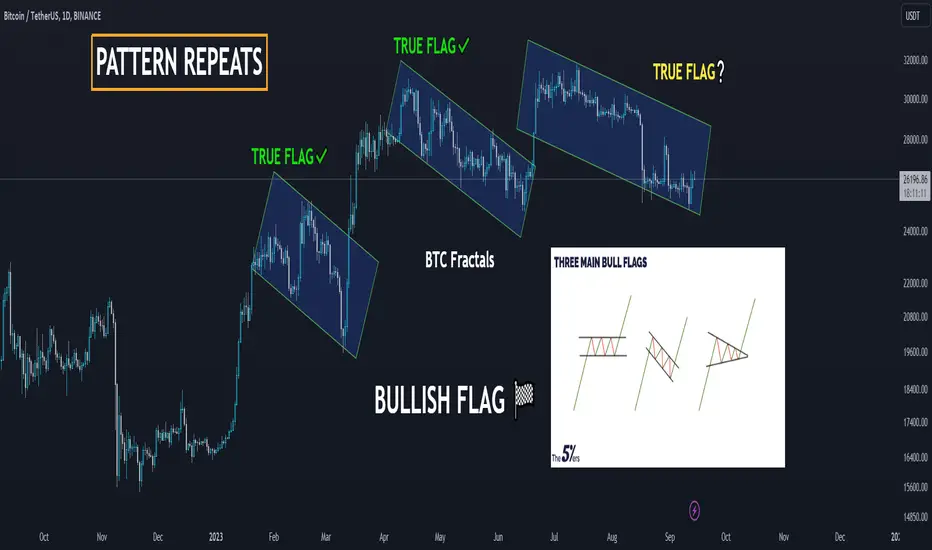
🔄 Repeating Patterns in Bitcoin📊 Familiar Patterns: If you've been following the crypto markets for a while, you've likely noticed that Bitcoin often moves in repetitive patterns. One such pattern that's caught the attention of many traders is the bullish flag or pennant formation.
🚩 The Bullish Flag: The bullish flag is a technical analysis pattern characterized by a sharp, upward price movement (the flagpole) followed by a consolidation period (the flag) before another potential upward surge. It's a pattern that's been seen multiple times in Bitcoin's price history.
📜 A Historical Glimpse: Bitcoin has a knack for revisiting patterns from its past. In the world of technical analysis, the idea that history repeats itself isn't uncommon. So, when we see patterns like bullish flags emerging once more, it piques the interest of traders and investors.
🚀 Potential Implications: If Bitcoin is indeed following a pattern reminiscent of its previous bullish runs, it could suggest the possibility of another significant price rally in the near future. However, it's crucial to remember that patterns are not guarantees, and market conditions can change.
🔍 Keeping a Watchful Eye: Traders and investors are keeping a close watch on these patterns, using them as one of many tools for decision-making. It's a reminder of the importance of comprehensive analysis and staying adaptable in the ever-evolving world of crypto.
💡 The Takeaway: While patterns can provide valuable insights, they should be used in conjunction with other forms of analysis and information. Bitcoin's price movements are influenced by a multitude of factors, and history, while informative, is just one piece of the puzzle.
In the world of crypto, expect the unexpected, but always be prepared. Keep your strategies flexible, stay informed, and embrace the excitement of charting the uncharted!
❗See related ideas below❗
Like + Share this post, and don't forget to share your thoughts in the comments. Your perspective fuels the crypto conversation! 💚🚀💚
Bearish and Bullish Flag Chart PatternsFlag Pattern:
A flag is a chart pattern formed during a counter-trend move after a sharp price movement.
Why is it called Flag?
It is named because of the way it reminds the viewer of a flag on a flagpole.
What does the Flag Pattern represent?
It signifies trend reversals or breakouts after a period of consolidation.
The five main characteristics of a Flag Pattern are:
1. The preceding trend
2. The consolidation channel
3. The volume pattern
4. A breakout
5. A confirmation occurs when the price moves in the same direction as the breakout.
How to identify the Flag Pattern:
The most important part of the flag pattern is to identify a strong trend (in either direction, as the flag may be inverted, triggering a bearish move!). Take a look at the higher time frames when you find a flag pole to ensure the price is not simply ranging. It could be meeting a large area of resistance!
Bullish Flag Pattern:
When the prices are in an uptrend, a bullish flag pattern shows a slow consolidation lower after an aggressive uptrend. This indicates that there is more buying pressure moving the prices up than down and indicates that the momentum will continue in an uptrend.
Traders wait for the price to break above the resistance of the consolidation after this pattern is formed to enter a long position.
The breakout indicates that the prior uptrend will continue.
Example of a Bullish Flag Pattern:
Bearish Flag Pattern:
When the prices are in a downtrend, a bearish flag pattern shows a slow consolidation higher after an aggressive downtrend. This indicates that there is more selling pressure moving the prices down than up and indicates that the momentum will continue in a downtrend.
Traders wait for the price to break below the support of the consolidation after this pattern is formed to enter a short position.
Example of a Bearish Flag Pattern:
Conclusion:
A flag pattern is a type of chart continuation pattern that shows candlesticks contained in a small parallelogram. When the prices are in an uptrend, a bullish pattern shows a slow consolidation lower after an aggressive uptrend. When the prices are in a downtrend, a bearish pattern shows a slow consolidation higher after an aggressive downtrend. It is formed when there is an increase in demand or supply that causes the prices to move up or down.
May you all be PROFITABLE,

$XLM to 32¢ CRYPTOCAP:XLM Presenting a pretty Stellar Setup
CUP N' HANDLE
FLAG/PENNANT
GODD FIBONACCI CONFLUENCE

✅USD_CAD NEXT MOVE|SHORT🔥
✅USD_CAD broke out of
The flag pattern so we are
Locally bearish biased and
A move down is to be expected
SHORT🔥
✅Like and subscribe to never miss a new idea!✅

AUD-USD Bearish Flag! Sell!
Hello,Traders!
AUD-USD is trading in a
Downtrend and the pair has
Formed a bearish flag pattern
So I think that IF we see a
Bearish breakout then the
Pair will go further down
Sell!
Like, comment and subscribe to help us grow!
Check out other forecasts below too!

Capitalizing on Bearish Breakout: Ideal Selling Opportunity 📉🐻We've got an enticing EUR/USD setup on the 1-hour timeframe that deserves your attention. Here's the lowdown:
📌 Technical Analysis Highlights 📌
📉 Bearish Breakout: After a period of range-bound trading (or a bearish flag, depending on your perspective), the price has decisively broken below a key support level, which has now flipped into a formidable resistance. This signals that bulls have been trapped, allowing the bears to regain control. The trend remains bearish
📈 Price Action Insight: With the balance tipping in favor of bears, I anticipate an escalation in bearish momentum, potentially leading to a sharp price drop. This presents an optimal entry opportunity for selling.
🎯 Trade Strategy 🎯
Given these compelling technical signals, it's time to consider a short position on EUR/USD. Look to enter the market with confidence.
📉 Take Profit Targets 📉
1️⃣ First Target: 1.06650
2️⃣ Second Target: 1.06250
3️⃣ Ultimate Target: 1.05900
Feel free to share your toughts in the comments section, follow me for updates and don't forget to press the like button if this insight was helpful 🌊🚀

NZD-CAD Will Keep Falling! Sell!
Hello,Traders!
NZD-CAD is trading in a
Downtrend and the pair
Broke out of the bearish
Flag pattern so I am bearish
Biased and I think that we
Will see a further move down
Sell!
Like, comment and subscribe to help us grow!
Check out other forecasts below too!
