XRP Bull Flag 35% MoveXRP showing a very nice Bull Flag on the Daily Timeframe.
Upside Potential. Chance to Rally.
FLAG

EURGBP Impulse Correction ContinuationWelcome back! Let me know your thoughts in the comments!
**EURGBP - Listen to video!
We recommend that you keep this pair on your watchlist and enter when the entry criteria of your strategy is met.
Please support this idea with a LIKE and COMMENT if you find it useful and Click "Follow" on our profile if you'd like these trade ideas delivered straight to your email in the future.
Thanks for your continued support!
Brian & Kenya Horton, BK Forex Academy

EURCAD Potential retrace and upside Welcome back! Let me know your thoughts in the comments!
**EURCAD - Listen to video!
We recommend that you keep this pair on your watchlist and enter when the entry criteria of your strategy is met.
Please support this idea with a LIKE and COMMENT if you find it useful and Click "Follow" on our profile if you'd like these trade ideas delivered straight to your email in the future.
Thanks for your continued support!
Brian & Kenya Horton, BK Forex Academy

waiting for a buy signalOK, we are here seated waiting for the bottom, and the world is not for a bullish sign, but it's good for a good bounce, so, let see.
Bearish Flag pattern in the Tata Power The bearish Flag pattern found in Tata Power waiting for break down
Trade with proper stoploss
Target 1 and 2 are given in chart analysis

Bearish Flag pattern in tata power The bearish flag pattern found in tata power waiting for break down....
Trade with proper stoploss
Target 1 and 2 are given as per analysis

Nas100Nas100
Bullish Flag made on H4
Long from 11560-11500
If the flag pattern breaks out
it can go till 12800 -13000
share your views in comments cheers

XMR in an Accumulation Zone(Flag Formation)Important Fibonacci Levels:
-100
-117
-130
-138
-146
-157
-175

Bearish Flag, maybe?Here I can see a bearish flag in the making. Very important is the reaction in the afternoon after the FED meeting which might break the flag early.

ADA Getting Squeezed. ADA is in an accumulation zone(triangle formation) it will pump soon. Based on the momentum, it will go down, but the market is bearish, so we are going to see.
Important Fibonacci Levels:
-0,400
-0,600
-0,720
-0,820
-0,920
-1,050
-1,230

USD/CAD has price correction.Hello dear friends;
In short, I want to say that we are in a weak upward trend, that currently, the price can fall to the specified range and then move up again.
Cordial Reguards;
ALI SADEGHI.

EURJPY Potential breakout and bullish continuationWelcome back! Let me know your thoughts in the comments!
**EURJPY - Listen to video!
We recommend that you keep this pair on your watchlist and enter when the entry criteria of your strategy is met.
Please support this idea with a LIKE and COMMENT if you find it useful and Click "Follow" on our profile if you'd like these trade ideas delivered straight to your email in the future.
Thanks for your continued support!
Brian & Kenya Horton, BK Forex Academy

✅DXY WAIT FOR THE BREAKOUT|SHORT🔥
✅DXY is currently forming
A bearish flag pattern
While trading in a local uptrend
So I am expecting the index
To make a bearish breakout
And go down to retest the level below
SHORT🔥
✅Like and subscribe to never miss a new idea!✅

Trading opportunity for BTCUSDT Bitcoin- Bullish Flag PatternBased on technical factors there is a Long position in :
📊 BTCUSDT Bitcoin
🔵 Long Now 19900.00
🧯 Stop loss 18900.00
🏹 Target 22500.00
💸Capital : 1%
We hope it is profitable for you ❤️
Please support our activity with your likes👍 and comments📝

Flag pattern ANThis looks like the inverted flag pattern. I'll be sure to look for sells also because major demand zone is down below (weekly and monthly demand).

USDCHF in a Bull Flag formation.USDCHF - Intraday - We look to Buy a break of 0.9635 (stop at 0.9609)
Price action is forming a bullish flag which has a bias to break to the upside.
Short term momentum is bullish.
The bias is to break to the upside.
A break of yesterdays high would confirm bullish momentum.
Our profit targets will be 0.9696 and 0.9706
Resistance: 0.9630 / 0.9650 / 0.9670
Support: 0.9600 / 0.9580 / 0.9560

3800% growth for the #FET...Hello guys...
as you can see on chart, #fetusdt formed a sloping double top and target of this pattern is as high as height of head that mean price should touch $0.0315
on the other hand, on $0.03 area is on QML and lq bar that make this area super strength for starting bullish trend until $1.15.
it is excellent position
entry:0.0315
target: 1.15
always do your own research.
If you have any questions, you can write it in comments below, and I will answer them.
And please don't forget to support this idea with your like and comment.

✅EUR_CAD WAIT FOR BREAKOUT|SHORT🔥
✅EUR_CAD is going down now
And the pair has formed
A bearish wedge pattern
Which makes me bearish biased
And after the breakout
I believe we will see bearish continuation
SHORT🔥
✅Like and subscribe to never miss a new idea!✅

$SOND extremely bullish setup. PT's are labelled based on chart patterns.
- MMU (measured move up/ ABC)
- Bull flag breakout imminent and the PT breaks the neckline of the inverse head and shoulders.
- A break of the neckline of the inverse H&S gives us the PT based on Thomas Bulkowski's statistical work.
It is also important to note that the MACD crossed to the upside on the daily and the RSI is still not oversold. No bearish divergences in the momentum indicators. THIS IS EXTREMELY BULLISH.

ETH... short and long positionhello guys
eth had formed a QM pattern at daily time frame and in upper time frame (weekly) showed as an engulfing candle so it so perfect for short position, on the other hand, this QM pattern is on flip area and flag on it, but if price break up this area (fl at flip) that i showed as a gray zone, make this crypto currency so bullish and i will update this analysis for long position.
always do your own research.
If you have any questions, you can write it in comments below, and I will answer them.
And please don't forget to support this idea with your like and comment.

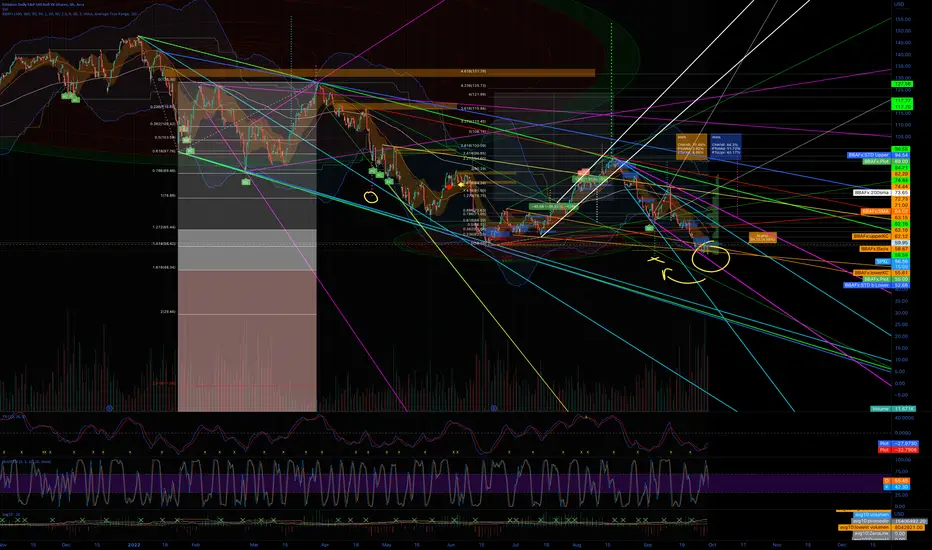
BTCUSDT Short term and Long term UPDATEHey everyone, I recorded a video quick video so I wouldn't have to type a million words. I told you previously that we were waiting for a bear market rally, and we got it. Everything else is in the video. I will be back in October when my studio is set up at my new my place. Thanks again!

EUR-CAD Bearish Flag! Sell!
Hello,Traders!
EUR-CAD is going down now
After the retest of the horizontal resistance
And the pair has formed a bearish flag pattern
So IF we see a bearish breakout
Then a further move down is to be expected
Sell!
Like, comment and subscribe to boost your trading!
See other ideas below too!

TAN Solar Etf Breakout readyTAN Solar Etf Breakout ready. Since market is better perhaps we will see a nice breakout. Solar is Leading market group.
