BHEL WEEKLY BREAKOUT & AT RETEST LEVEL The price breaks the trendline which is acting as strong resistance for the price and also restested the trendline breakout level and now start moves for the upside levels. Price also formed flag and pole pattern in daily timeframe and also given breakout.
#BHEL
👉Trendline Breakout & Retest in Weekly TF
👉Stock in Uptrend & Bullish Pattern
👉Flag & Pole BO on Daily TF
👉Looking good for short Term Swing
👉PSE Stocks in focus
👉Add To Your Watchlist✅
Flagformation


gold trade ideaDXY seems to be consolidating and the correlating pairs including XAUDUSD are showing some bullish sentiments.
XAUDUSD completing a bullish flag targeting 2015.00.

45% Vs 57%Yes, we are in the middle of something, let me explain.
we have a well formed rising wedge that is a bearish pattern, inside of an giant bull flag in theory we should se that pattern ending but that pattern is inside of 3 symmetrical triangles, one confirmes another 2 close to be confirmed, the symmetrical triangle is a reversal confirmation, so we should see a continuation for the uptrend.
Green arrow point to the symmetrical triangles
Blue arrow point to the giant bull flag
Orange point to the wising wedge
If for some reason the rising wedge was the winner the next week, could take us 45% down from here.
But if the symmetrical is the right pattern and we are watching a trend change, we should see to complete the bull flag with more than 50%.
I think that because the giant bull flag is too old, the symmetrical triangles are dominant and we should se the up trend continuation.

$GNLX New Momentum - Big initial move right of out the gate
- ~1 month consolidation
- Confluence of MAs
- New Momentum
- High ADR
- Pharma

DXY in a range as GBPUSD completing a bullish flag.FX:GBPUSD moving up in a channel, hoping to break 1.24514 and form a flag I will be buying above 1.24514 targeting 1.2550

ADAUSDT BULLISH Pattern I saw a flag and pole pattern in ADAUSDT
PRICE WILL BE BULLISH
1h chatr time frame
Personal Prediction: BULLISH
Entry: do self analysis
Target: 0.4200

EURUSD - Daily Analysis Bearish Pole Flag PatternEURUSD in a Bearish Trend and now it's foam a Bearish Flag Pattern. For Trade plan wait for to break the neckline. If it's break then open a Sell Trade.

CRM - approaching neckline @ 195CRM had been basing for about 10 month now (since last May), the first sign that the worst could be over was when it broke above the 200 day movving average on 27 Jan, then a retest of this MA a month later on 27 Feb which validated the 200 day MA as the new "support".
Several days later on 2nd Mar, it gapped up strongly on earnings beat, stopping right at a significant neckline around 195. Then proceeded to pullback and almost closing the entire gap in the coming days. While the stock has been staging a recovery since hitting the low in Dec last year, it also experienced steep pullbacks on the way up. Buying the dips would certainly had been a better option in this chopping conditions.
Despite the volatility, what is clear however is that the stock is still on it's way to recovery, forming higher hi's (HH) and higher lo's (HL), with RSI staying at 50 or higher since early Jan, and a Golden Cross since 10 Mar.
It could attempt to break the neckline @ 195 again in the coming days and if and when it is finally able to break and stay above this level, then we could (hopefully) see more a more steady rise with pullbacks that are less steep (ie within 50% fib retracement of each mini up swing). And the next target could be around 220.
We can "predict" price targets but it is important to manage our risk with trailing stop losses and see what the market gives us.
Disclaimer: Just my 2 cents and not a trade advice. Kindly do your own due diligence and trade according to your own risk tolerance and don't forget that money management is important! Take care and Good Luck!

SPX facing resistance to keep falling - a new doubt levelI'm updating my last reading on SPX about the beginning of a bearish leg. I understand that that previous signal has worked, and market failed to support the 200-SMA, although we're now facing a new test.
My outlook remains the same, that the main trend is bearish, but I also believe that the path to the low may come along with counter-trend movements and congestions.
On March 13th, prices reached the region of the last bottom and a massive buying volume showed up sustaining the market upper from that level. This drove us to where we are now, pulling back to the 200-SMA, and this famous average is now giving us a new make or break setup.
The next days movements will probably drive the direction of the market for the next few weeks, and that could be either bearish or bullish.
I would prefer if this was a bearish movement, along with the trend, that tends to make a more straighforward path and with a longer target (I estimate a gain around 10 to 15%, counting from last week close). Any set of black candles would point this way.
On the other hand, some white candles, specially with a good volume, would point to the bullish or congestion case. But I believe that it would be a counter trend movement, barely reaching the previous top region (with a posssible return of 6% to 9%) - of course I can be wrong, but then we re-evalute the scenario if the top if reached.
I don't know if I will trade the bull case, because I think this would be a more short-term situation. But for the bear case, I'm keeping open my bearish position that targets the next few months.

AllCargo Logistics - Bullish Flag FormationAllCargo Logistics - Bullish Flag Formation - Long Term view
Entry - 330 - 350
Target - 561.15
Stop loss - 300

USDCAD I It will fall from resistanceWelcome back! Let me know your thoughts in the comments!
** USDCAD Analysis - Listen to video!
We recommend that you keep this pair on your watchlist and enter when the entry criteria of your strategy is met.
Please support this idea with a LIKE and COMMENT if you find it useful and Click "Follow" on our profile if you'd like these trade ideas delivered straight to your email in the future.
Thanks for your continued support!

XAUUSD Like everybody knows Gold has been on the fall lately, responding to dollar strengh
A bearish flag is forming on the lower timeframes, we can spot it with the H2 candlesticks, and it's very well detailled on M15-M30.
I've put two alerts, one on the green trendline, another on the red,
If price breaks higher, then I'll look for entries around the 1900 level after the retracement is done, a bearish pin bar, a bearish engulfing, or an inside bar in the zone
If price breaks lower, then i'll look for a break that involves a M15-M30 closed candle on the other side of the red trendine, and place the stop loss above the structure
Cheers and trade safe!!!

Procter & Gamble Company – PG• Triple top formation in the first weeks of the year
• Followed by a correction to the price target of USD 143.60, which was the appr. high of the flag
• New flag formation with a price target of USD 124.94
• It looks like the stock will test the last October lows

Titan- Flag Pattern in the making Titan seem to be making flag pattern. Hopefully it will touch 10% plus in the coming week.

GOLD BEAR FLAGGOLD CUP & HANDLE on the weekly tells the overall story. Gold is getting ready to make a bottom, Before new highs
Right now we see a BEAR FLAG that was formed, with a BROKEN NECKLINE. This is a nice continuation and frames our overall trajectory for GOLD very nicely.
Cup and Handle on the weekly is showing that a retest of a bottom will happen before a new top is created and the pattern we see here is a medium term sell signal into said bottom.

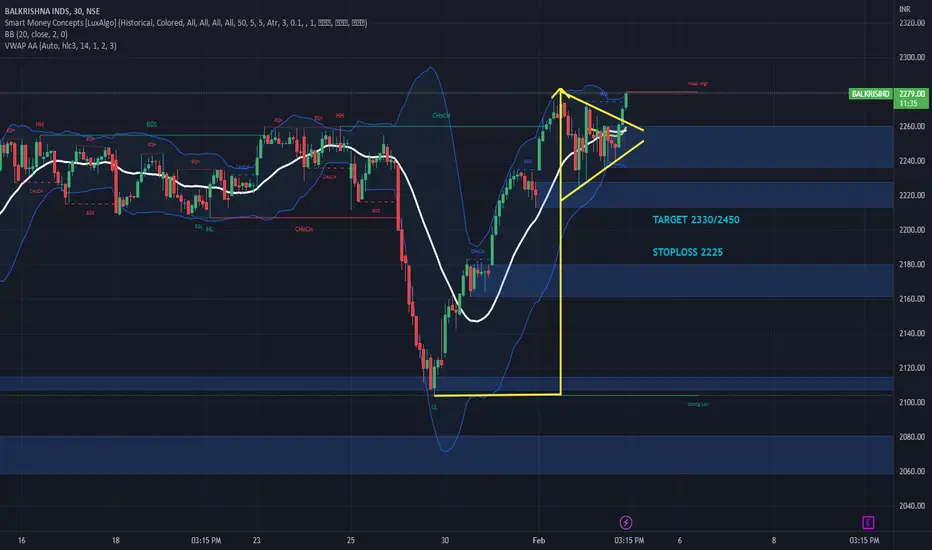
BalkrishnaBalkrishna made flag pattern & comfortably trading above breakout level.
Not to be missed breakout.
Risk:Rewar Ratio in favour of bulls.
Could be bought with mentioned stoploss & targets.
🔔KATUSDT🔔After a sharp growth and the formation of a flag pattern , the price is now ready for another phase of its upward movement...
WOMAN , LIFE , FREEDOM

🔔HNTUSDT🔔After a sharp growth and the breaking of the ascending channel, it has formed a flag pattern and is preparing for the next move...
WOMAN , LIFE , FREEDOM

AUDJPY - 1Hr Analysis and Projection updateHey guys,
Just an update on AJ. These are a couple of the options i have drawn out as my biases. I am completely aware that price can continue bearish, and that price can also not retrace at all and continue bullish.
If I am looking to enter, I need price to retrace to either of those key levels inside the FIB and then give me confirmations. This retracement will put me in the best overall position to buy with minimal risk.
It just makes more sense for price to go long to me for a few reasons:
1. Its trending in a bullish channel - Traders are caught that these channels play out perfectly every time and to treat them the same and enter at a break and retest or whatever they are taught. This thing looks too pretty and too perfect - and i always say whenever something looks too good to be true it usually is. So, it's just accumulating liquidity at this point and its getting ready to remove everyone from the market.
2. Because of this channel - Everyone and their dog is selling from the top of it causing the overall sentiment for AJ to be bearish. Its 69% bearish at this point, so it makes so much more sense for the market to target all of these sellers first. If it still wants to drop after that and continue bearish it can - but it's definitely not going anywhere bearish until it raids liquidity and manipulates price.
3. The Daily and weekly - Like i said before look - like a perfect 'Head and shoulders' - which means its luring all the new pattern traders in and accumulating them over time. Again - If you were ever taught that a H&S means only reversals and sells, I suggest you get a lobotomy and forget that info ASAP as they are one of the biggest liquidity traps in the market. Well, if you know how to trade them, they aren't. But because of the way they are taught - they end up blowing everyone's accounts. Including mine for my first year of trading. 🙃
These are just my personal biases, and I am aware that price can do many more things - But this is the only thing that i am looking for in terms of me entering. If it does something different i will adjust my perspective and my analysis accordingly. If you are bearish or have a completely different perspective to me and your charts look totally different, do not second guess yourself because I could be the one that is wrong, and price may play out the way you want. Be confident in your analysis and your skill and don't second guess yourself.
It took me 3 years to be able to finally come on here and share my ideas because I was so easily influenced, and I would always look at other people's charts and think i was the one who was wrong and i would think i wasn't good enough to be a trader - Only to enter the other persons trade and copy their analysis and it would hit SL and price would go the way I had originally drawn out!! So just always trust in your analysis and be confident in yourself always and that is honestly a large part of this journey.

Bears should be crying with this chartAs you can see, there are two massive, impressive tsunami flags there pointing over $400 USD, the stock could be super explosive in the next sessions, at the end, you can get 200% whit this.

💡 Don't miss the great Buy opportunity in USDJPYHello my dears
It seems that we are witnessing the formation of a Flag pattern in the USDJPY chart. I think the possibility that the price will break above the Flag of the chart is very high. What do you think?
If you liked my analysis, please support me with comments and likes.

🚩 Bull Flags VS Bear Flags🚩What is a Flag Pattern?
A flag pattern is a commonly observed technical analysis pattern used to identify potential continuation of current market trends.
It is characterized by a period of consolidation, where the market experiences a relatively small range of movement, following a significant price movement.
This pattern is formed as the market returns to a state of equilibrium, following a large move. The flag pattern is considered a continuation pattern,
as it often indicates that the market will continue to move in the same direction as the preceding trend, once the flag breaks out.
This breakout typically occurs when the price of the security breaches the upper or lower boundary of the flag, and it is usually accompanied by an increase in trading volume.
📈📉The difference between a Bull flag VS Bear flag
The difference between a bullish and a bearish flag is in the direction of the price movement. With the bullish flag, the idea is to participate in a strong uptrend. Meanwhile, with the bearish flag pattern, the idea is to trade short in the direction of the prevailing downtrend.
- Downtrend vs uptrend: Bull flag and bear flag are both continuation patterns that form when the price of a stock or asset pulls back from the predominant trend in a parallel channel.
- Bull flag: A bull flag is a sharp, strong volume rally of an asset or stock that portrays a positive development.
- Bear flag: A bear flag is a sharp volume decline on a negative development.
- Bull flag and bear flag share the same traits: Traits of Flag Patterns include support and resistant levels, flag, flag pole, breakout points and price projections.
📍Entry opportunities
The most important component of any flag pattern trade is the entry. It’s generally advisable to wait for a candle to close beyond the breakout point before creating any orders to avoid being burned by a false signal. In the example above, the entries are made on a High risk - High reward mindset with stop loss bellow the flag pattern. Most traders will enter a flag pattern trade on the day after the price has broken beyond the trend line. The length of the flag pole is typically used to calculate the profit target. Even when the formation of a flag pattern is obvious, there is no guarantee that the price will move in the expected direction. As with most technical analysis, you will get the best results from flag patterns by applying them to longer-term charts as you will have more time to consider your strategy and analyze the price action.
👤 @AlgoBuddy
📅 Daily Ideas about market update, psychology & indicators
❤️ If you appreciate our work , Please like, comment and follow ❤️
