EURJPY Potential breakout and bullish continuationWelcome back! Let me know your thoughts in the comments!
**EURJPY - Listen to video!
We recommend that you keep this pair on your watchlist and enter when the entry criteria of your strategy is met.
Please support this idea with a LIKE and COMMENT if you find it useful and Click "Follow" on our profile if you'd like these trade ideas delivered straight to your email in the future.
Thanks for your continued support!
Brian & Kenya Horton, BK Forex Academy
Flagformation

AUDJPY It will go up from support Welcome back! Let me know your thoughts in the comments!
**AUDJPY - Listen to video!
We recommend that you keep this pair on your watchlist and enter when the entry criteria of your strategy is met.
Please support this idea with a LIKE and COMMENT if you find it useful and Click "Follow" on our profile if you'd like these trade ideas delivered straight to your email in the future.
Thanks for your continued support!
Brian & Kenya Horton, BK Forex Academy

NZDUSD bearish flag pattern NZDUSD flag pattern right now break trend line in hourly chart.
I expecting today dollar strong in USA data time.

IGLIGL made flag pattern on daily charts & breaking out of it with decent volumes.
Could be bought with mentioned stoploss & targets.

XAUUSDXAUUSD
I expecting Next move plan very big dip 1620 and father down side 1570, 1550....
30M chart new flag pattern almost complete, after break 1694 then confirm father downward trend.
.
..
...
4H chart flag key level 1690....
30M chart flag key level 1694....
Next Support& Targets levels. 1690, 1680, 1672, 1652, 1641, 1635, 1628, 1618.....

USDJPY-Flag/Pennant Did a flag for USDJPY with a bearish move (sell). 30 Pip S/L Count and approx. 170 Pips for T/P. For FMI (Forex Mastery Institute).

| BTCUSD | STILL IN BEARISH TERRATORY.Good day
I woke up this morning confused about why the market reacted the way it did and wondered what the reason for this move was. After clearing my chart up and reanalyzing it all I found that this bearish flag made more sense however, it was hard to draw up prior to this move based on the fact that the previous support did not express itself clearly until now.
Bear flag: The price had been trending within the confines of this flag formation for some time before breaking out recently. The +8% move we had today may have looked like a reversal to some but in the bigger picture, this move has solidified health in the market by confirming the completion of the bearish flag breakout. The overall target of this breakout will put BTC at around $11200. This price will not be reached overnight but we could see this level briefly in the weeks to come, it may even just be a wick touch however, I do feel this level is a high possibility.
Consolidation range: We have entered into a ranged area which is determined using the fib retracement from the swing low to swing high. We could see the price hover between these levels in the days to follow before the market decides where it wants to break. My opinion, based on the fact we are currently still in a bearish trend and other indicators that add confluence, is that the price will most probably break to the downside. The ranging area as seen on the chart is between $21668 and $20246.
The most important thing to look out for in the days to come is the price action within the confines of this ranging area as it will determine the general direction of the market to follow, as a breakout to the bulls will result in an overall breakout of the long term bearish trend we have been in since November last year.
Long-term bearish trend: We have been trending downwards within this channel since November 2021 therefore this trend has built a strong level of support and resistance. The price is currently nearing this long-term resistance which could result in an overall reversal from the bear or a continuation. As is said before the price and political stance express bearish signals.
Hold on tight as a move is coming in weeks to come and I do feel that it will be nearing the predicted target.
@TradingView

Flag formation in Hindalco After a big rise again a triangle pattern in 4hrs time frame, can buy again if it touches the support line again today, and wait for break out.

CARE Flag, Cup and handle brokenCanslim IBD A+ stock broke handle. If market good tomorrow. Classic cup and handle

Gold Forecast 26/08/2022Gold price remains inside a two-week-old bearish chart pattern as sellers attack the confirmation level surrounding $1,750. Adding strength to the flag’s support is the 50-HMA level and steady RSI (14).
In a case where the quote drops below $1,750, the theoretical slump towards the yearly low near $1,680 could avail the monthly bottom of $1,727 and the $1,700 threshold as intermediate halts.
Meanwhile, recovery moves could aim for the flag’s upper line, around $1,771 by the press time, before aiming for the monthly high near $1,808.
Overall, gold prices are likely to remain pressured but a confirmation from the $1,750 support becomes necessary to convince bears.

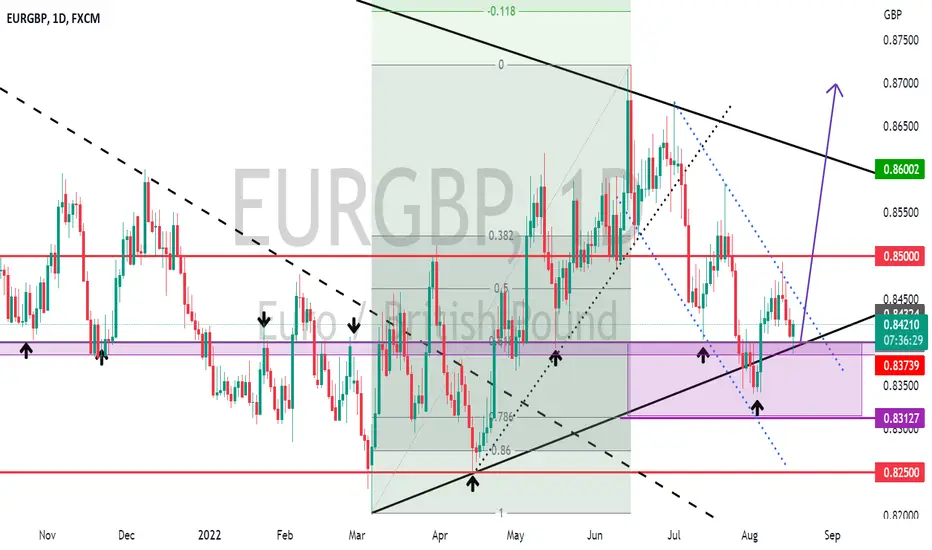
EURGBP POTENTIAL BULLISH FLAGWeekly TimeFrame shows a retracement of 61.8. On D1 we have a potential Bullish Flag. Looking to Confirm our entry after close of D1 candle today.
Flag and pole on IBMHeya fellow traders,
Back with my signature Flag and pole on a weekly chart with IBM. clear flag and pole formed from 2020 drop till today including the current bear market.
Oscillators shouting a BUY.
So, what are you waiting for. Small stop loss below the latest candle with a 70% return.
Thank me later !

EURUSD CPI Report Breakout-What's Next!Welcome back! Let me know your thoughts in the comments!
**EURUSD - Listen to video!
We recommend that you keep this pair on your watchlist and enter when the entry criteria of your strategy is met.
Please support this idea with a LIKE and COMMENT if you find it useful and Click "Follow" on our profile if you'd like these trade ideas delivered straight to your email in the future.
Thanks for your continued support!
Brian & Kenya Horton, BK Forex Academy

Bitcoin Bull Flag Setup In The 4-hour ChartLooking at Trading a possible Bull flag pattern on Bitcoin (BTC/USD) today.
In the Daily time frame, we are still in that large ascending channel and we have had a nice bounce off of the bottom of the channel suggesting a move higher.
In the 4-hour chart, there is a bull flag forming. We have an impulsive move up with four bullish candles taking out previous resistance. Accompanying this impulsive move upwards is large bullish volume. These are the two things we want to see when looking for a flag pole.
We then see the price cooling off and taking a breather while it slowly moves downwards which creates the look of the actual flag itself. We have three taps at the top of the flag and four at the bottom. We can see that the price is bouncing off of these two points of support and resistance. Accompanying this cool-off, consolidating period is low volume, which suggests that the price is just taking a breather and the bulls are getting ready for another leg up.
What I would want to see to confirm an entry for this bull flag is the following.
I have highlighted a yellow zone at the top of the flag pole. I want to see price impulsively break this yellow zone and close above it. I also want to see large bullish volume to accompany this impulsive move up. Then, If we see that, I want to see the price retrace back into the flag pole zone before opening up a long position targeting the middle of the daily channel. The price point around this target would be the 25500 level.
This risk to reward (depending on where you place your stop loss) could be a nice 1 / 3 or 1 / 4.
The price always respects the middle of a channel. This is why my target is the middle of the daily channel.
But for me to enter a long position in (BTC/USD), I need all those entry requirements to be met.
So let us see if we get that impulsive break, large volume, and a retrace. If we do, the vortex trader is going long on Bitcoin.
As most of you know, I am a crypto investor. This means I'm a crypto bull. But with regards to trading, I only trade the setups that the charts provide. One cannot jump into a position blindly without having a set of rules and reasons for entering and exiting. If you do this, it’s the same as gambling. But if you follow your rules and only enter positions systematically, then you are following a system that has been proven to be profitable and consistent and in the long run, according to your backtesting, this will yield you positive results.
On that note, I bid you all a great day.
Let's go Bitcoin!
The Vortex Trader.

AUDCHF I Retest the Support Area 60+ PipsWelcome back! Let me know your thoughts in the comments!
**AUDCHF - Listen to video!
We recommend that you keep this pair on your watchlist and enter when the entry criteria of your strategy is met.
Please support this idea with a LIKE and COMMENT if you find it useful and Click "Follow" on our profile if you'd like these trade ideas delivered straight to your email in the future.
Thanks for your continued support!
Brian & Kenya Horton, BK Forex Academy

70% UP IN 2 MONTHS: AMAZING STRATEGYHELLO FRIENDS!
Analyzed this stock 2 months back in my videos in my channel. Worked perfectly as per the analysis. Target is 300% which I assume may hit in 2 months.
Logic behind this trade is Stock was facing resistance of the trendline for a long time. In the third attempt in June it broke the trendline. Another logic is the stock had given breakout above the 50ma band and sustained above that for so long, which indicates bullishness of the stock and the entry of BIG BOYS.
One can notice the increasing volume bars too, which is proving the bullishness.
Entry was confirmed by the trendline breakout.
Captured 77% till today and we'll wit for the target with railing stoploss.
All levels are provided in the chart which explains everything.
I hope you all understand the logic behind the trade and will learn it.

USD/JPY (TA)Short Call! FX:USDJPY
Hello!
Flag Broke!
Making LLs and LHs on an hourly timeframe!
Application of Dow Theory
Application of Chart Pattern

EURJPY Following Correction, it Will Go DOWN!Welcome back! Let me know your thoughts in the comments!
**EURJPY - Listen to video!
We recommend that you keep this pair on your watchlist and enter when the entry criteria of your strategy is met.
Please support this idea with a LIKE and COMMENT if you find it useful and Click "Follow" on our profile if you'd like these trade ideas delivered straight to your email in the future.
Thanks for your continued support!
Brian & Kenya Horton, BK Forex Academy

NAS100USD (Trend Analysis)Long Call! OANDA:NAS100USD
Hello!
Looks like a trend reversal!
It's been in a good bearish run for a while and went in a little consolidation as you can see!
Now, it started making a series of HHs and HLs.
AB=CD Pattern formed!
Having a little resistance RN, most probably gonna break!
I will suggest taking entry after the resistance break, and riding the trend trailing SL along the way!
Best of Luck!

EUR/USD for long We have some obvious bullish signs here. First of all, if we look at the daily chart, we can see that we have a bullish flag pattern that suggests a move to the upside. So, to trade with a high probability of success, it is better to wait for a breakout on a daily basis (to avoid false intraday signals). That's what we got. Now the question is where to enter the position, if you haven't already. Well, I would look for any nearest retracement. Last week brought some fundamental changes as the Fed is more likely to slow rate hikes to delay the INEVITABLE RECESSION (which is technically already here). But OK. This can be some relief in eur (although the situation in the EU is even worse, but here we are LOL). Of course, if you entered a long position, don't be greedy and use some achievable targets, such as the AB CD 1.0 target from the daily chart. Keep in mind that anything can happen, and we could see bears enter the market at any moment, but that's why we use stop losses.

Consolidated Support & Resistance 1 WTF//TTK Prestige*It is a consolidated Support and Resistance as you all can see!
*Also marked the previous move of the Trend by forming the almost Identical Flag-Pattern.
*Broke both the 20 & 50 EMA's with a good bullish momentum, that made our stop-loss clear!
*i.e., the ideal S-L would be around the previous week Green Candle.
*Let the trend take a little retrace, then take the position after your own Analysis and Due Diligence
*The trend is bullish as of now but the momentum purely depends upon the next week's opening and close.

CADCHF - Landing at support +100 pipsWelcome back! Let me know your thoughts in the comments!
**CADCHF - Listen to video!
We recommend that you keep this pair on your watchlist and enter when the entry criteria of your strategy is met.
Please support this idea with a LIKE and COMMENT if you find it useful and Click "Follow" on our profile if you'd like these trade ideas delivered straight to your email in the future.
Thanks for your continued support!
Brian & Kenya Horton, BK Forex Academy

Dabur FutDabur fut made flag n pole pattern on hourly charts & broke above pennant with highest OI addition .
Could be bought with mentioned stoploss & target
