BITCOIN Bullflag and new all-time high ?!BULL FLAG and new all-time high 👀⏰
📇BTC daily-chart (BITSTAMP) and 💡everything important in the chart !
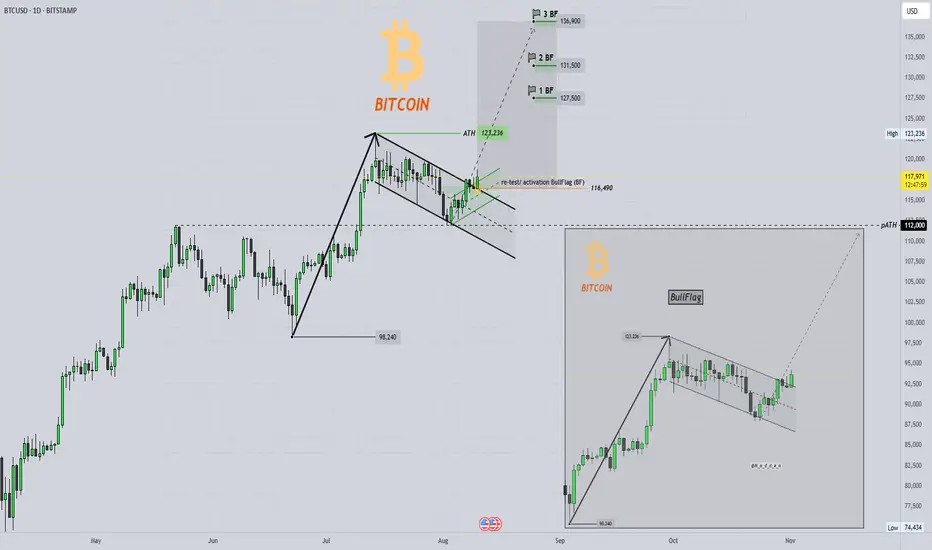
Bitcoin has broken out of its sideways consolidation and has recently successfully tested this channel (bull flag), thereby activating a potential bull flag.
The resulting targets (see example) are based on the low of approximately $98,240 and the sharp rise to the current all-time high of $123,236.
See the flags at the top with the corresponding price-targets 🏁 👀
💥Rising blue diagonal line for the previous support
💥From an indicator perspective, a possible bullish cross is imminent in the MACD-Indicator and bearish momentum may continue to decline ...
💥Finally, the bull flag (textbook) as an example of a chart pattern.
🔥Please also take a look at my last idea, as there are certain similarities based on this...
🎯 If you like this idea, please leave me a 🚀 and follow for updates 🔥⏰
Furthermore, any criticism is welcome as well as any suggestions etc. - You're also very welcome to share this idea.
I wish you a pleasant Sunday and a good start to the week & successful trading decisions 💪
M_a_d_d_e_n ✌
NOTE: The above information represents my idea and is not an investment/trading recommendation! Without any guarantee & exclusion of liability!
Flag
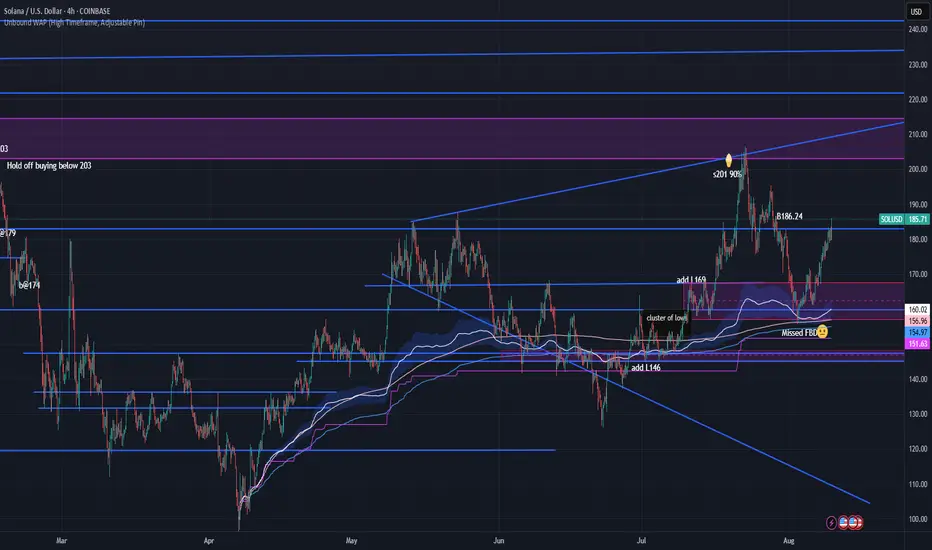
Ideal FBD on SOL with UWAPAug 25. FBD of cluster of lows from July 10-16. 6 day balance.. Combine the FBD with UWAP (Unbound WAP High Timeframe Adjustable Pin. A+ setup
XAUUSD Sell Setup bearish Flag
Low volume
High risk trade Xauusd Is sideways risky setup use small lots
SL TP EP all in Charts

Bearish Flag in PayPal?PayPal has limped as the broader market flirts with new highs, and some traders may see downside risk.
The first pattern on today’s chart is the drop on July 29 after the company reported quarterly results. While some of the numbers beat, investors focused on lower profitability. Are fundamentals deteriorating?
Second, prices continued lower the next three sessions. They inched slightly higher before stalling again, creating a potential bearish flag.
The drop occurred at the 8-day exponential moving average (EMA), which is also below the 21-day EMA. MACD is falling as well. Those patterns may be consistent with a short-term downtrend.
Finally, the 50-day simple moving average (SMA) had a “death cross” below the 200-day SMA in April and has stayed there since. That may suggest a longer-term downtrend has begun.
TradeStation has, for decades, advanced the trading industry, providing access to stocks, options and futures. If you're born to trade, we could be for you. See our Overview for more.
Past performance, whether actual or indicated by historical tests of strategies, is no guarantee of future performance or success. There is a possibility that you may sustain a loss equal to or greater than your entire investment regardless of which asset class you trade (equities, options or futures); therefore, you should not invest or risk money that you cannot afford to lose. Online trading is not suitable for all investors. View the document titled Characteristics and Risks of Standardized Options at www.TradeStation.com . Before trading any asset class, customers must read the relevant risk disclosure statements on www.TradeStation.com . System access and trade placement and execution may be delayed or fail due to market volatility and volume, quote delays, system and software errors, Internet traffic, outages and other factors.
Securities and futures trading is offered to self-directed customers by TradeStation Securities, Inc., a broker-dealer registered with the Securities and Exchange Commission and a futures commission merchant licensed with the Commodity Futures Trading Commission). TradeStation Securities is a member of the Financial Industry Regulatory Authority, the National Futures Association, and a number of exchanges.
TradeStation Securities, Inc. and TradeStation Technologies, Inc. are each wholly owned subsidiaries of TradeStation Group, Inc., both operating, and providing products and services, under the TradeStation brand and trademark. When applying for, or purchasing, accounts, subscriptions, products and services, it is important that you know which company you will be dealing with. Visit www.TradeStation.com for further important information explaining what this means.

BSE Takes Breather Before Its Next Move‽BSE Ltd, Asia's oldest stock exchange and a backbone of India's financial markets, has been a silent wealth creator over the past year.
From early 2024, the stock went on a dream run, driven by surging investor participation, record equity and derivatives turnover, and its diversified revenue streams - listing fees, transaction charges, and new technology-led offerings.
But like every strong trend, momentum eventually pauses. Since June, the rally cooled, and the price entered a downward-sloping channel, hinting at profit booking and cautious sentiment.
Technicals
• Primary Resistance: ₹2,500 - the top of the falling channel and a key breakout gate.
• Current Support: *2,365, where buyers have recently shown interest.
• Major Demand Zone: ₹2,270-₹2,300 - a historical springboard that fueled earlier surges.
• If Support Fails: A slide towards *1,946 and 1,775 could unfold.
The structure resembles a falling channel with a descending triangle base a classic setup where a decisive breakout can flip sentiment overnight.
The Bigger Picture
BSE's fundamentals remain robust
• India's booming equity culture is increasing trading volumes.
• Growing market share in derivatives is adding fresh revenue streams.
• Technology upgrades and new product introductions are future-proofing its business model.
Short-term price weakness appears more like a healthy pause in a long-term uptrend - provided the ₹2,270 zone holds.
Key Watch Levels
• Bullish Trigger: Sustained close above ₹2,500 could open the path to ₹2,800+
• Bearish Trigger: Close below ₹2,270 may extend the correction to ₹1,946 or 1,775.
Market Sentiment Cue
If the broader market remains strong and participation continues to rise, BSE could be setting up for its next breakout phase. But if the market turns risk-off, the stock may test its lower zones before attempting a rebound.

Bitcoin Bullish Flag Pattern Analysis & $140,000 Target🚩 Bullish Flag Pattern Formation
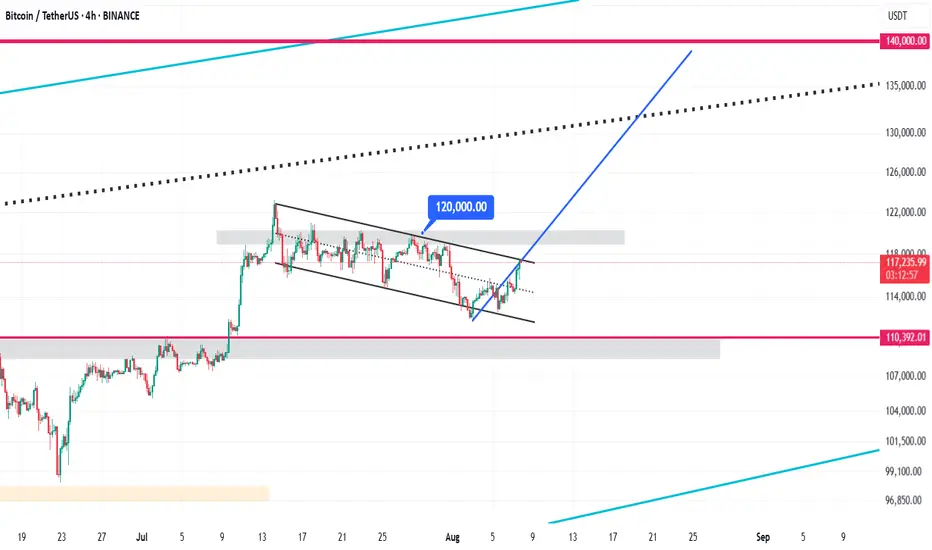
Bitcoin is currently forming a bullish flag pattern on the 4-hour chart. This pattern typically appears after a sharp upward move and represents a short-term consolidation within a descending channel. It usually signals a continuation of the strong bullish trend. Currently, the price is oscillating between the upper and lower boundaries of this channel, poised for a potential breakout.
⏳ Duration of the Correction Phase
The correction inside this channel has lasted from July 14 to August 8, 2025, spanning approximately 25 days. This relatively long consolidation period indicates a deep stabilization phase, allowing the market to gather momentum for the next upward wave. During this time, Bitcoin traded in a tight range between the channel’s support and resistance levels.
⚠️ Critical Resistance at $120,000
The key resistance level to watch is $120,000. If Bitcoin can break this level decisively with strong volume and confirming candles, the bullish flag pattern will be validated, signaling a continuation of the upward trend. This breakout point is considered an optimal entry for new long positions.
🎯 Price Target at $140,000
The target price derived from the bullish flag pattern, calculated by measuring the flagpole and projecting it from the breakout point, is around $140,000. This represents approximately a 20% gain from the breakout and may serve as a significant psychological resistance level.
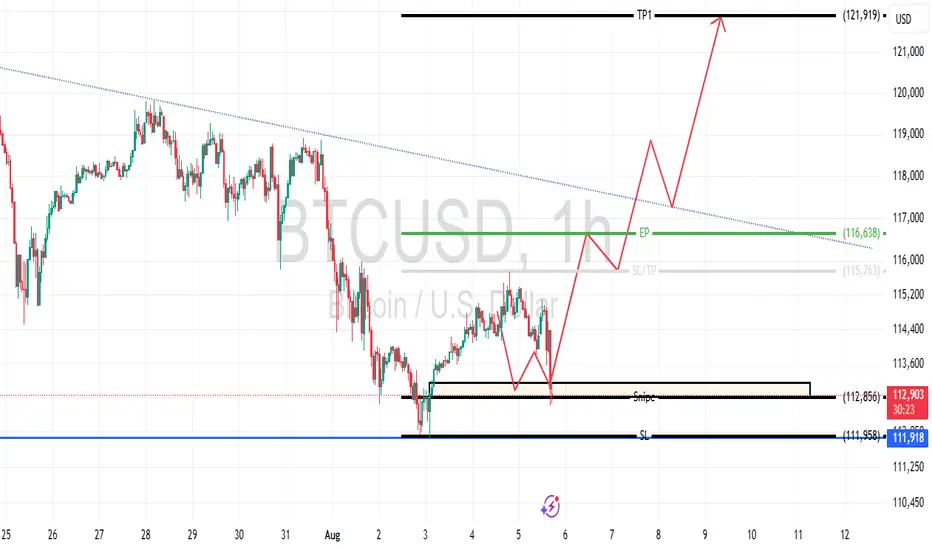
Bitcoin Possible new ATHPrice targets TP1 at $121,919, with an entry point (EP) at $116,638, stop loss (SL) at $111,987, and a support/slip level at $112,856. Expecting a rise from current levels near $113,085, driven by a breakout above the descending trendline.
GBPUSD Pressure to the downside following breakout of flagResistance trendline is still being respected and the break out of the bearish pattern is a strong confirmation for shorting.

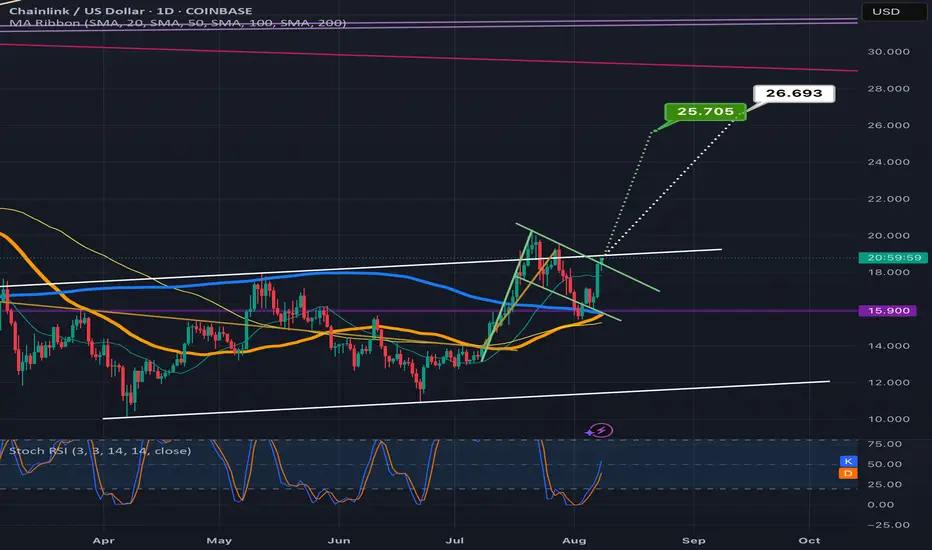
Chainlink looks ready 2 break up from bullflag & a double bottomGreen target is the bullflag white target is the double bottom. *not financial advice*
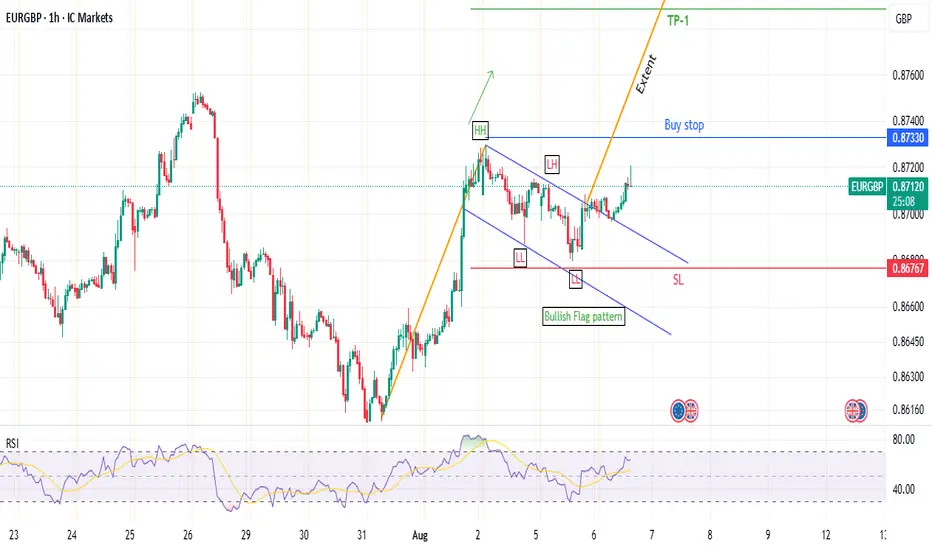
EUR/GBP: Bull Flag Forming for a Potential Breakout?Hey everyone,
Sharing my view on EUR/GBP on the 1-hour chart. I've spotted what looks like a classic Bullish Flag pattern developing after a strong upward surge. This is a continuation pattern, and I'm looking to trade the breakout.
My Game Plan: I'm playing this with a conservative entry, waiting for a clear break of the top of Flag pole. Here are the specific levels for my trade plan:
🎯 Entry (Buy Stop): $0.8733
🛡️ Stop Loss: $0.8677 (A break below here would invalidate the bullish setup for me)
💰 Take Profit 1: $0.8789 (A clean 1:1 Risk/Reward)
🏆 Take Profit 2: $0.8822 (Length of the flag pole)
Bullish Flag Pattern.
Bullish Flag Pattern.
Crossing 435 with Heavy volumes will
trigger more positivity & will expose
New Highs targeting 700+
On flip side, breaking 300 now, will
bring more selling pressure.

EURCAD: More Growth Ahead 🇪🇺🇨🇦
EURCAD broke a resistance line of a bullish flag pattern yesterday.
A consequent confirmed Break of Structure BoS indicates
that the rise will most likely continue.
The next strong resistance is 1.61.
The market is going to reach that soon.
❤️Please, support my work with like, thank you!❤️
I am part of Trade Nation's Influencer program and receive a monthly fee for using their TradingView charts in my analysis.

ENAUSDT - Bullish Flag or Descending Channel?My operation is to eat the profits of this period, and then change the operation according to the market

Bitcoin still bullish.As long we stay above 112k support and keep building the channel that looks more and more like a bull flag, we are golden for a new ATH.

Pennant — Trend Is Your Best Friend 🚩 Pennant — Trend Is Your Best Friend 📈
drive.google.com
🔍 Introduction
The Pennant is a trend continuation pattern, resembling a small triangle that forms after a strong initial move (known as the “flagpole”). It is similar to the Flag pattern, but with one key difference: the body of the Pennant is formed by two converging trendlines, rather than parallel ones.
📐 Pattern Description
The Pennant forms after a strong, impulsive price move, indicating that the trend is likely to continue after a short pause.
Like the Flag, the Pennant consists of two main components:
The flagpole — a sharp, directional move (either bullish or bearish)
The Pennant body — a brief consolidation shaped like a symmetrical triangle 🔺
🟢 A bullish pennant forms after a strong upward move
🔴 A bearish pennant follows a strong downward move
🧠 Market psychology behind the pattern:
After a big move, many traders expect a reversal and begin taking counter-trend positions. But when the breakout occurs in the direction of the original trend, it triggers a wave of new orders, pushing price even further. That’s why the Pennant is often used to enter trades in the direction of the dominant trend.
📉 Volume behavior is also key:
High volume during the initial move
Low volume during the Pennant’s consolidation
Rising volume on the breakout
This volume pattern reflects renewed trader interest and often leads to a more explosive breakout compared to a Flag, due to the tightening nature of the consolidation.
⚠️ A weak or sloppy move before the Pennant weakens the signal and increases the risk of false breakouts.
🎯 Entry & Stop-Loss Strategy
📥 Entry: After a confirmed breakout above the Pennant’s resistance (or below it for bearish setups)
🛑 Stop-loss: Placed just below the last local low before breakout
💰 Profit Target:
Partial take profit at the top of the flagpole
Full target = the height of the flagpole projected from the breakout point (aka the Measured Move)
Always account for key support/resistance levels to define the potential range
💡 The Pennant often offers great risk/reward due to its tight structure and explosive potential.
💡 My Pro Tips for Trading Pennants
✅ Pennant Pattern Criteria
Trend continuation pattern
A strong, nearly vertical move preceding the Pennant
Triangle-shaped consolidation (two converging lines)
The Pennant body must be shorter than the flagpole
The lowest point of the Pennant should not exceed half the length of the flagpole
Breakouts should happen in the direction of the initial trend
Tight range before breakout increases accuracy
📈 What Strengthens the Signal
Sharp, clean, directional initial move (strong flagpole) ⚡
High volume on the initial move, and volume surge on breakout 💥
⚠️ What Weakens the Signal
Choppy or weak price action before the Pennant 🫤
Lack of volume during the flagpole or breakout 💤
✅ Examples of My Winning Pennant Setups
🔗 EURUSD Bearish Pennant — Ready to Drop
❌ Examples of My Losing Setups
🔗 XAUUSD Bullish Pennant — Failed Follow-through
💬 Do You Trade Pennants?
They’re one of the most powerful continuation patterns when paired with clean price action and volume confirmation. What’s your experience with Pennants? Share your wins — and fails — below 👇👇

AG: Short-Term Slap, Long-Term ConvictionAG: Short-Term Slap, Long-Term Conviction
Let’s talk positions — not just charts.
I’ve been holding Dec 18, 2026 $10 calls as my core AG thesis for a while now. These are not trades — they’re my conviction play on a long-overdue re-rating of First Majestic ( NYSE:AG ) relative to spot silver and the broader miner complex. I currently hold 90 contracts averaging $1.21.
On Friday, I added to that core, because the setup continues to confirm.
Now here’s where it gets fun:
Despite being fully sized on the long side, the chart slapped me in the face twice...once last week, and again yesterday. That bull flag? Still intact. Friday’s flush? Weak hands out. Volume? Telling the real story.
So I took a tactical swing:
Short-Term Trade: Sept 19 $9 Calls
✅ Started with 10 contracts @ $.61
✅ Added 10 @ $0.33 on Friday
✅ Added 10 more @ $0.38 on Monday
Average: $0.44 (trading at parity now)
This isn’t about guessing. This is about alignment:
✅ Silver strength
✅ Lagging miner catch-up
✅ Weekly & monthly volume expansion
✅ Time symmetry between past squeezes
Long-term thesis is the foundation.
Short-term trades like this are the bonus rounds when the setup screams.
If AG holds above $7.99 and clears $8.35 cleanly, the next key level is $9.35.
Above that? We’re talking $11.00+.
Position Breakdown
Core: 90 Dec 2026 $10 Calls (scaled in with average around $1.21)
Trading Position: 30 Sept $9 Calls, avg $0.44
Will consider adding/rolling longer if $9.35 breaks with volume

Gold - Breakout and retest of a bullish FlagBullish flag break out and price is in a demand zone. As long as the demand holds, pressure will be to the upside.

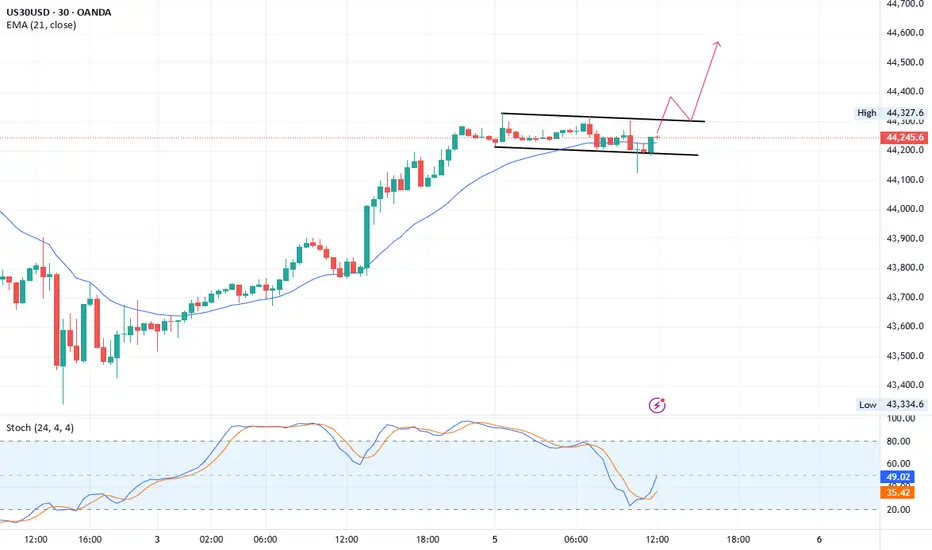
US30 Bullish flag patternUS30
M30 chart bullish flag pattern
Buy: current rate 44238
Stop Loss: 44125
1st TP: 44388
2nd TP: 44570

Lemonade may be ready for a squeezeNYSE:LMND broke dramatically into overbought territory on the weekly chart earlier this year. It's taken understandable time to digest those gains and now looks like it could be building steam to revisit prices reached during that breakout.
The shorter term 4H chart, more suitable for entry and exit signals, illustrates a recent break above a cup and handle formation. That little pump appears to be consolidating rapidly.
Should the shorter term move find traction, the the weekly chart could provide a reasonable target as a trading range is formed for a larger move in the long run. A swing trade looks attractive at this point with potential 50% upside.

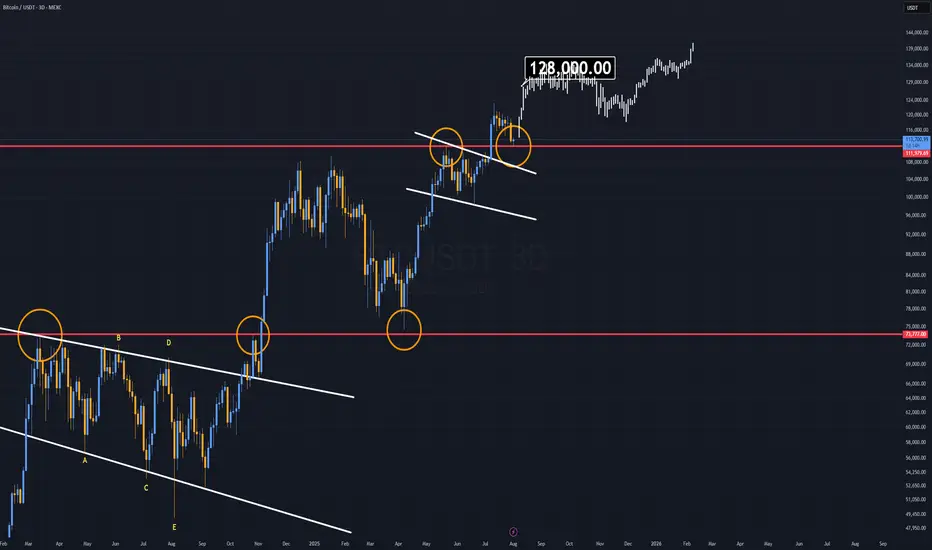
Bitcoin Analysis (3D)Bitcoin is currently trading in a very specific zone that resembles a classic bull flag continuation pattern, similar to the one we saw during last year’s rally.
Back then, a slow-forming bull flag broke to the upside, pushed to new all-time highs, and then retested the top of the same flag before continuing higher.
Now, we are witnessing a similar setup, but this time the formation has developed much faster.
The key difference:
While last year’s bull flag took a longer time to mature, the current one is more compressed, indicating a potentially sharper move if confirmed.
The $108K daily level is critical.
As long as Bitcoin remains above this level, the structure favors a new rally.
This could be the start of another impulsive leg, targeting the $128K Area.
EURJPY in bearish trendwith no major sign of reversal trend is bearish, and with a bearish flag pattern, it has added another confluence of the continuity of its current trend trade can be taken when the price breaks the lower trendline of flag

XAUUSDXAUUSD breakout falling channle and resistance zone.
Buy above 3295
Stop Loss: 3291
1st TP: 3308
2nd TP: 3313
3rd TP: 3322
4th TP: 3333
