Tellor (TRB) a hidden gem, will previous price action repeat?Hello again dear reader for a another analysis.
From August to December 2023 TRB has seen a MASSIVE move of 7000% gains over the course of just 126 days. Since then it has corrected a whopping 96%!
There is now a reason to be bullish on this coin. Looking at the drawn structure we can see multiple important touch zones described with the letters ''A till F'' (NOT ELLIOT). It is quite possible price action might correct further till 19$ where a big support zone lies, but there is no guarantee that ''will'' happen.
Target: 1200$ (M-cap of 3B which is very achievable)
Stoploss: 15$
I aim to keep analysis simple and easy to understand. Any questions of requests for analysis feel free to ask!
Rustle
Flag

Silver (XAG/USD) Technical Analysis – March 13, 2025 (15-Min Cha1. Trend Identification
Short-Term Uptrend Developing:
The price is trading above the 200-period moving average (blue line), indicating bullish momentum.
The Point of Control (POC) at 33.017 suggests a key liquidity zone where buyers have been active.
Key Resistance Levels in Focus:
The price is currently struggling near 33.043, with the next resistance at 33.259 (higher POC level).
A break above 33.259 could trigger a further rally.
2. Key Support & Resistance Levels
Immediate Support: 33.000 - 33.017 (POC, psychological level).
Immediate Resistance: 33.259 (higher POC, recent high).
Upside Target: 33.500 - 33.600 (upper channel projection).
Downside Risk: 32.900 - 32.800 (lower channel support).
3. Volume Analysis
Last 120 Bars: Up Vol > Down Vol by +26.82%, indicating strong buyer dominance.
Last 60 Bars: Up Vol > Down Vol by +41.46%, further confirming short-term bullish strength.
Interpretation:
Buyers are clearly in control, but the resistance at 33.259 needs to be breached for a strong continuation.
If price pulls back to 33.017 and finds support, it may provide a better entry point.
4. Chart Patterns & Projections
Bullish Continuation Scenario:
If price breaks above 33.259, it is likely to rally toward 33.500 - 33.600 (upper trend channel).
Bearish Pullback Scenario:
A failure to break 33.259 could lead to a retracement toward 32.900 - 32.800.
Trade Setups & Risk Management
1. Long Trade Setup (Bullish Scenario)
Entry: Buy above 33.259 (breakout confirmation) or on a pullback to 33.017 (strong support).
Stop-Loss: Below 32.900 (recent low & lower channel boundary).
Targets:
First Target: 33.400
Final Target: 33.600 (upper channel resistance).
Risk-Reward Ratio: 1:3 or better.
2. Short Trade Setup (Bearish Pullback Scenario)
Entry: Sell below 33.000 (breakdown confirmation).
Stop-Loss: Above 33.100 (recent consolidation zone).
Targets:
First Target: 32.900
Final Target: 32.800 (lower channel support).
Risk-Reward Ratio: 1:2 or better.

DAX Index Technical Analysis – March 12, 2025 (15-Min Chart)1. Trend Identification
Reversal to Bullish Momentum:
The price has broken above the 200-period moving average (red line), indicating a shift from bearish to bullish sentiment.
The Point of Control (POC) at 22,324.82 previously acted as strong support, from which price has bounced.
Volume Confirmation of Bullish Move:
The last 60 bars show an up-volume dominance of +32.10%, confirming that buyers are gaining control.
However, the 120-bar volume is still slightly negative (-1.71%), indicating lingering selling pressure.
2. Key Support & Resistance Levels
Immediate Support: 22,500 - 22,550 (recent breakout zone).
Stronger Support: 22,324 (POC) – a critical level where buyers stepped in.
Immediate Resistance: 22,700 - 22,750 (local resistance zone).
Upside Target: 23,000 - 23,200 (upper trend channel projection).
3. Volume Analysis
Last 120 Bars: Up Vol < Down Vol by -1.71%, showing slight selling pressure.
Last 60 Bars: Up Vol > Down Vol by +32.10%, indicating strong short-term buying activity.
Interpretation:
Bullish Confirmation: Buyers have stepped in aggressively, pushing price above the 200-MA and key support zones.
Watch for Pullbacks: A retracement toward 22,500 - 22,550 could provide a better long entry before continuation.
4. Chart Patterns & Projections
Bullish Continuation Scenario: If price holds above 22,550, it is likely to move toward 23,000 - 23,200 within the ascending channel.
Bearish Pullback Scenario: If price fails to hold 22,500, a retracement to 22,324 or lower is possible.
Trade Setups & Risk Management
1. Long Trade Setup (Bullish Scenario)
Entry: Buy near 22,550 (pullback entry) or above 22,750 (breakout confirmation).
Stop-Loss: Below 22,500 (recent support).
Targets:
First Target: 22,900
Final Target: 23,200 (upper channel resistance).
Risk-Reward Ratio: 1:3 or better.
2. Short Trade Setup (Bearish Pullback Scenario)
Entry: Sell below 22,500 (breakdown confirmation).
Stop-Loss: Above 22,700.
Targets:
First Target: 22,400
Final Target: 22,324 (POC & key support).
Risk-Reward Ratio: 1:2 or better.

US 100 Technical Analysis – March 12, 2025 (15-Min Chart)1. Trend Identification
Bearish Bias:
The price is trading below the 200-period moving average (red line), indicating overall bearish momentum.
The Point of Control (POC) at 19,449.24 represents a high liquidity area, acting as a strong resistance level.
Short-Term Consolidation:
The price is oscillating around 19,375, suggesting market indecision before a breakout or breakdown.
2. Key Support & Resistance Levels
Immediate Resistance: 19,400 - 19,450 (POC and recent highs).
Immediate Support: 19,300 (lower consolidation boundary).
Stronger Support: 19,000 (psychological level & lower trend channel).
Upside Target: 19,500 - 19,600 (breakout scenario).
3. Volume Analysis
Last 120 Bars: Up Volume < Down Volume by -15.53%, indicating stronger selling pressure.
Last 60 Bars: Up Volume < Down Volume by -10.28%, reinforcing short-term bearish dominance.
Interpretation:
Bearish Sentiment Dominates: Selling pressure is higher, increasing the probability of a breakdown below 19,300.
If buyers regain control near 19,300, a bounce toward 19,450 is possible.
4. Chart Patterns & Projections
Bearish Breakdown Scenario: If price fails to hold 19,300, it could drop to 19,000 (blue channel projection).
Bullish Reversal Scenario: A breakout above 19,450 could trigger a move toward 19,500 - 19,600.
Trade Setups & Risk Management
1. Short Trade Setup (Bearish Breakdown)
Entry: Sell below 19,300 (confirmed breakdown).
Stop-Loss: Above 19,400 (previous resistance).
Targets:
First Target: 19,150 (mid-support).
Final Target: 19,000 (key support).
Risk-Reward Ratio: 1:2 or better.
2. Long Trade Setup (Bullish Breakout)
Entry: Buy above 19,450 (confirmed breakout).
Stop-Loss: Below 19,375 (recent consolidation zone).
Targets:
First Target: 19,500 (local resistance).
Final Target: 19,600 (upper channel).
Risk-Reward Ratio: 1:3 or better.

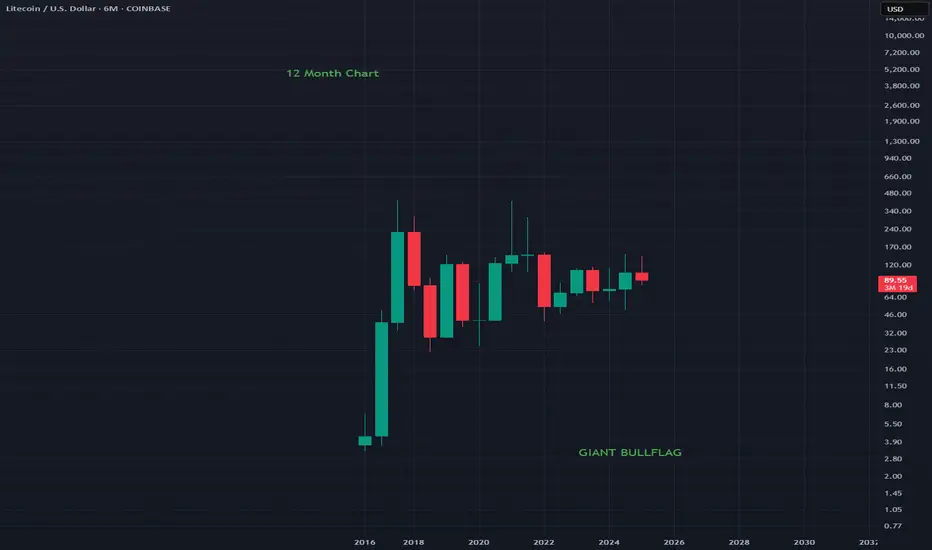
LTCUSD - 12 Month Chart Litecoin has produced a beautiful Bullflag on the 12 Month chart
Its honestly crazy how great this looks on a yearly timeframe
If you want to go very very long this is a great option
MASSIVE BULLFLAG
ADA/BTC Looking .. ummmThe signs are showing a potential short term reversal but it could keep dumping from here. This is some potential long territory but don't hold it long IMO #NFA #GodSpeed

Technical Analysis of Gold (XAU/USD) – 1H Chart1. Trend Identification
Transition from Consolidation to Uptrend:
The price has broken out of a prolonged consolidation phase around the Point of Control (POC) at 2911.933.
The 200-period moving average (blue line) was previously acting as resistance but now appears to be flipping into support.
Short-Term Bullish Momentum with Caution:
The projected price path (blue and red channels) suggests an uptrend toward the 3,020 - 3,060 zone but with potential retracements.
However, recent volume analysis suggests short-term selling pressure is increasing, which could lead to a pullback before continuation.
2. Key Support & Resistance Levels
Immediate Support: 2,900 - 2,911 (POC and recent breakout zone).
Immediate Resistance: 2,920 - 2,930 (current price range resistance).
Stronger Resistance: 3,000 - 3,020 (psychological level & upper channel).
Downside Risk: If price falls below 2,900, it may test 2,880 - 2,860.
3. Volume Analysis
Last 120 Bars Volume:
Up Vol < Down Vol by -0.28% (neutral to slightly bearish sentiment).
Last 60 Bars Volume:
Up Vol < Down Vol by -23.28%, showing short-term selling pressure dominance.
Interpretation:
The long-term volume trend is neutral, but short-term volume suggests sellers are controlling the market, which could lead to a temporary pullback before continuation.
4. Chart Patterns & Projections
Bullish Scenario: If the price sustains above 2,911, it could trend toward 3,020 - 3,060 within the ascending channel.
Bearish Scenario: A breakdown below 2,900 could lead to a correction toward 2,880 - 2,860.
Trade Setups & Risk Management
1. Long Trade Setup (Bullish Scenario)
Entry: Buy on breakout above 2,930 (confirmation of strength).
Stop-Loss: Below 2,900 (previous support zone).
Targets:
First Target: 2,980 (mid-channel resistance).
Final Target: 3,020 - 3,060 (upper channel boundary).
Risk-Reward Ratio: 1:3 or better.
2. Short Trade Setup (Bearish Pullback Scenario)
Entry: Sell below 2,900 (confirmed breakdown).
Stop-Loss: Above 2,920 (previous support turned resistance).
Targets:
First Target: 2,880 (key support).
Final Target: 2,860 (lower channel boundary).
Risk-Reward Ratio: 1:2 or better.
LinkedIn Post: Professional Market Insight on Gold (XAU/USD)
📊 Gold (XAU/USD) – Technical Outlook & Trade Setup 📊
Gold has broken out of a consolidation phase around $2,911 and is now trading near resistance at $2,920 - $2,930. While the long-term trend remains bullish, short-term volume indicates increasing selling pressure (-23.28%), suggesting a possible pullback before continuation.
🔍 Key Observations:
✅ Support Zone: $2,900 - $2,911 (Point of Control).
✅ Resistance Zone: $2,920 - $2,930 (immediate breakout level).
✅ Potential Bullish Move: If Gold sustains above $2,930, we could see a rally toward $3,020 - $3,060.
✅ Potential Bearish Pullback: A rejection at $2,920 could lead to a retest of $2,880 - $2,860.
📈 Trade Setup:
Bullish Play: Buy above $2,930, stop below $2,900, targets $2,980 - $3,060.
Bearish Play: Sell below $2,900, stop above $2,920, targets $2,880 - $2,860.
🔑 Risk Management: Disciplined trade execution and strong risk-reward ratios are key! Always protect capital first.
What’s your outlook on Gold? Let’s discuss in the comments! 👇 #Gold #Trading #XAUUSD #RiskManagement #TechnicalAnalysis

Technical Analysis of Silver (XAG/USD) – 1H Chart1. Trend Identification
Medium-Term Bullish Trend: The price has been rising since early March, reclaiming the 200-period moving average (blue line), a sign of renewed buying strength.
Short-Term Consolidation: The price is currently testing resistance near the Point of Control (POC) at 32.551, indicating an important decision point for the next move.
Bearish Short-Term Volume Shift: The last 60 bars show higher selling volume (-33.63%), suggesting potential weakness in the short term before a breakout or pullback.
2. Key Support & Resistance Levels
Immediate Resistance: 32.55 - 32.60 (POC and recent highs).
Immediate Support: 32.00 - 32.20 (recent demand zone).
Stronger Support: 31.80 - 31.50 (lower channel boundary).
Upside Targets: 33.00 - 33.20 (upper channel projection).
3. Volume Analysis
Last 120 Bars Volume: Up Vol > Down Vol by 12.95%, showing medium-term buying dominance.
Last 60 Bars Volume: Up Vol < Down Vol by 33.63%, indicating short-term selling pressure, which may lead to a minor pullback before continuation.
4. Chart Patterns & Projections
The projected path (blue and red channels) suggests two scenarios:
Bullish Breakout: Above 32.55, targeting 33.00 - 33.20.
Bearish Pullback: A rejection at 32.55 could push the price toward 31.80 - 31.50 before a potential recovery.
Trade Setups & Risk Management
1. Long Trade Setup (Bullish Scenario)
Entry: Buy on breakout above 32.60 (confirmation of resistance breach).
Stop-Loss: Below 32.20 (to avoid false breakouts).
Targets:
First Target: 33.00
Final Target: 33.20 (upper channel boundary).
Risk-Reward Ratio: 1:3 or better.
2. Short Trade Setup (Bearish Pullback Scenario)
Entry: Sell below 32.20 (confirmed breakdown).
Stop-Loss: Above 32.60 (recent resistance).
Targets:
First Target: 31.80 (lower channel mid-support).
Final Target: 31.50 (strong support zone).
Risk-Reward Ratio: 1:2 or better.

Technical Analysis of EUR/USD (1H Chart)1. Trend Identification
Bullish Trend: The price has been in a strong uptrend, trading well above the 200-period moving average (blue line), indicating continued buying interest.
Current Consolidation: The price is moving sideways near 1.0844 (Point of Control - POC), suggesting accumulation before a potential breakout or breakdown.
2. Key Support & Resistance Levels
Immediate Resistance: 1.0885 - 1.0900 (recent highs).
Immediate Support: 1.0844 (POC level) – a crucial liquidity zone.
Stronger Support: 1.0800 (psychological level and near the moving average).
Upside Targets: 1.1000 - 1.1100 (upper channel projection).
3. Volume Analysis
Last 120 Bars Volume: Up Vol > Down Vol by 37.23%, indicating strong bullish dominance.
Last 60 Bars Volume: Up Vol > Down Vol by 3.44%, showing that buyers are still in control, but with less dominance than the broader trend.
4. Chart Patterns & Projections
The projected path (blue and red channels) suggests two scenarios:
Bullish breakout above 1.0900, with a move toward 1.1000 - 1.1100.
Bearish breakdown below 1.0840, leading to a retracement toward 1.0700 - 1.0600.
Trade Setups & Risk Management
1. Long Trade Setup (Bullish Scenario)
Entry: Buy on breakout above 1.0900.
Stop-Loss: Below 1.0840 (previous support).
Targets:
First Target: 1.1000 (psychological level).
Final Target: 1.1100 (upper channel boundary).
Risk-Reward Ratio: 1:3 or better.
2. Short Trade Setup (Bearish Breakdown Scenario)
Entry: Sell below 1.0840 (confirmed breakdown).
Stop-Loss: Above 1.0900.
Targets:
First Target: 1.0700 (mid-channel support).
Final Target: 1.0600 (lower channel boundary).
Risk-Reward Ratio: 1:2 or better.

Bullish Continuation Pattern (Bullish Flag)Bullish Continuation Pattern, Bullish Flag
🔹 Bullish Flag – The price had a strong upward move, followed by a slight consolidation. If it breaks above resistance, it could continue the uptrend.
📊 Key Levels to Watch:
Target 1.57000
Stop Loss 1.55300
Support: Around 1.555
Resistance: Around 1.561 - 1.565
If price breaks above resistance with volume, it could indicate a strong bullish move! 🚀
⚠️ Risk Management: Always use 1-2% risk per trade to protect capital.
📌 Trade Wisely & Stick to Plan! 🚀

EURCAD chart shows a Bullish Flag PatternThis EURCAD chart shows a **Bullish Flag Pattern**, as indicated on the chart.
**Key Observations:**
- **Bullish Flag Pattern**: This is a continuation pattern that typically signals a potential upward breakout after consolidation.
- **Resistance Zone**: Around **1.56200 - 1.56400**.
- **Support Zone**: Around **1.55600 - 1.55700**.
- **Moving Averages**: Price is trading above the moving averages, indicating bullish momentum.
- **Volume Analysis**: Increased volume on the breakout suggests strong buying pressure.
### **Trading Plan:**
- **Entry**: If price retraces to support and shows bullish confirmation, a buy trade can be placed near **1.55700 - 1.55800**.
- **Stop Loss (SL)**: Below **1.55400** to minimize risk.
- **Take Profit (TP)**: Around **1.57000 - 1.57500** in case of a breakout.

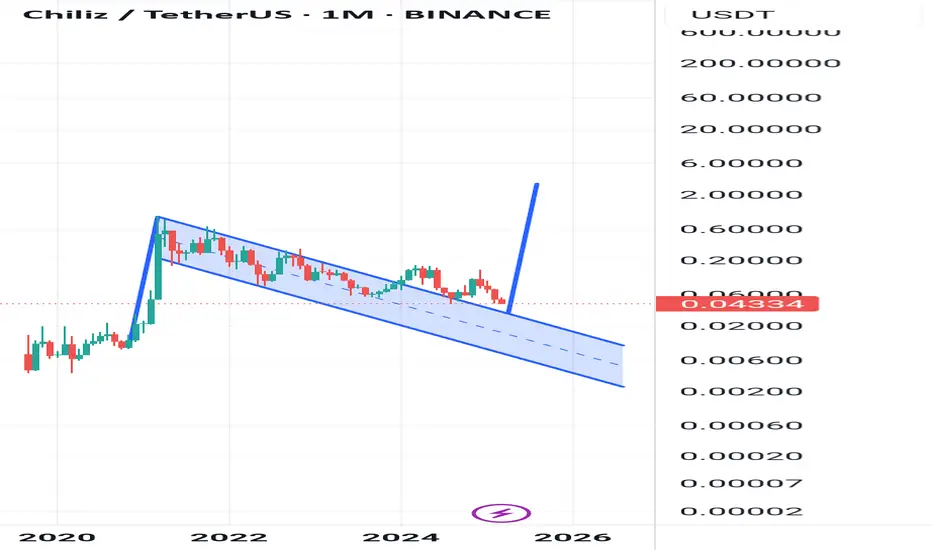
Have you considered this alternative?Chiliz (CHZ) leads innovation in fan engagement with their favorite teams through blockchain technology. Its platform enables the creation of Fan Tokens that offer users exclusive access to experiences and decisions related to sports clubs, eSports teams, and more.
Chz has been trading in a massive bullflag as seen in the above analysis. Although it hasn't seen alot of love recently i suspect it will do well in the coming months ahead.
Target: 3$
Stoploss: 0.032 (upon re-entry of the channel)
Rustle
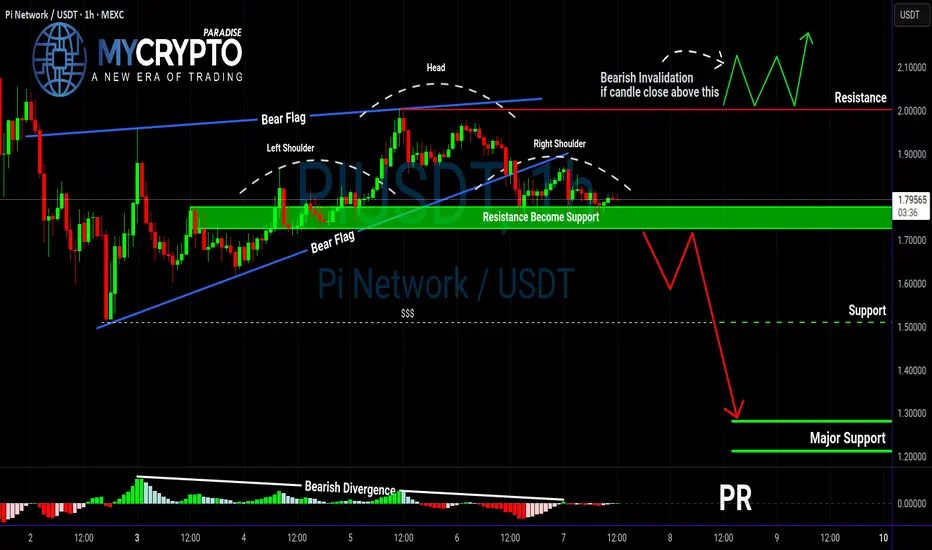
PIUSDT Breakdown Incoming? Bearish Patterns Are Stacking Up! Yello, Paradisers! Is PIUSDT about to break down hard? The charts aren’t looking great, and the confluence of bearish signals is something we can’t ignore.
💎PIUSDT has formed a bear flag on the higher timeframe, a classic continuation pattern that suggests further downside. This alone is already a bearish signal, but there’s more.
💎On the lower timeframe, we can see a head & shoulders pattern forming, along with bearish divergence. These factors together significantly increase the probability of a move to the downside.
💎In the case of PIUSDT breakdown and closes candle below the support zone, this will confirm the bearish setup and likely trigger selling pressure. A breakdown at this level would validate both the bear flag and the head & shoulders pattern.
💎If the price bounces from here, the bearish bias still remains, but there’s also a chance that the market is setting a trap within this range. This makes it a high-risk zone, so it’s better to avoid trading here until a clearer move develops.
💎However, If the price breaks and closes candle above the resistance zone, the bearish outlook will be completely invalidated. In that case, it’s smarter to wait for a more defined price action before making any moves.
🎖Patience is key, Paradisers. The market loves to shake out inexperienced traders before the real move happens. Stay disciplined, focus on high-probability setups, and trade like a pro. Only those who truly understand market cycles will capitalize in the end!
MyCryptoParadise
iFeel the success 🌴
CNERGY in a Bullish Flag PatternCnergy is moving and forming bullish flag pattern. Can go for Buy=7.58 or on breach of the flag with a SL =6.9 and TP =12

BYCO-Bullish Flag PatternByco is moving and forming bullish flag pattern. Can go for Buy=7.58 or on breach of the flag with a SL =6.9 and TP =12

Could Cardano Bulls "Raise The Flag" To $2??COINBASE:ADAUSD has some very interesting Price Action happening with the decline starting from beginning of December 2024 forming what looks to be a Descending Channel with the potential to become a Bull Flag!
With a Bull Flag being a Continuation Pattern, we can expect a higher probability of a Bullish Break to this Channel to continue in the trend it was following prior to falling into this Consolidation Period.
Last week we saw a huge Bullish Candle form and Break the Channel after testing the March 2024 Highs, the 200 EMA @ .7719, along with the Linear Regression or "True Trendline" of the Descending Channel.
Other indicators suggest Bullishness as well with the RSI staying above 50 in Bullish Territory and we can see a large amount of Volume entering this Weekly Candle with 2 days and 19 hours left until Close at the time of publishing.
*If Cardano can continue to find Support and is able to make a Valid Bullish Break of this Channel, based off the "Flagpole" or Rally, prior to price falling into Consolidation, we can expect a potential 120% gain from the Break, potentially sending price up to test the overhead Resistance Zone in the ( $1.85 - $2.15 ) Range!
3/7 - The White House will be holding the very first U.S. Crypto Summit to make plans to start bringing cryptocurrency into a U.S. Crypto Strategic Reserve
www.tradingview.com

When you're Dancing on the ceiling; Short then LongWe recently broke-out of a trading range, to the Upside. Short now for Temporary Profits, or, Wait for the price to follow the grey line I drew in illustrating the likely Anticipated move. Buy long, at-or-near the Pullback (top Dashed line).
Should go (up) Down Upppp!
For your added Confidence, i recommend Waiting for a Bullish Candle After the retest to Pullback Level; you Want to See a Green candle after touching that Dashed line.

Gold (XAUUSD) Breakout Setup – Targeting $3,014Gold is showing strong bullish momentum on the 1H timeframe, forming a breakout structure with a well-defined resistance and support zone.
Key Levels:
📌 Resistance: Around $2,940 (previous rejection zone)
📌 Support: Around $2,900 (previous consolidation zone)
📌 Target: $3,014 (+3.16% move)
Technical Analysis:
🔹 Gold recently broke out of a bullish flag pattern after a strong uptrend.
🔹 Price successfully retested the support zone and is now pushing higher.
🔹 A breakout above $2,940 could trigger a sharp rally towards the $3,014 target.
🔹 Volume confirmation and strong momentum support further upside potential.
Trade Plan:
✅ Long above $2,940 with a target of $3,014
❌ Stop-loss below $2,900 to protect against fake breakouts
Gold remains bullish, and if the price holds above the breakout zone, we could see a strong move higher! 🚀

Royal Caribbean Hovers Near GapRoyal Caribbean hit an all-time high four weeks ago, but it’s been sliding since.
The first pattern on today’s chart is the series of lower highs since January 31. Notice how each followed a tepid uptrend that failed to hold. The last may be viewed as a bearish flag within the context of a new short-term downtrend.
Speaking of short-term downtrends, the 8-day exponential moving average (EMA) is below the 21-day EMA. MACD is also falling. Those patterns may reflect a bearish direction.
Third, prices tried and failed to hold the rising 50-day simple moving average. That may suggest its intermediate-term trend is negative.
Next, earnings lifted RCL on January 28 but the rally didn't hold. Are investors abandoning ship on the fundamental story?
Finally, the cruise ship operator jumped above $220 on November 6 after the election. That could make traders look for prices to test that gap.
TradeStation has, for decades, advanced the trading industry, providing access to stocks, options and futures. If you're born to trade, we could be for you. See our Overview for more.
Past performance, whether actual or indicated by historical tests of strategies, is no guarantee of future performance or success. There is a possibility that you may sustain a loss equal to or greater than your entire investment regardless of which asset class you trade (equities, options or futures); therefore, you should not invest or risk money that you cannot afford to lose. Online trading is not suitable for all investors. View the document titled Characteristics and Risks of Standardized Options at www.TradeStation.com . Before trading any asset class, customers must read the relevant risk disclosure statements on www.TradeStation.com . System access and trade placement and execution may be delayed or fail due to market volatility and volume, quote delays, system and software errors, Internet traffic, outages and other factors.
Securities and futures trading is offered to self-directed customers by TradeStation Securities, Inc., a broker-dealer registered with the Securities and Exchange Commission and a futures commission merchant licensed with the Commodity Futures Trading Commission). TradeStation Securities is a member of the Financial Industry Regulatory Authority, the National Futures Association, and a number of exchanges.
TradeStation Securities, Inc. and TradeStation Technologies, Inc. are each wholly owned subsidiaries of TradeStation Group, Inc., both operating, and providing products and services, under the TradeStation brand and trademark. When applying for, or purchasing, accounts, subscriptions, products and services, it is important that you know which company you will be dealing with. Visit www.TradeStation.com for further important information explaining what this means.

Schlumberger Has Been SlidingSchlumberger has been sliding for more than a year, and some traders may see further downside risk.
The first pattern on today’s chart is the series of higher lows between mid-December and early January. The oilfield-services company dipped below the line in late January and spent all of February below it. That may be viewed as a bear flag breakdown.
Second, SLB made a higher daily high in a failed rally on Monday. But then it crossed below Friday’s low. The resulting bearish engulfing candle may suggest that sellers remain in control.
Third, the 50-day simple moving average (SMA) is below the 100-day SMA. Both are under the 200-day SMA. Such a configuration is potentially consistent with bearishness over the longer run.
Flipping to the short run, traders may also see bearish patterns: The 8-day exponential moving average (EMA) has crossed below the 21-day EMA and MACD has been falling.
TradeStation has, for decades, advanced the trading industry, providing access to stocks, options and futures. If you're born to trade, we could be for you. See our Overview for more.
Past performance, whether actual or indicated by historical tests of strategies, is no guarantee of future performance or success. There is a possibility that you may sustain a loss equal to or greater than your entire investment regardless of which asset class you trade (equities, options or futures); therefore, you should not invest or risk money that you cannot afford to lose. Online trading is not suitable for all investors. View the document titled Characteristics and Risks of Standardized Options at www.TradeStation.com . Before trading any asset class, customers must read the relevant risk disclosure statements on www.TradeStation.com . System access and trade placement and execution may be delayed or fail due to market volatility and volume, quote delays, system and software errors, Internet traffic, outages and other factors.
Securities and futures trading is offered to self-directed customers by TradeStation Securities, Inc., a broker-dealer registered with the Securities and Exchange Commission and a futures commission merchant licensed with the Commodity Futures Trading Commission). TradeStation Securities is a member of the Financial Industry Regulatory Authority, the National Futures Association, and a number of exchanges.
TradeStation Securities, Inc. and TradeStation Technologies, Inc. are each wholly owned subsidiaries of TradeStation Group, Inc., both operating, and providing products and services, under the TradeStation brand and trademark. When applying for, or purchasing, accounts, subscriptions, products and services, it is important that you know which company you will be dealing with. Visit www.TradeStation.com for further important information explaining what this means.

EURGBP new bearish?
OANDA:EURGBP we are have strong bearish push, currently we can see BEARIS HFLAG patter and zone is in BF, bouth are breaked, +price is bounce few times on strong sup zone 0.83600, here still higher bearish expecting.
SUP zone: 0.83600
RES zone: 0.82500, 0.82300

AUDJPY: Trend Following Pattern 🇦🇺🇯🇵
I see a nice bearish flag on AUDJPY on a 4H time frame.
Bearish breakout of its support is a strong trend-following signal.
The pair is going to reach 92.0 level soon.
❤️Please, support my work with like, thank you!❤️
I am part of Trade Nation's Influencer program and receive a monthly fee for using their TradingView charts in my analysis.

BTC Forecast Until March 25, 2025The wave is expected to end on March 25. After that, there will be another breakout downwards. In the period up to March 25, there will be consolidation in the form of a flag
