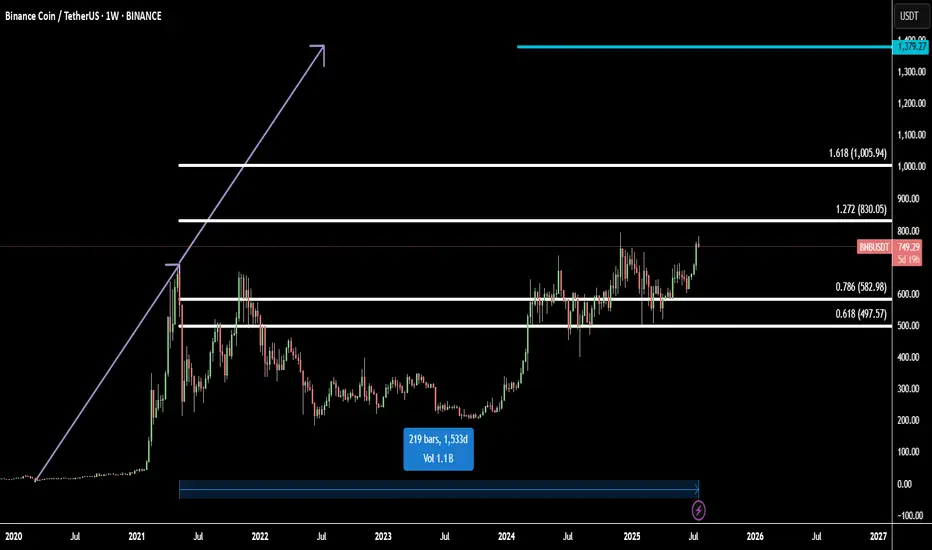
BNB Ready for All-Time High: Fibonacci + 1533-Day FlagBinance Coin (BNBUSD) is setting up for a major breakout, approaching its all-time high with strong momentum.
Technically, BNB has completed a 1533-day flag accumulation — a rare, long-term fractal consolidation that often precedes explosive moves. This massive base acts as a launchpad for the next bullish leg.
Using Fibonacci extensions, we identify two major upside targets:
Target 1: 1.272 Fib – 830.05 - the first resistance and profit zone
Target 2: 1.618 Fib – 1005.94 - key bullish extension from breakout range
Final Target: 1379.27
The final target is projected using fractal symmetry from previous bullish expansions, aligning with the broader market cycle and BNB’s historical price action.
This setup suggests a high-probability move toward new all-time highs and beyond, supported by strong technical structure and breakout energy.
Flag
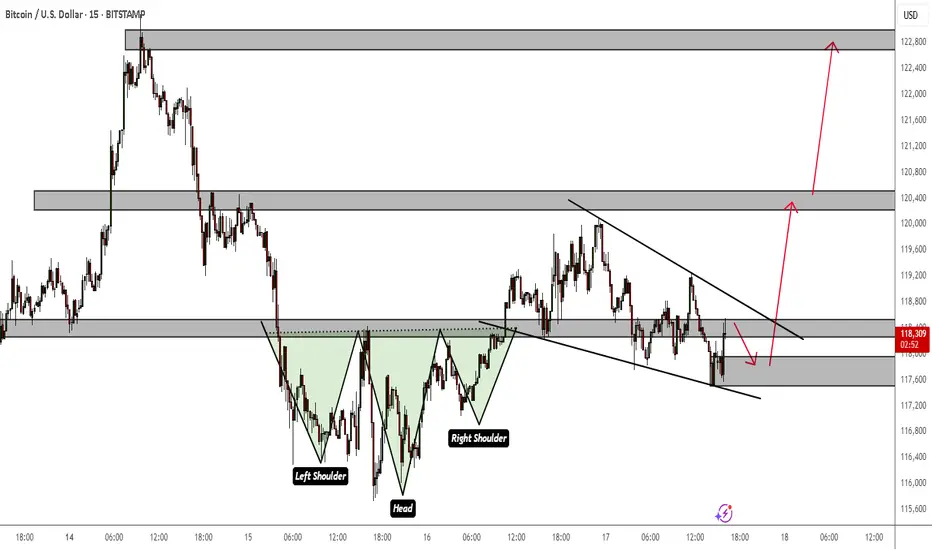
Bitcoin Breakout Bonanza - Ride the Wave, BroYo, check this Bitcoin chart, fam! We’re sittin’ at 107,725, and it’s lookin’ like a wild ride. That break above 127,725 is screamin’ bullish—time to ride the blue arrow up! But watch out, a drop below could send us crashin’ to 107,475 with that red arrow vibe. Stay sharp, dude!

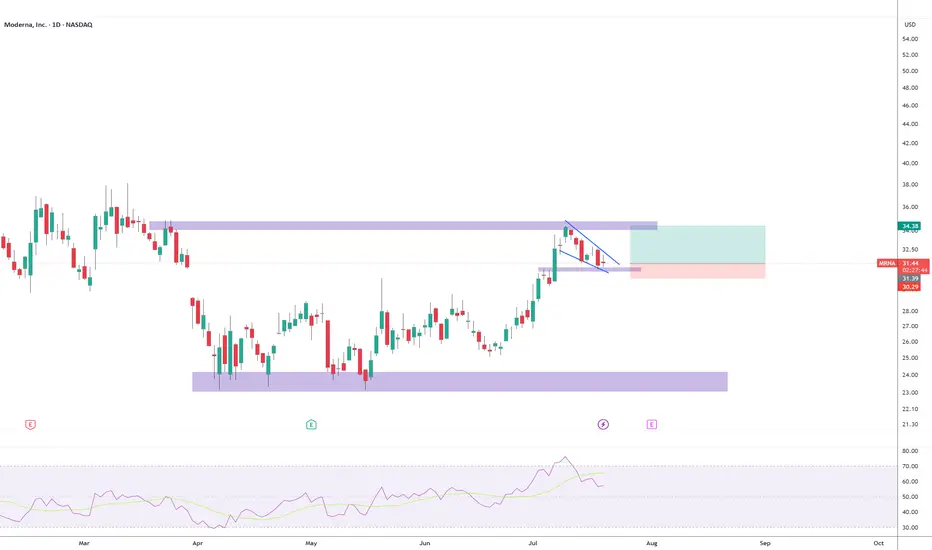
Retest comingBullish flag forming to test the ~$35 resistance again. Earnings coming up on 08/01. I expect the flag breakout before earnings. I have calls exp 08/01 strike 31.5. SL triggers if a daily candle breaks down the support area and closes below 30.30.
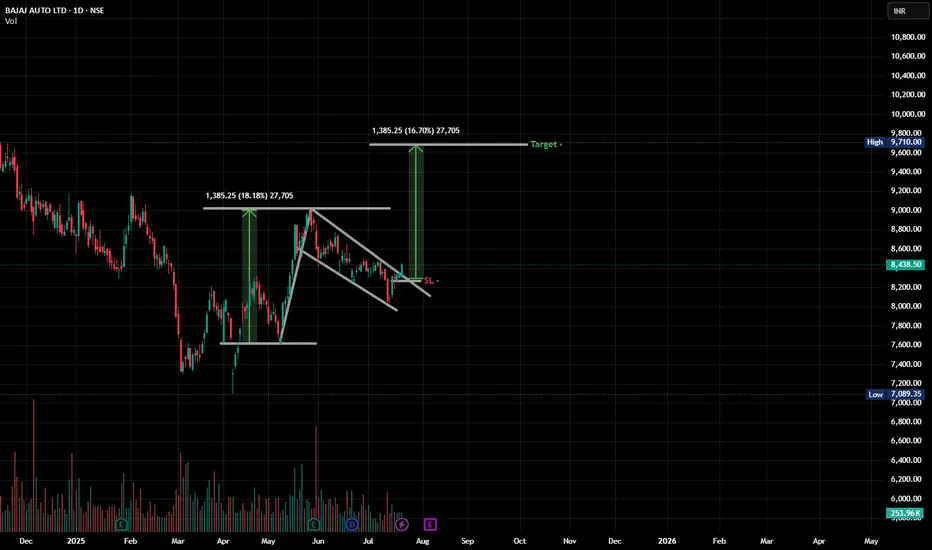
Ohohoho Pole and flag i see there!NSE:BAJAJ_AUTO Just did a noice breakout of a pole and flag there. minimal SL and a good enough target. 9020 may be a resistance
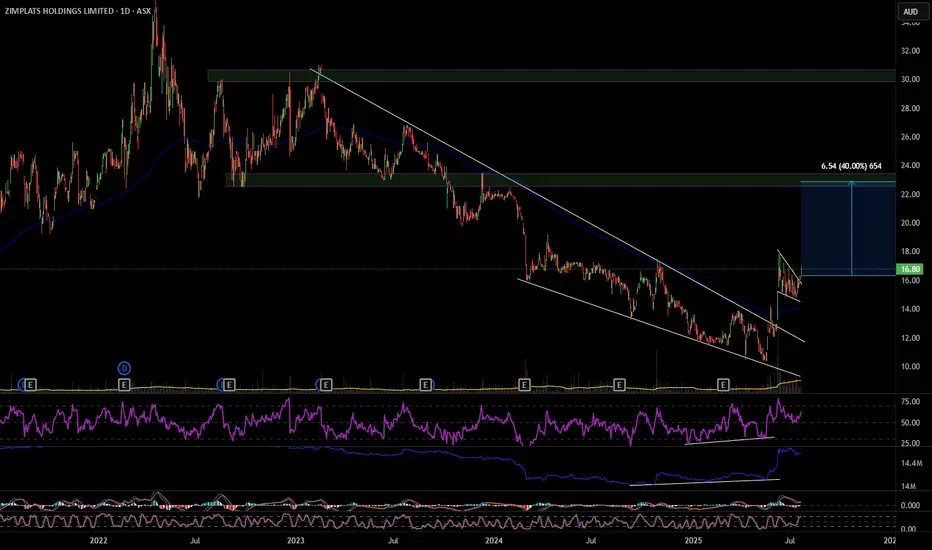
ZIM 40% move up
ZIM has broken out of a descending wedge with bullish RSI and OBV divergence, also multiple divergences on smaller time frames. On the hourly it's had a pull back and formed a bull flag that it has also broken out of. ZIM looks to have formed a change of structure forming higher highs and higher lows, my first target will be $22.90 a move of 40%. Definitely one to consider. Good luck and happy trading 🍀
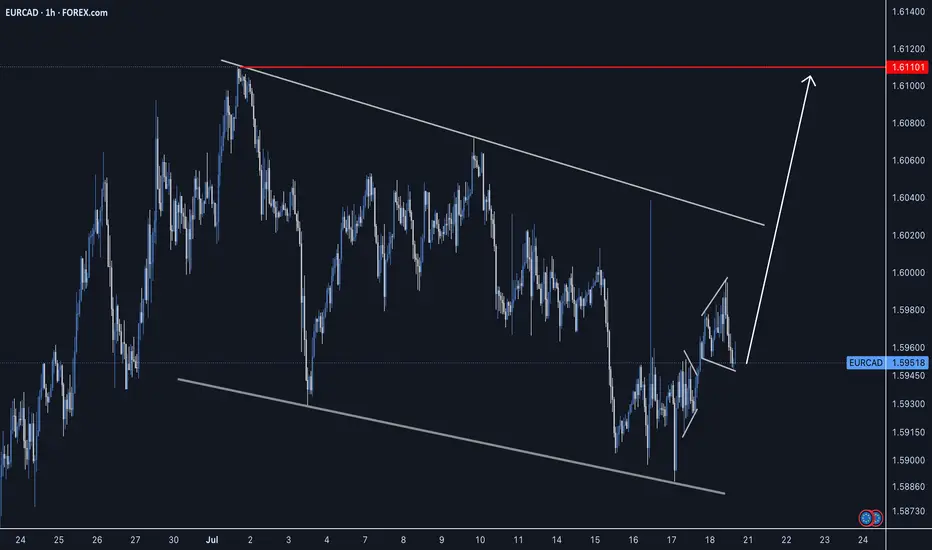
EURCAD - Long Setup - Impulse, Correction, ImpulsePrice action has been setting up for the next impulse phase as we can the bullish continuation is completing to indicate price has further growth. Looking for a long entry this upcoming week.
Good Luck
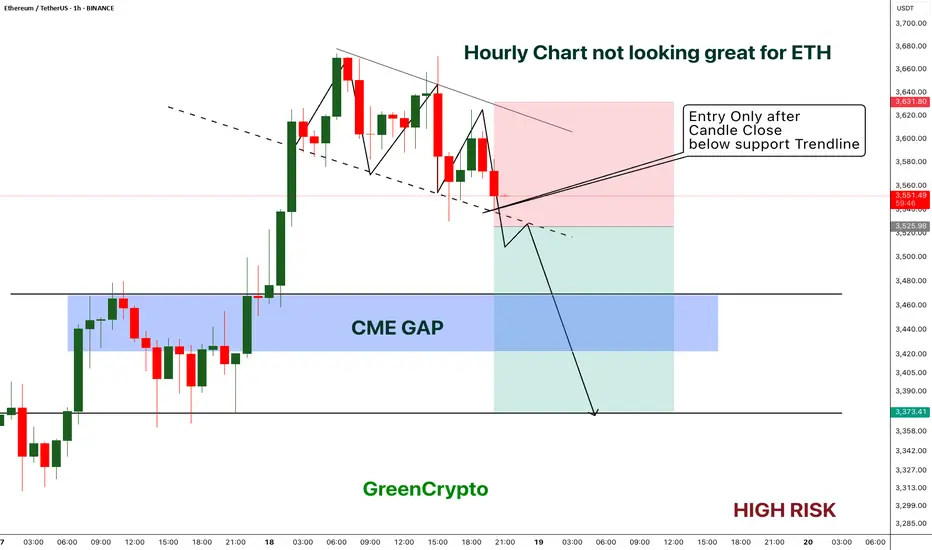
ETH - Short Trade with HIGH RISK- ETH got reject from resistance multiple times on 1H timeframe and now the price is playing near the support.
- I'm expecting overall market to cooldown this weekend, this could push the ETH to break the support
- ETH has CME gap around 3422 - 3467 range, im expecting this CME gap to be filled soon.
Entry Price: Below 3525
Stop Loss: 3631
TP1: 3471.15
TP2: 3381.76
Move SL to breakeven on TP1 hit.
Don't forget to keep stoploss.
Cheers
GreenCrypto
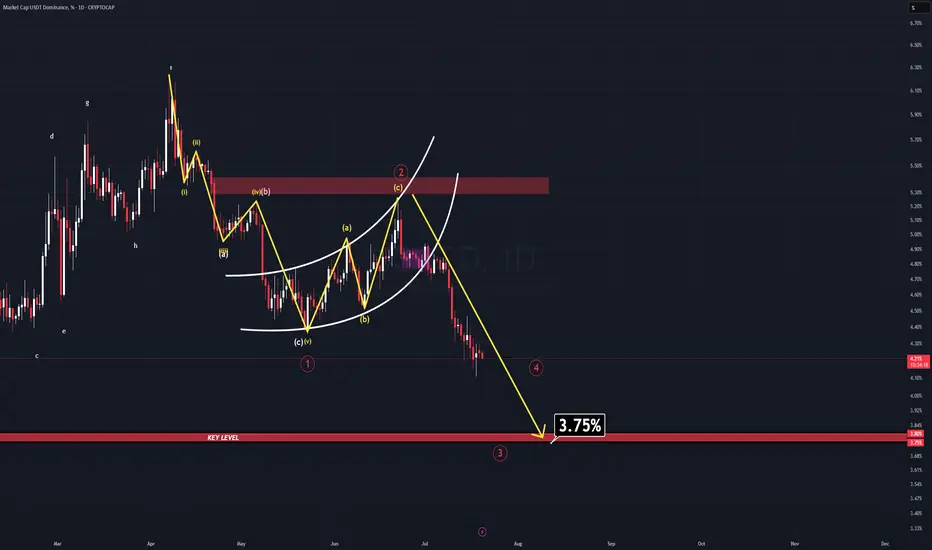
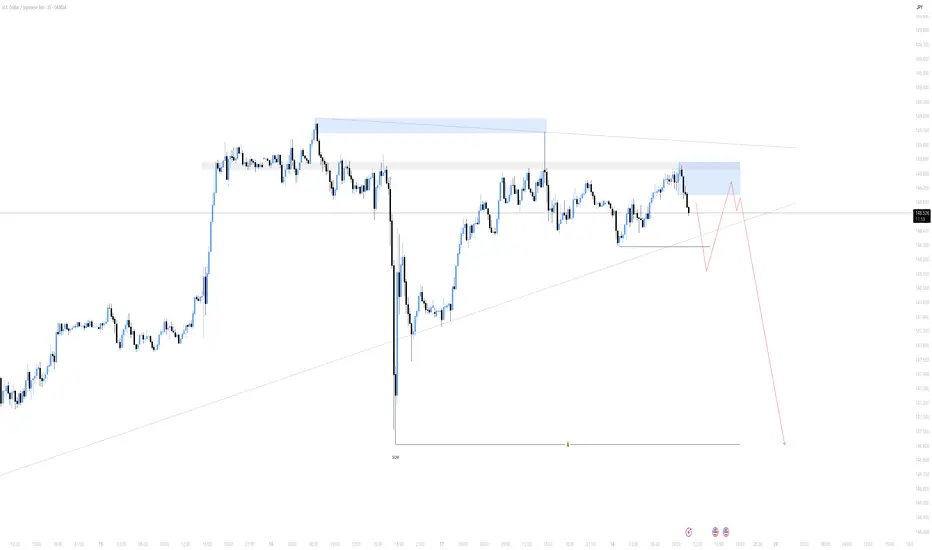
USDT DOMINANCE NEW UPDATE (1D)In a previous analysis, I mentioned that the long-term outlook for this parameter (USDT.D) remains extremely bearish. At the time, a bear flag was clearly visible—but it hadn’t been broken yet.
Well, now it has.
The breakdown confirms the bearish continuation, and there’s still more room to fall. As USDT.D continues to descend towards the projected target for Wave 3, we are likely to see a new All-Time High in Bitcoin, accompanied by a strong rally in many altcoins.
The main target for Wave 3 sits at 3.75%—a historically critical level. For years, USDT.D has never fallen below this zone, making it an extremely strong support area.
⚠️ Reminder: Consider taking profits when USDT.D approaches the 3.80–3.75% region. A reversal or temporary bounce is highly likely there.
GBPJPYStrong daily resistance breakout, consolidated for almost 2 weeks and formed a bullish flag on the H4. Lets see what price does this week.

BTC/USD Fake out before Pump | Bullish Flag formationBTC/USDT (1D) Market Outlook – July 1, 2025
Introduction
BTC is currently consolidating within a bullish flag pattern after printing a swing high at 108.9K and a recent swing low at 98K. The price sits just below a major supply zone.
Context 1: Key Zones
Supply: 104.6K – 112.1K
Demand: 74.4K – 82.5K
Fair Value Gaps (FVG): 3 zones below price, with one near 88–90K
Context 2: Technical Confluence
Liquidation Zone: 106.2K
Golden Pocket (Fib 0.618): 102.1K
Psychological Levels: 105K and 110K
Context 3: Market Structure
Pattern: Bullish flag
Trend (LTF): Sideways/consolidation
Volume Profile: Heavy activity near 105K–110K
Bullish Scenario
Breaks above 106.2K (liq zone)
Pulls back to 102.1K (golden pocket), forms higher low
Retests resistance for continuation
Alt scenario: clean breakout above resistance → ATH retest
Bearish Scenario
Breaks below 106.2K and flag support
Fills FVG, breaks prior low at 98K
Triggers macro downtrend toward 88–90K zone
Summary
BTC is at a decision point inside a bullish flag, facing supply. A break above 106.2K favors upside continuation, while rejection and a lower low could trigger a deeper retracement. Watch key levels closely.

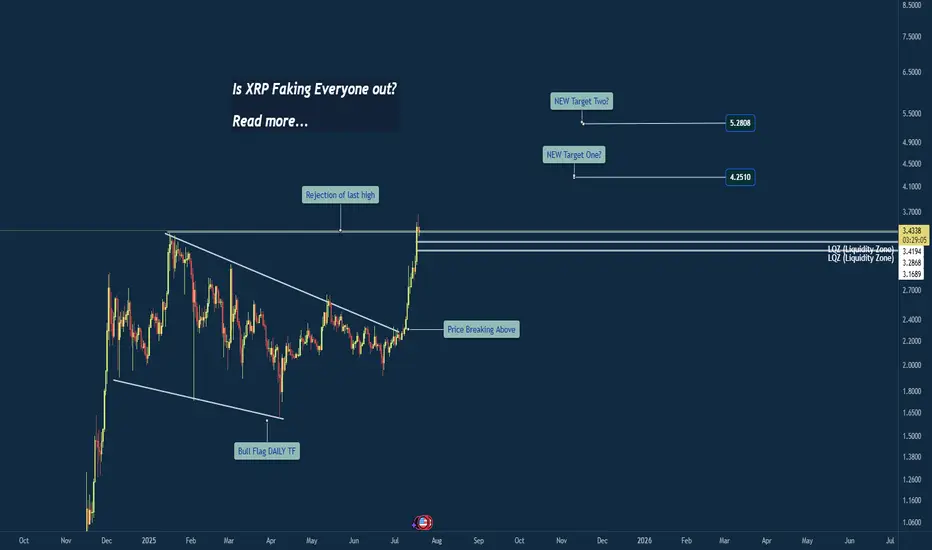
Breakout or Bull Trap? XRP at Critical Weekly LevelWeekly Chart Insight: XRP Closing Above Previous High
XRP has just closed above its previous weekly high—a significant development that could signal a shift in market sentiment. Historically, when price closes above such a critical level on the weekly timeframe, it often leads to continuation, unless a sharp rejection quickly follows.
At this stage, the focus shifts to the 4-hour timeframe for confirmation. An impulsive move above the current consolidation zone could indicate that this breakout is legitimate, potentially leading to another bullish weekly candle.
However, caution is warranted. If the next two daily candles close weakly or fail to maintain structure above the breakout level, it could hint at a fakeout or liquidity grab before a deeper correction.
My Current Bias:
I remain neutral-to-bullish, contingent on:
An impulsive continuation on the 4HR
Strong daily closes above the key range
Price not falling back and closing below the weekly breakout level
If price begins to consolidate and hold this level, that would reinforce the bullish case. But if we see immediate selling pressure and a re-entrance below the breakout, I’ll reconsider the bias based on developing structure.
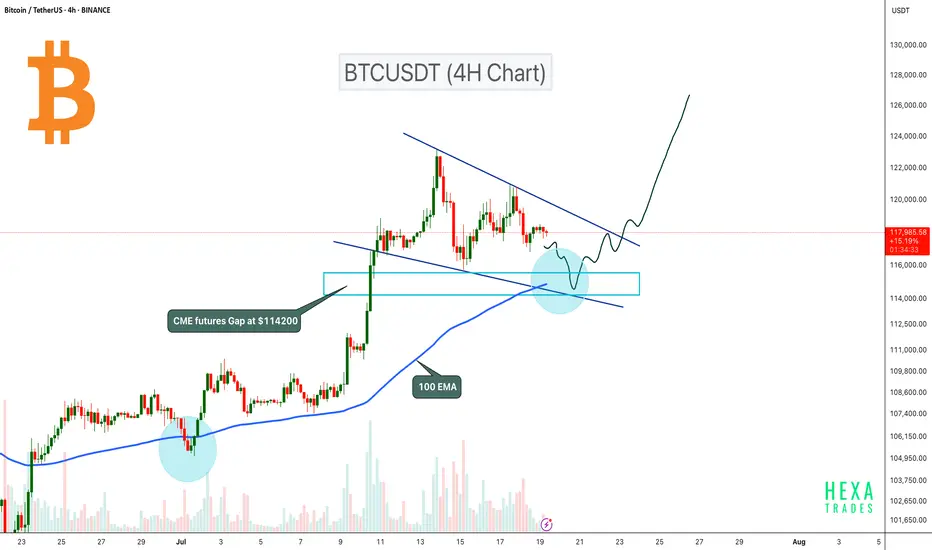
BTC Pullback Expected to $114K Before Next Leg Up!Bitcoin is currently consolidating inside a bullish flag pattern on the 4H timeframe. The price could retest the flag support, where the 100 EMA will act as dynamic support. Additionally, there is a CME futures gap at the $114,200 level, which also aligns with the 0.5 Fibonacci retracement level. Therefore, a retest to the $114,200 zone is likely before the next potential upward move.
A potential bullish reversal could occur if BTC retests this zone and confirms a bounce. A breakout from the bullish flag pattern could signal the next leg up.
Cheers
Hexa🧘♀️
BITSTAMP:BTCUSD CRYPTOCAP:BTC
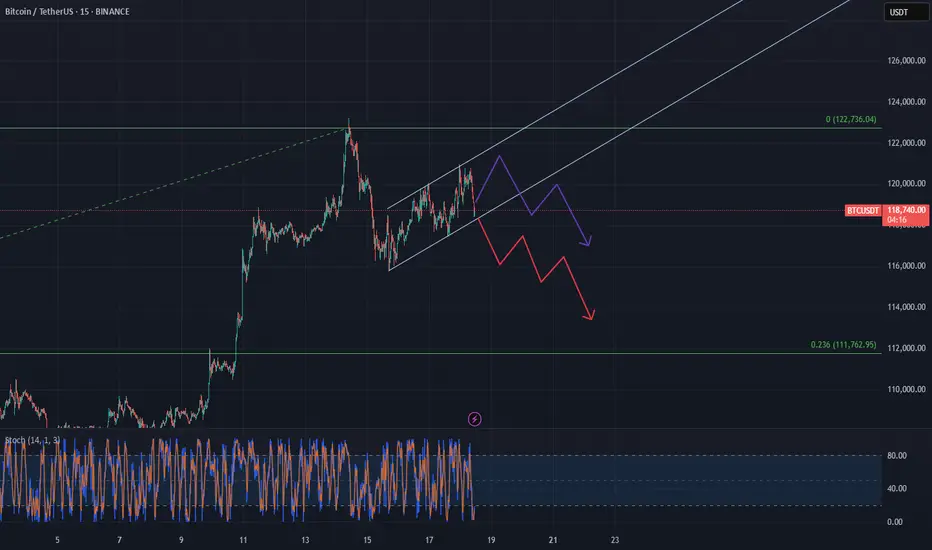
BTC consolidating a short term bearish channelBTC is moving inside a short-term bearish channel right now, even though the bigger trend is still upward. It looks like it's just consolidating for the time being, bouncing between the top and bottom of the channel.
But if it breaks below that lower trendline, we could see a pretty sharp move down—possibly all the way to around $112K , which lines up with the Fibonacci retracement from the last rally. That zone could act as a support.
It might hang out in this range a little longer, but once it breaks down, it’s probably heading toward that level.
TSLA ULLISH JULY 18 2025Tsla is lloling extremely bullish technically. If it stops me out ,il exit but my my targets from here would be $390.
Always put a SL & decide a target before your entry

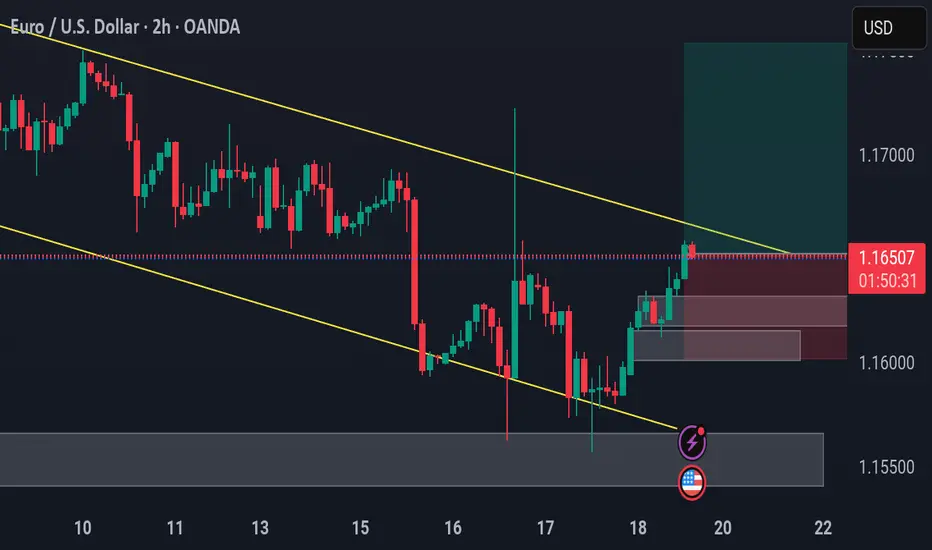
EURUSD Breakout Trade EUR/USD – Breakout Confirmation
🔹 Multi-Timeframe Bullish Setup by PULSETRADESFX
EUR/USD is showing a strong bullish shift after breaking out of a well-defined descending channel. Price reacted perfectly from the demand zone and is now pushing above descending trendline resistance across the 2H chart.
This signals early signs of trend reversal, backed by confluence across intraday and higher timeframes.
The structure is clean, the R:R is healthy, and momentum favors bulls after multiple rejections at key support.
---
✅ Confluences Supporting the Long:
Descending channel breakout (2H )
Triple demand zone rejection
Break and close above minor resistance
Clean bullish momentum candle
Economic catalysts ahead (watch USD data releases 📅)
📅 July 18, 2025
📊 FOREX.com | EUR/USD (2H)
#EURUSD #Forex #BreakoutTrade #BullishSetup #TechnicalAnalysis #TradingView #PULSETRADESFX
GBP/USD – Breakout Confirmation Across TimeframesGBP/USD – Breakout Confirmation Across Timeframes
🔹 Multi-Timeframe Bullish Setup by PULSETRADESFX
GBP/USD is showing a strong bullish shift after breaking out of a well-defined descending channel. Price reacted perfectly from the 1.33400–1.34060 demand zone and is now pushing above descending trendline resistance across the 2H and 4H charts.
This signals early signs of trend reversal, backed by confluence across intraday and higher timeframes.
📌 Trade Setup Details:
Entry: 1.34530 – 1.34550
SL: 1.34060 (Below demand)
TP: 1.35724 – 1.36000 (Upper supply zone / channel target)
The structure is clean, the R:R is healthy, and momentum favors bulls after multiple rejections at key support.
---
✅ Confluences Supporting the Long:
Descending channel breakout (2H & 4H)
Triple demand zone rejection
Break and close above minor resistance
Clean bullish momentum candle
Economic catalysts ahead (watch USD data releases 📅)
📅 July 18, 2025
📊 FOREX.com | GBP/USD (4H, 2H)
#GBPUSD #Forex #BreakoutTrade #BullishSetup #TechnicalAnalysis #TradingView #PULSETRADESFX

UJ shortsThe dollar is looking weak, I expect UJ to fall as well.
UJ showed some strong weakness last Wednesday following the drop in price of the dollar.
Looks like supply is in control atm, I would like to see price breaking the newest low to confirm the bearishness on UJ.
When it does, I'll start looking for new short opportunities when price mitigates the current move.
Dow Eyes 45000 After Bullish BreakoutThe U.S. 30 contract has broken topside from a short-term bull flag, reinforcing the broader uptrend and putting 45000 resistance back in focus.
Traders looking to play a continuation can consider longs with a tight stop beneath for protection. A break of 45000 may trigger a fresh burst of upside momentum, putting big figures above in play.
Bullish price momentum is also building again, adding to the case for upside.
Good luck!
DS

Anand Rathi in BULLISH FLAG What more to explain about the beauty of the Ch(art)
- P Senthil Kumar
Chart Lover

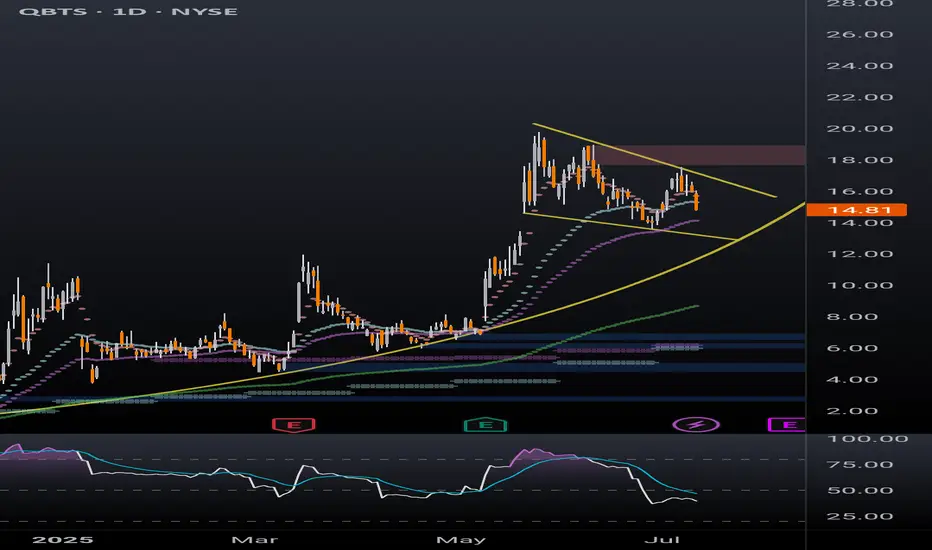
QBTS bull flag dailyBetter look at quantum computing ticker QBTS bull flag on the daily timeframe. Previous post looked at the weekly timeframe to highlight the bullish momentum. Lots of retail money piled into this one in the last few months, a breakout of this bull flag will likely be followed by a parabolic move.
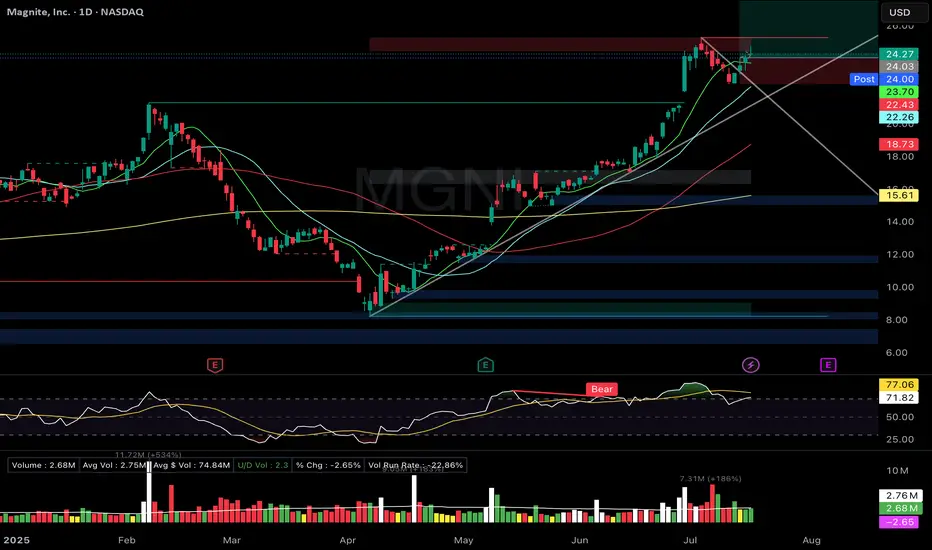
MGNI- Flag breakout. Long upper wick → cooling expectedMGNI – Magnite Inc.
Setup Grade: B+
• Entry: $24.03 (7/17)
• Status: Active
• Stop: $22.43
• Setup: Flag breakout. Long upper wick → cooling expected. RSI ~71.8 (overbought). ATH = $25.27.
• Plan: Hold unless stop breaks. Let RSI cool, watch for continuation.
• Earnings: August 6
HON Bull flag + hammer off 21EMAHON – Honeywell
Setup Grade: A
• Entry: $238.12 (7/17)
• Status: Active
• Trailing Stop: $6.85 (2x ATR)
• Setup: Aerospace/defense leader. Bull flag + hammer off 21EMA. RSI ~63.
• Target: $256 (measured move). ATH = $242.77
• Plan: Hold through breakout → blue sky setup.
• Earnings: July 24

BTCUSD Bullish Continuation Patterns on LTFThe trend is still bullish and the daily bull flag I posted is still at play. This is just a lower TF perspective within the bigger overacharching view.
Inverse head and shoulders and a bullish flag all indicate continuation to the upside. You can use market structure to confirm your entries and your target profit zones if you do not plan on holding until $150k