SBIN , 1W , Bullish As the Pattern is Formed and given Breakout , enter after strong candle close in weekly Timeframe and put SL below Swing low . follow proper risk management
follow for more swing ideas like this
Flag

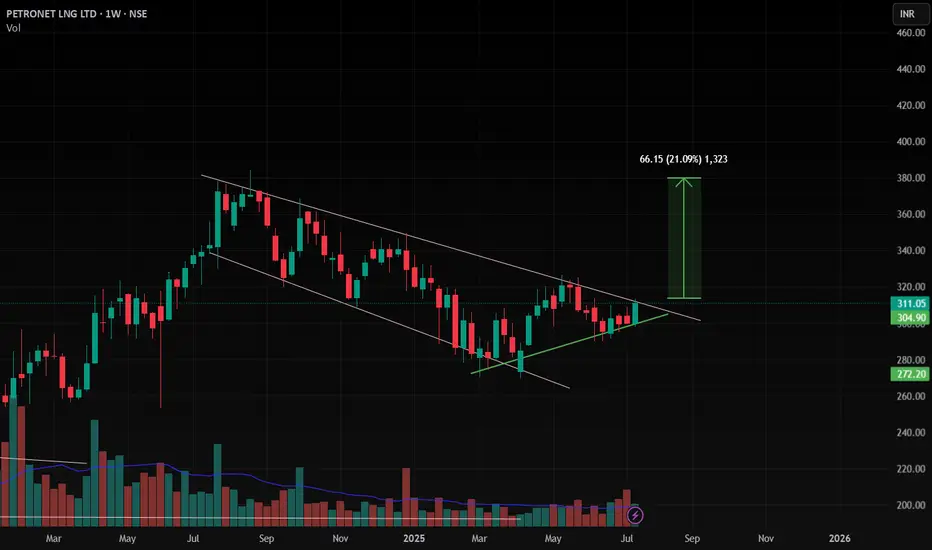
Petronet , 1W , BullishAs the Pattern is Formed and Ready for Breakout , enter after strong candle close in weekly Timeframe and put SL below Swing low . follow proper risk management
follow for more swing ideas like this
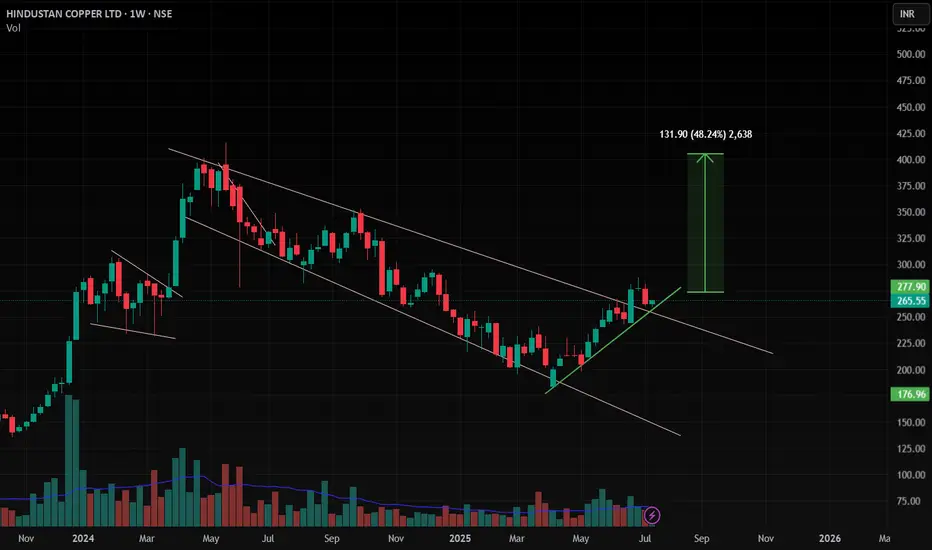
HINDCOPPER , 1W , Bullishthe Pattern is already broken out and now it is at Retest point wait patiently for strong close in weekly . then enter with proper risk management , keep SL below its Swing Low
Follow for more Swing ideas like this
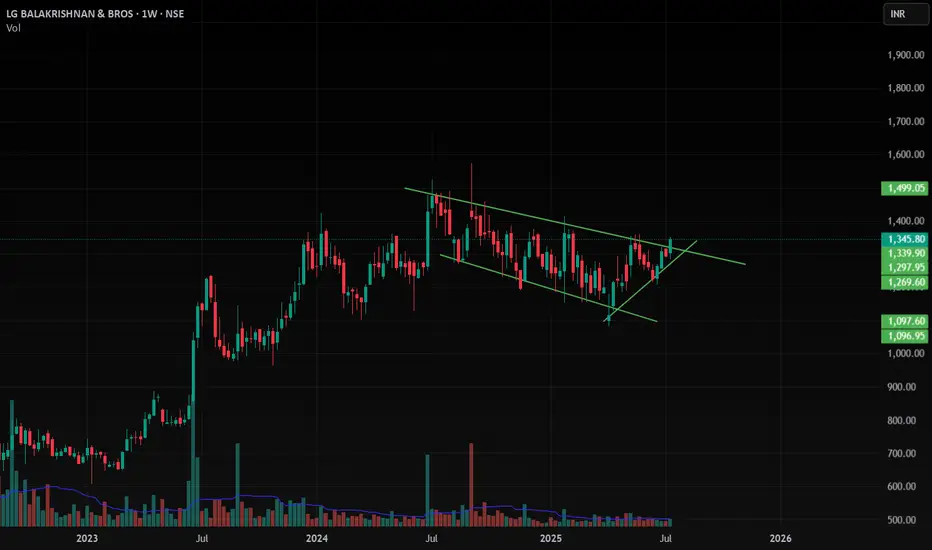
LGBBROSLTD , 1W , Bullish NSE:LGBBROSLTD as the channel pattern is Broken , wait for proper Close in Weekly then enter with proper risk management ,
put SL below its swing low
Follow for more swing ideas like this
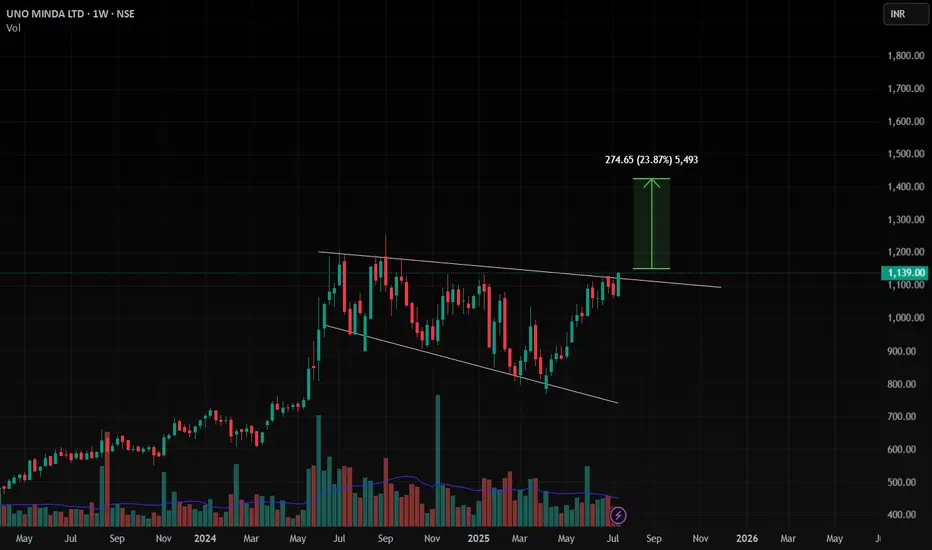
UNOMINDA , 1W , Bullish The pattern is channel , it is ready to Breakout , Enter after only clear confirmation in weekly strong close then enter , follow proper position sizing and risk management
follow for more swing Ideas like this
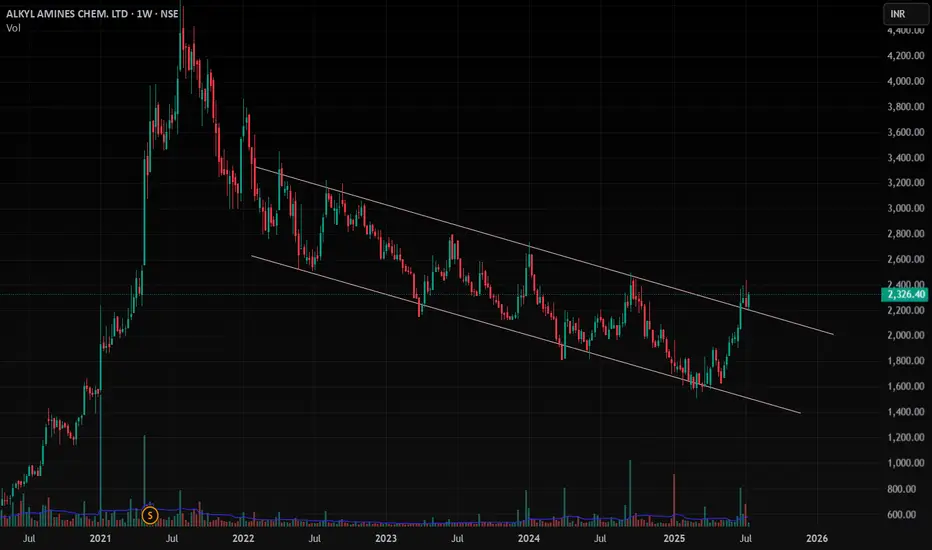
ALKYLAMINE , 1W , Bullishas this stock is given good breakout and now it is at Retest Point and You can enter with Good position Size with very minimal Risk
put the SL below the Swing Low . Take risk according to your position size
Follow for More Swing Ideas Like this
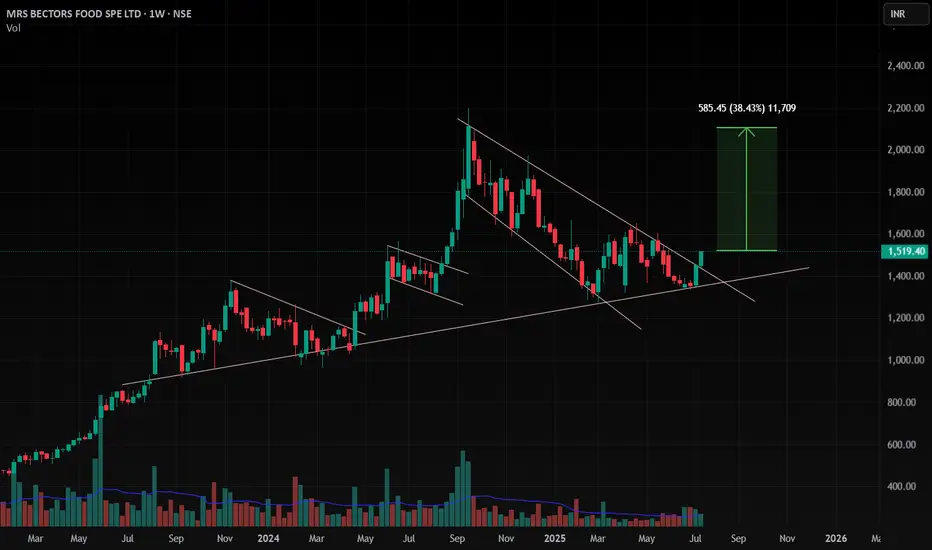
BECTORFOOD , 1W , Bullish As the trendline is giving support at below and formed a good pattern and given breakout with good close in weekly and daily .
This stock is ready to enter into this
Follow for more Ideas like this
Weekly/monthly bullflag on xrpusdAn even higher target than the symmetrical triangles two potential targets materializes when we confirm the breakout up from this bull flag. It will likely have a bullish target somewhere around $5.20. Upon reaching this target it will also be breaking above a big cup and handle that will then have an even higher breakout target which I will post in my next idea *not financial advice*

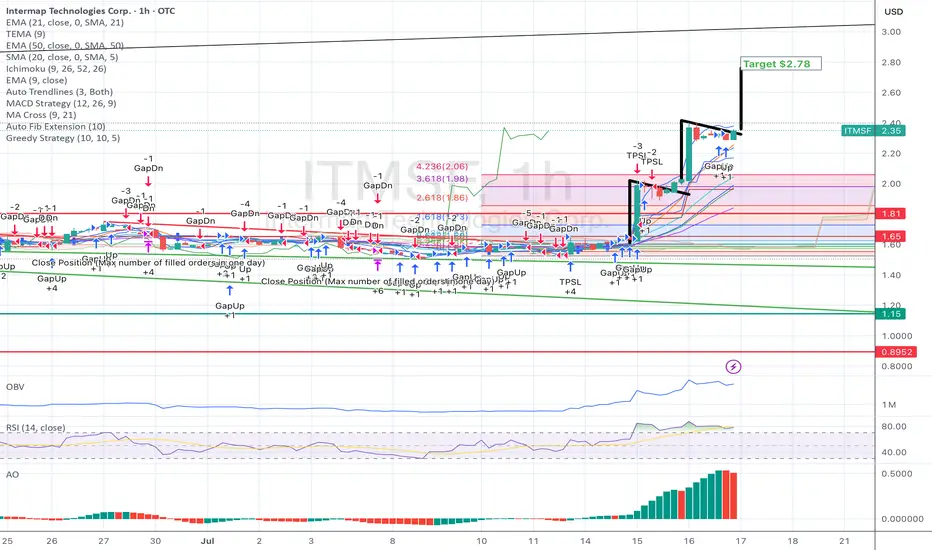
Continuation with exact bull flag for back to back %15 on ITMSF Price discovery is occurring and much more to go to get to $5.... :)
FET - Perfect trade for beginner- FET is breaking out from the flag pattern and we have clear and confirmed breakout
- most of the like flag pattern breakout succeeds, this gives a high confidence trade
Entry Price: 0.775 (current price)
Stop Loss: 0.5307
TP1: 0.9072
TP2: 1.1495
TP3: 1.3791
TP4: 1.7927
TP5: 2.1468
Max Leverage 5x
Don't forget to keep stoploss
Cheers
GreenCrypto

BTC Bull Flag Target Hit Is $150K Now on the Table?Bitcoin continues to deliver with precision. If you’ve been following the structure, this breakout is no surprise. We had a textbook bullish flag setup earlier in the cycle clean pole, sideways consolidation, and a sharp breakout. That initial flag target has now been achieved.
But here’s where it gets interesting: price didn’t just hit the flag projection it shows a good potential for a test towards the projected supply zone just beneath $128K. A short-term rejection here is completely normal and even healthy. The current pullback appears corrective, and the $115K–$111K region (our immediate buy-back zone) remains a critical area to watch for a potential base.
The structure so far has respected its levels cleanly. The pole projection landed almost perfectly, which builds confidence in how this setup is unfolding. A retest of the demand block offers a decent long opportunity, especially with trendline confluence and horizontal support lining up in that zone.
If BTC continues to respect the broader trend and finds strength off this pullback, the path toward $128k, $141K and even $150K remains valid. Those targets are measured extensions based on the original flag pole, and given how price is behaving, they’re not unrealistic.
Momentum is strong, but rallies like this often pause before the next move. I’ll be watching how price behaves if it dips into the demand zone. Clean volume and rejection candles there could offer solid re-entry setups for the next leg higher.
Are you riding this wave, trimming profits, or waiting for the dip reload? Drop your thoughts below. Let’s see how everyone’s navigating this phase.
📌 Follow for more clean, structured setups no hype, just charts.

BTC Possible Short-Term Scenario (Long)Sharing my view on the BTC short-term scenario.
Main idea here is to find confluence of the resistance levels using different technicals.

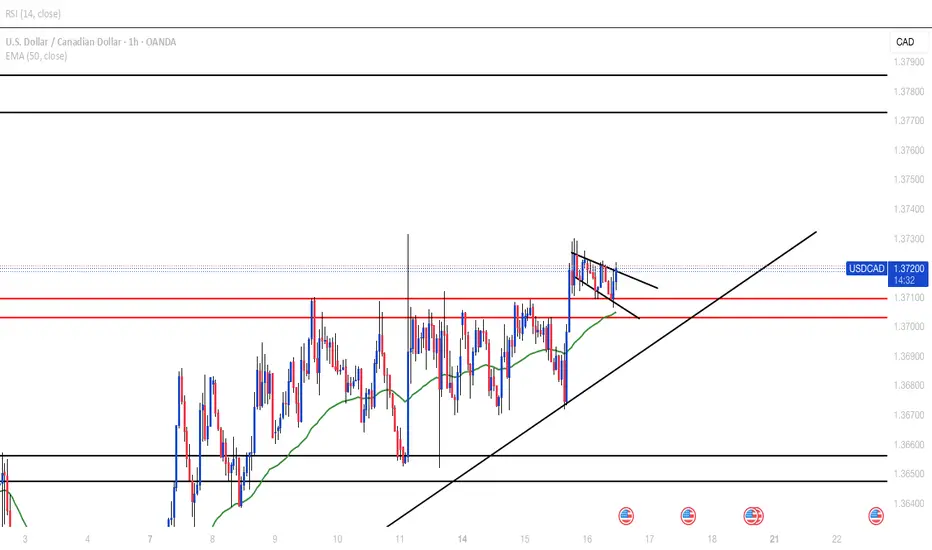
USDCADBroke H1 resistance and price is forming a bullish flag as it retests the zone. Possible movement to next H4 resistance around 1.37700
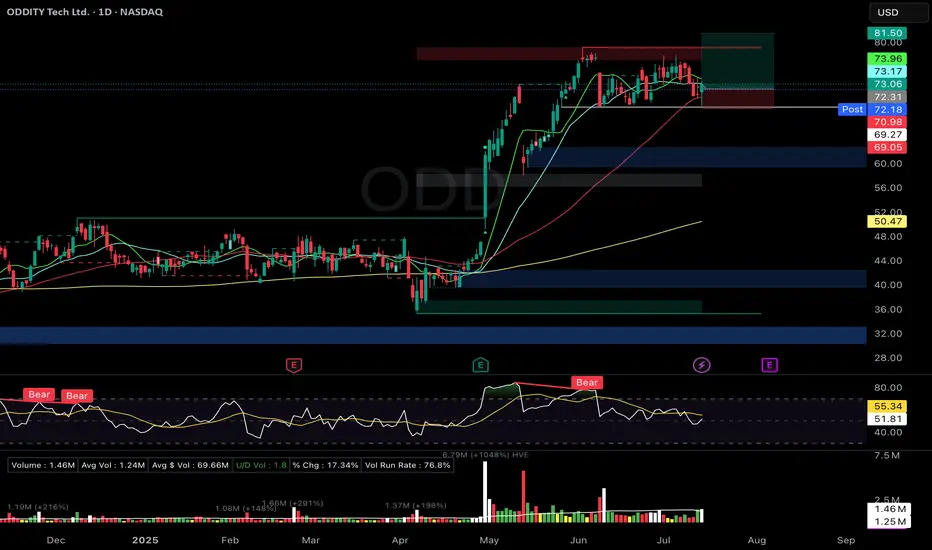
ODD Flat Base (Stage 2) – Support ReversalOddity Tech Ltd. ( NASDAQ:ODD )
🚀 Entry: $72.31
📊 Setup: Flat Base (Stage 2) – Support Reversal
🛑 Stop: $69.05
🎯 Target: $89.50
🔑 Why I Entered:
Solid 6-week flat base (~13% depth) with a bullish hammer candle reversal off the 50-DMA and key support.
Moving averages (10/21/50 DMA) are coiling tightly, indicating a potential breakout.
Strong institutional accumulation signals backed by increasing volume.
Exceptional fundamentals: EPS growth at 79%, RS Rating at 95, Composite at 97 (per IBD).
🎯 What's Next:
Watching for a decisive breakout above the $79.18 pivot on high volume for a potential scale-in.
Earnings due in two weeks—staying vigilant for any unusual volatility ahead of the announcement.
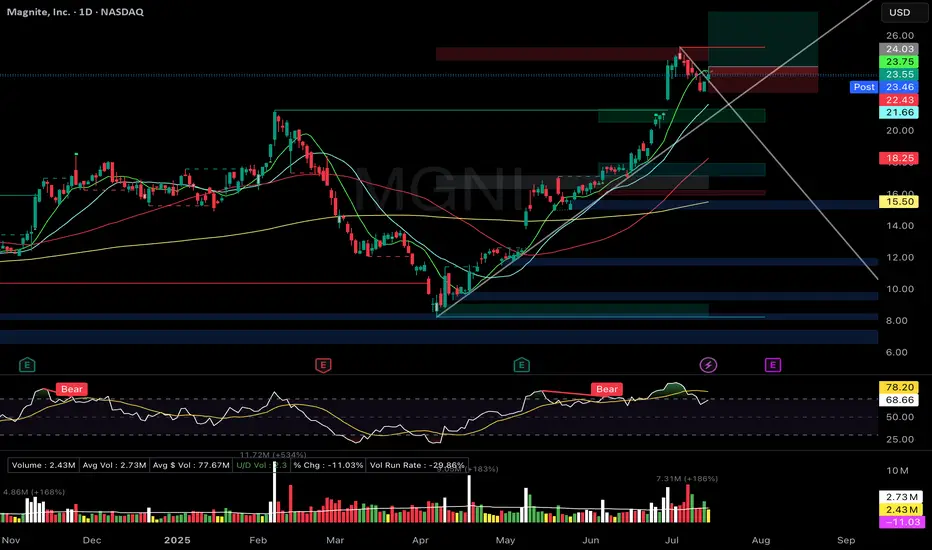
MGNI Zanger-style Bull Flag Breakout PullbackMagnite Inc. (MGNI)
🚀 Entry: $24.03
📊 Setup: Zanger-style Bull Flag Breakout Pullback
🛑 Stop: $22.43
🎯 Target: $27.50
🔑 Why I Entered:
Picture-perfect bull-flag pullback pattern with volume drying significantly, tapping precisely on the rising trendline.
Price action holding strong above rising short-term EMAs (9/21).
Excellent relative strength, reflecting a previous strong-volume breakout move.
🎯 What's Next:
Seeking strong volume surge confirmation to confirm continuation of the breakout.
Earnings report in three weeks—ready to take partial profits if price significantly appreciates ahead of the event.
HUGE BULL FLAG BREAKOUT with Stifel Coverage initiation at $5.Been preaching this for a couple years, but just pour through this chart with amazing fundamentals, Govt contracts, and $200M Indonesian contract... just lovely...

ASTS massive daily bull flagWith the cult like following on this ticker, a 4H break out and hold of this bull flag to the upside could see massive retail money piling in to send the price back to $54 ATH. RSI is also showing potential bullish confluence. The 4H chart has daily EMAs overlayed. The price is currently sitting above the daily 7EMA. Breakout above ATH and it's clear blue skies with no resistance. Huge potential.

SOL / ETH at Critical Inflection PointSOL / ETH loses the 50WMA.
Has been trading below it for the past 7 weeks, something we haven't seen since 2021.
Has also broken down from the 8 month bull flag / parallel channel. Retesting the key POI I've been eyeing.
HOPIUM: We've seen great rallies after CRYPTOCAP:SOL goes down ~40% vs CRYPTOCAP:ETH , which it is at now. We SHOULD see a turnaround here soon.
And I still believe SOL will greatly outperform ETH this cycle, especially when the ETF launches and Alt Season kickstarts.
Right now we're seeing a typical market cycle BTC > ETH > Large Caps > Mid Caps > Micro Caps

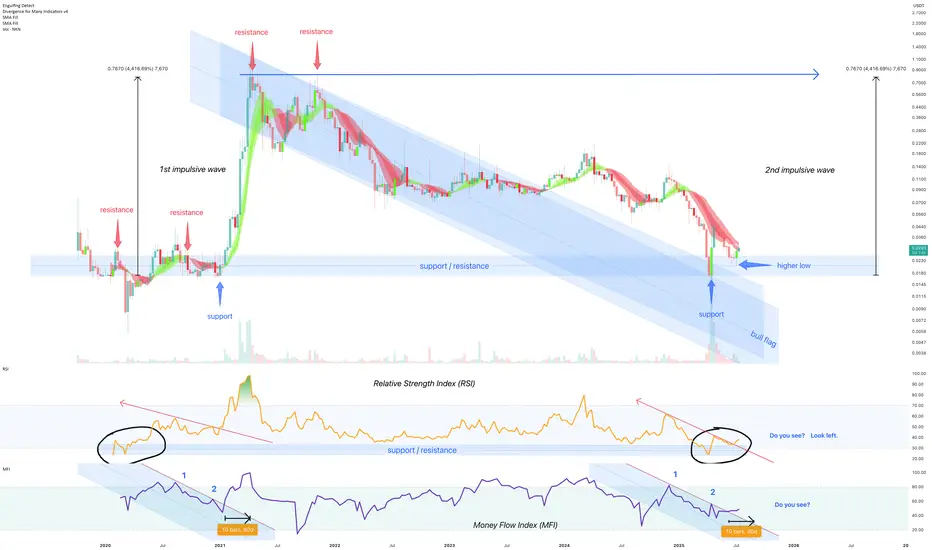
July 2025 - New Kind of Network (NKN) 4000% before October 2025** The months ahead **
On the above 8 day chart price action has corrected 99% since 2021. The chart now displays a compelling technical setup that suggests a strong bullish continuation could be on the horizon.
Bullish Arguments:
Price action forms a clear bull flag pattern
A classic continuation pattern typically appears after a strong upward movement (the "flag pole" or impulsive wave) and is followed by a period of downward consolidation (the "flag"). Albeit the formation rarely prints over such a long period of time for a crypto. The downtrend resistance is now broken with a support confirmation suggesting price action is preparing for another leg up, resuming its prior bullish momentum from 2020.
Strong support confirmation on past resistance
Look left. Historical price zone has proven its significance in the past, acting as both a ceiling and a floor for price movements. The current bounce off past resistance, marked by a higher low, indicates buyers are stepping in at this area. The volume entering the market, collecting emotional seller capitulations, is notable.
Relative Strength Index (RSI) confirms resistance breakout
The Relative Strength Index (RSI) reinforces the bullish outlook. Notice prior to the resistance breakout the index would now print a higher low from the same support area as in 2020.
Money Flow Index (MFI) resistance breakout
The Money Flow Index (MFI) in the lower panel provides excellent confirmation of the bullish sentiment, follow the money! The new money shows a clear pattern of resistance breakout, mirroring previous instances (marked as 1 and 2) where similar money flow preceded to see strong upward moves in price action. This indicates that money is flowing back into the token, for whatever reason I do not know.
Considering the clear bull flag formation, the strong bounce off a critical support/resistance zone, and the confirming signals from RSI and MFI indexes (or indices?!) NKN appears poised for a significant upward continuation.
Is it possible price action continues to print lower lows? Sure.
Is it probable? No.
Ww
GOLD (XAUUSD): Mid-Term Outlook
Analysing a price action on Gold since March,
I see a couple of reliable bullish signals to consider.
As you can see, for the last 4 month, the market is respecting
a rising trend line as a support.
The last 4 Higher Lows are based on that vertical support.
The last test of a trend line triggered a strong bullish reaction.
The price successfully violated a resistance line of a bullish flag pattern,
where the market was correcting for almost a month.
A strong reaction to a trend line and a breakout of a resistance of the flag
provide 2 strong bullish signals.
I think that the market may grow more soon and reach at least 3430 resistance.
An underlined blue area will be a demand zone where buying orders will most likely accumulate.
❤️Please, support my work with like, thank you!❤️

GBPJPY Bullish Breakout IncomingAnother bullish breakout on the H4 TF is pending. The trend has been consistently bullish and confirmations of a continuation are clear.
Wait for that breakout of the bullish pattern and ride the trend.

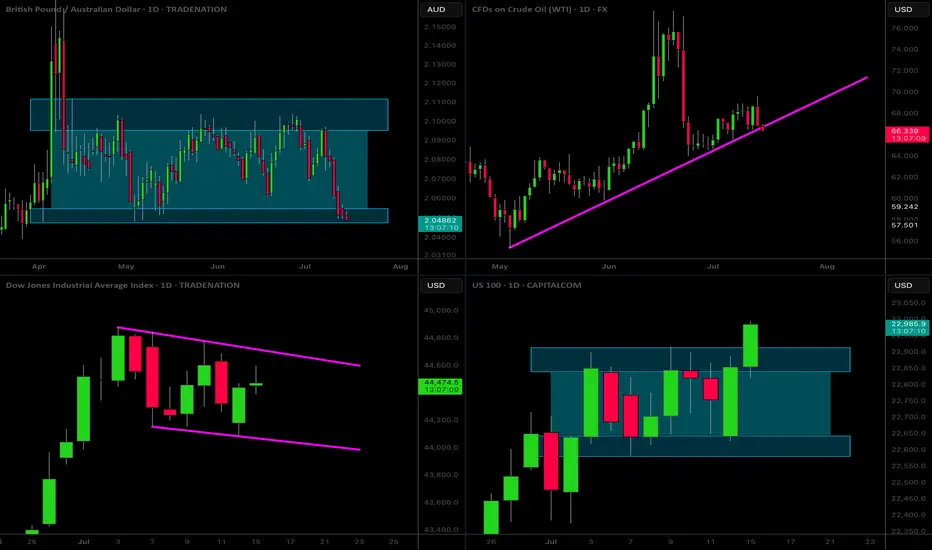
MarketBreakdown | GBPAUD, WTI CRUDE OIL, US30, US100
Here are the updates & outlook for multiple instruments in my watch list.
1️⃣ #GBPAUD daily time frame 🇬🇧🇦🇺
The market is trading within a wide horizontal parallel channel.
The price is stuck on its support.
Probabilities will be high that the market will start growing from that.
Alternatively, its bearish breakout will provide a strong bearish signal.
2️⃣ #WTI CRUDE OIL daily time frame 🛢️
The price is now testing a significant rising trend line.
It is a critical decision moment for the market.
A bearish breakout of that may trigger a strong bearish continuation.
Monitor intraday price action today. If you see a strong bullish pattern,
it will provide a reliable confirmation to buy,
3️⃣ DOW JONES INDEX #US30 daily time frame
The market started a correction movement in
a bullish flag pattern.
Your next signal to buy will be a breakout of its resistance
and a daily candle close above that.
4️⃣ NASDAQ INDEX #US100 daily time frame
The market is now breaking a resistance of a horizontal parallel channel.
IF a today's daily candle closes above that, it will confirm a start of
another bullish wave.
The market will continue growing then.
Do you agree with my market breakdown?
❤️Please, support my work with like, thank you!❤️
I am part of Trade Nation's Influencer program and receive a monthly fee for using their TradingView charts in my analysis.
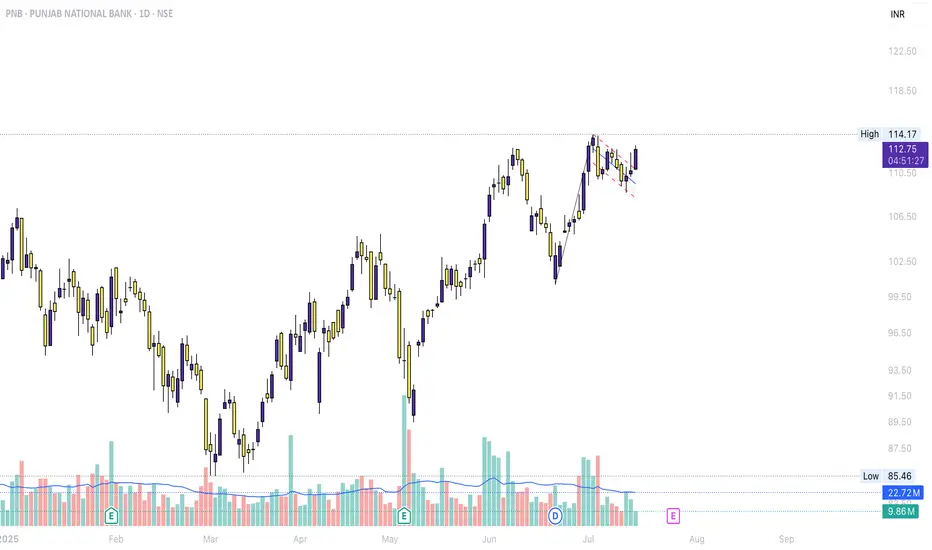
PNB <>BreakoutWith PSU Banks already on fire, PNB also showing breakout after forming Flag n Pole
Keeping it ion radar