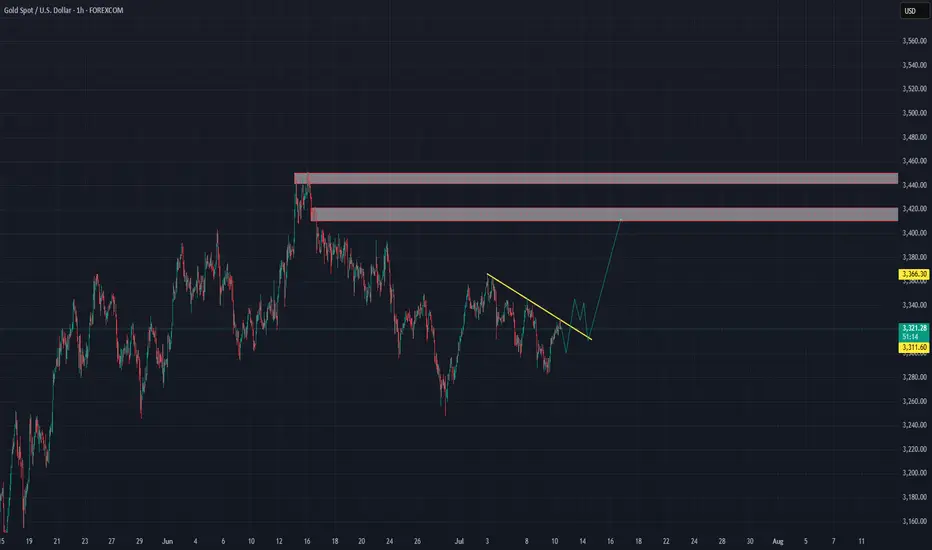
GOLD (XAUUSD): Important Decision Ahead
As I predicted, Gold went up from a trend line yesterday.
The price is now testing another trend line - a falling resistance
of a bullish flag pattern.
The next reliable bullish signal that you can look for is its
bullish breakout and a daily candle close above that.
A bullish move is going to follow then.
❤️Please, support my work with like, thank you!❤️
I am part of Trade Nation's Influencer program and receive a monthly fee for using their TradingView charts in my analysis.
Flag

Gold 1H analysisFX:XAUUSD
From what I see, this bullish flag is likely to form and the price will move to higher base.
SMCI - Bull Flag Breakout SetupSMCI formed a strong bullish impulse followed by a bull flag pattern.
A breakout above the flag structure may signal continuation if confirmed with strong price action.
Trade Plan:
• Entry: On breakout or retest
• Stop Loss: Below flag support
• TP1: Recent high
• TP2: Measured flagpole extension
This setup is worth monitoring for potential bullish continuation.
Disclaimer: This is not financial advice. For educational purposes only.

$BTC Tapping ATH - Is this REAL!?YUUUGE Daily Close today for CRYPTOCAP:BTC
Bullish cross on the 20/50MA.
Appears to have broken out of a bull flag.
Need PA to stay within this POI in order to confirm another leg up.

How to Spot Flag Patterns on TradingViewLearn to identify and trade flag patterns in TradingView with this step-by-step tutorial from Optimus Futures. Flag patterns are continuation formations that help traders join existing trends by buying high and selling higher, or selling low and buying back lower.
What You'll Learn:
• How to identify bullish and bearish flag patterns on any timeframe
• Breaking down flag patterns into two parts: the flagpole and the flag
• Finding strong flagpole formations with fast, obvious price moves
• Spotting flag consolidation areas that form tight ranges
• Why flag patterns work: buyer and seller psychology explained
• Real chart examples showing how flag patterns develop and play out
This tutorial may help futures traders and technical analysts who want to trade with market trends rather than against them. The concepts covered could assist you in identifying opportunities to join strong price movements when they pause before continuing.
Learn more about futures trading with Tradingview: optimusfutures.com
Disclaimer:
There is a substantial risk of loss in futures trading. Past performance is not indicative of future results. Please trade only with risk capital. We are not responsible for any third-party links, comments, or content shared on TradingView. Any opinions, links, or messages posted by users on TradingView do not represent our views or recommendations. Please exercise your own judgment and due diligence when engaging with any external content or user commentary.
This video represents the opinion of Optimus Futures and is intended for educational purposes only. Chart interpretations are presented solely to illustrate objective technical concepts and should not be viewed as predictive of future market behavior. In our opinion, charts are analytical tools—not forecasting instruments. Market conditions are constantly evolving, and all trading decisions should be made independently, with careful consideration of individual risk tolerance and financial objectives.

USD-CHF Bearish Flag! Sell!
Hello,Traders!
USD-CHF is trading in a
Downtrend and the pair broke
Out of the bearish flag so
We are bearish biased
And we will be expecting
A further bearish move down
Sell!
Comment and subscribe to help us grow!
Check out other forecasts below too!
Disclosure: I am part of Trade Nation's Influencer program and receive a monthly fee for using their TradingView charts in my analysis.

CRUDE OIL (WTI): Will It Rise More?
Quick update for my yesterday's analysis for WTI Crude Oil.
As I predicted yesterday, the price went up to the target.
We got one more strong bullish confirmation after a New York
session opening:
the price violated a resistance of a horizontal range on a 4H time frame.
I think that the market may rise even more and reach 69.25 level.
❤️Please, support my work with like, thank you!❤️

EURNZD with bullish flag patternbefore this bullish pattern, it can be seen that price action made a channel in which it made HHs and HLs, and then a flag pattern appeared. Now, the price is breaking flag in upward direction and if this breakout is real a bullish rally can be seen

TSLA (daytrading) break out and retest1. Still watching here (down trend is too strong)
We can see break out patterm
2. And came back to restest. But i worry about that tsla usually doesnt restest like that.
3. Hit sma 200 h1

Gold Trade Setup – Bullish Flag Pattern🧠 Gold Trade Setup – Bullish Flag Pattern
📍 Pattern: Bullish Flag
📉 EMA 50: Acting as dynamic support
💰 Current Price: $3,333
📈 Bias: Bullish continuation
🟢 Trade Plan: Long Position
🔼 Entry: Around $3,333 (confirmed breakout from flag)
🎯 Target: $3,365
🛑 Stop Loss: $3,323
📊 Risk–Reward Ratio: ~1:3.2 → favorable setup
🔍 This Works:
Price breaks out of a bullish flag, a strong continuation pattern.
EMA 50 supports the trend, confirming momentum.
Room to run up to $3,365 resistance zone if momentum holds.

Bear Flag Completed?This pattern in stock trading is called a bear flag, right?
Here's why:
Prior Downtrend (Flagpole): You can see a significant downward move leading into the pattern, which forms the "flagpole."
Consolidation/Correction (Flag): After the sharp drop, the price enters a period of consolidation within a defined, upward-sloping channel (or sometimes a rectangle). This forms the "flag" portion. It's a temporary counter-trend move where the bears take a breather.
Breakdown (Continuation of Downtrend): The price then breaks out of the lower boundary of the flag pattern, continuing the prior downtrend with renewed momentum.
Bear flags are considered continuation patterns, meaning they suggest that the preceding trend (in this case, a downtrend) is likely to continue after the pattern completes.
Is there a chance a reversal will follow the completed flag?

SOLUSDT Testing Resistance With Bullish Flag — Breakout in SightSOL is pressing against horizontal resistance after bouncing cleanly off trendline support twice (Rejection 1 & 2). Price action is now coiling inside a potential bullish flag — a breakout above $153 could send SOL toward $158 and beyond 🚀
📍 Bullish Scenario: Break above the flag → momentum toward $158
📍 Bearish Scenario: Break below trendline support → revisit $146
This post is for educational purposes only — not financial advice.
#SOL #Crypto #TechnicalAnalysis #BullishFlag #BreakoutSetup #TradingView #QuantTradingPro

XRP is ready ?XRP has been consolidating since last high from Jan this year. MACD shows that the momentum is picking up and I see it is ready for next move.
A weekly close will confirm it.

bullish flag emergingthis just an experimental idea help me with your knowledge feel free to comment and hope your portfolio to be green today

CRUDE OIL (WTI): Move Up Ahead!
Last week, I already shared a bullish setup on WTI Crude Oil
on a daily time frame.
I see a strong intraday bullish confirmation today.
After a test of an underlined blue support area,
the price went up strongly and violated a resistance line
of a bullish flag pattern on a 4H time frame.
The market is going to rise more.
Goal - 68.2
❤️Please, support my work with like, thank you!❤️
I am part of Trade Nation's Influencer program and receive a monthly fee for using their TradingView charts in my analysis.

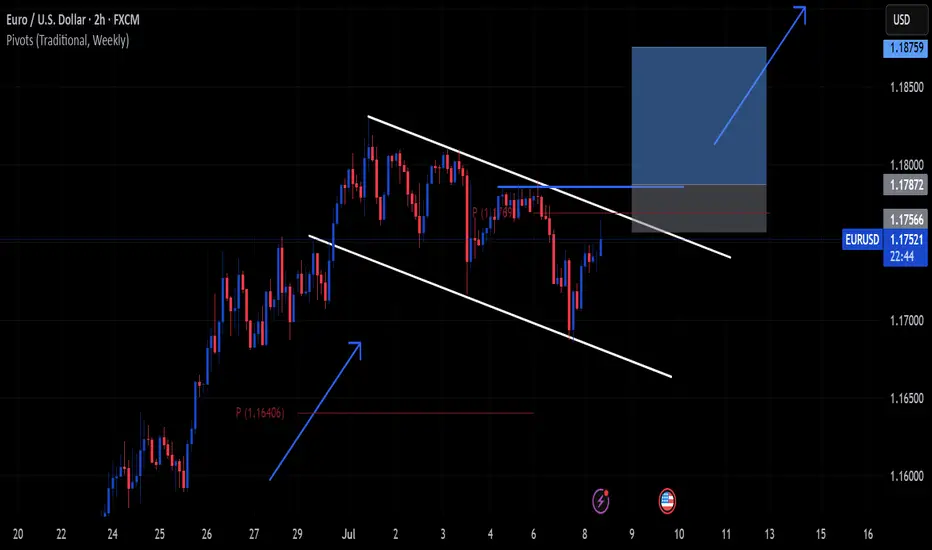
Where the coffee is strong (EUR/USD)Setup
EUR/USD is in a strong uptrend and recently broke above multi-year resistance just under 1.16. The pair looks to be targeting long term resistance at 1.23.
Signal
RSI is dropping back from overbought territory on the daily chart, offering a possible dip-buying opportunity above resistance-turned-support at 1.16.

EURJPY: Bullish Outlook Explained 🇪🇺🇯🇵
There is a high chance that EURJPY will continue rising
from an underlined horizontal support.
I see 2 strong price action confirmations:
the price violated a resistance line of a bullish flag
and a neckline of a double bottom pattern.
Goal - 170.4
❤️Please, support my work with like, thank you!❤️
I am part of Trade Nation's Influencer program and receive a monthly fee for using their TradingView charts in my analysis.

MarketBreakdown | USDJPY, USDCAD, BITCOIN, SILVER
Here are the updates & outlook for multiple instruments in my watch list.
1️⃣ #USDJPY daily time frame 🇺🇸🇯🇵
The market nicely respected a rising trend line
and bounced from that, forming a high momentum bullish candle.
I think that the pair will continue rising and reach 145.8 level soon.
2️⃣ #USDCAD daily time frame 🇺🇸🇨🇦
The price is currently approaching an important confluence
zone based on a falling trend line and a horizontal support.
I will expect a pullback from that.
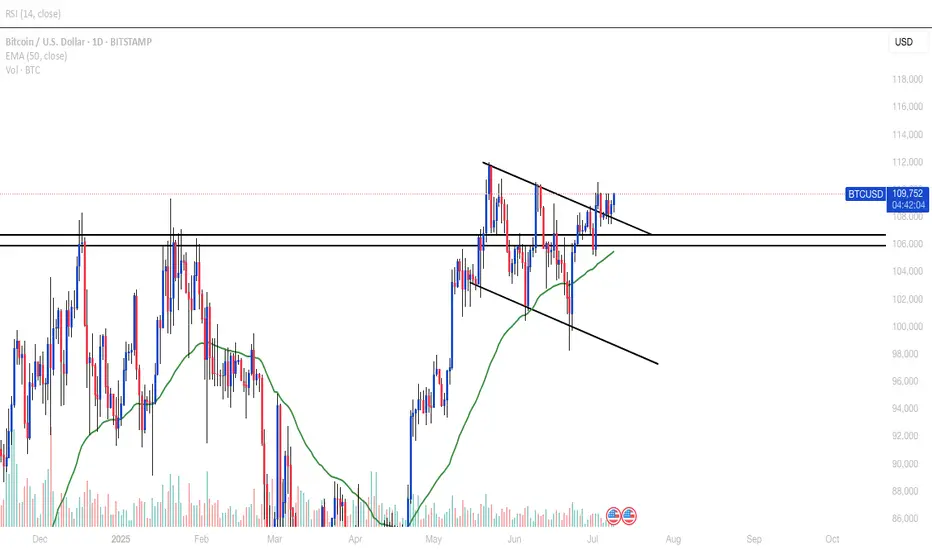
3️⃣ #BITCOIN #BTCUSD daily time frame
The price successfully violated a resistance line of a bullish
flag pattern and closed above that.
It is a critical bullish signal. I believe that the price will test
a current high then and will violate that with a high probability.
4️⃣ #SILVER #XAGUSD daily time frame 🪙
The market broke a resistance line of a bullish flag.
Uptrend is going to continue, and the price is going to reach 37,14 level soon.
Do you agree with my market breakdown?
❤️Please, support my work with like, thank you!❤️
I am part of Trade Nation's Influencer program and receive a monthly fee for using their TradingView charts in my analysis.

EIHotel,1W , Bullish it has formed a flag Pattern and ready to breakout of pattern , wait until weekly strong close and take the trade with proper risk management and proper position sizing .
Follow for more Swing Ideas Like this

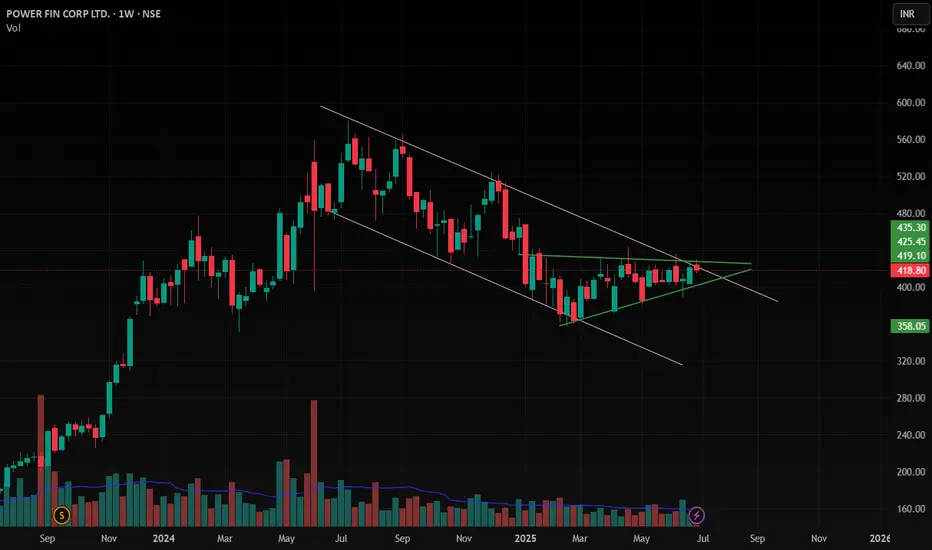
PFC , 1W , Bullishit has formed a Very Good Pattern and Ready to giving a Breakout and Wait patiently for Weekly close , after that enter into Trade , follow proper position sizing and follow risk management
follow for more Swing Ideas like this
AjantaPharma ,1W , Bullish it has Formed a Very Good Pattern in Weekly and giving Breakout ,Take the Trade after Strong Weekly Close and put the Sl below its Swing low and Follow Proper Risk Management
Follow for More Swing Ideas like this
