Bitcoin - Breakout incoming towards $115k?Introduction
Bitcoin (BTC) has been consolidating just below a key resistance level over the past several days. This period of sideways movement, without any significant pullbacks, reflects notable strength in the market. Such price behavior often precedes a strong directional move, and in this case, the technical setup continues to favor the possibility of a bullish breakout.
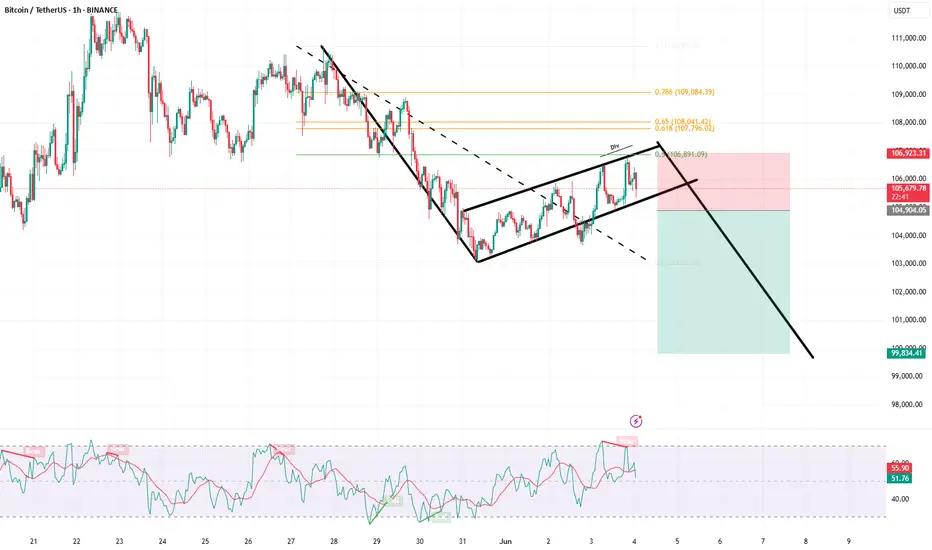
1H BullFlag Pattern
On the 1-hour timeframe, BTC is forming a well-defined bull flag pattern, which is typically a bullish continuation signal. This flag began to develop after BTC surged from approximately $105,000 to $110,000, creating the flagpole that represents the initial wave of upward momentum.
Since that move, price has entered a consolidation phase, forming the flag portion of the pattern with declining volume and tighter price action. If BTC breaks out above the upper boundary of this flag, the measured move target projects a rally toward the $115,000 level. Reaching this target would represent a new all-time high for Bitcoin, signaling a continuation of the broader uptrend.
4H Fair Value Gap (FVG), Downside Scenario
Although the overall structure favors a bullish outcome, it is important to acknowledge the potential for a short-term retracement. On the 4-hour chart, there is a Fair Value Gap (FVG) between $105,700 and $106,800. If BTC fails to break out immediately, this zone becomes a logical area to monitor.
Price may revisit this imbalance to fill the gap left behind by the recent upward move. A dip into this area could present a strong opportunity for long entries, particularly if buyers step in with conviction. Filling this FVG would allow for a more balanced structure before BTC attempts a sustained move higher.
Conclusion
BTC continues to show impressive resilience as it consolidates near its prior highs. The presence of a bull flag on the lower timeframes, coupled with minimal downside volatility, suggests that a breakout above resistance is becoming increasingly likely.
However, reclaiming the previous all-time high remains a critical step before targeting the projected $115,000 level. How BTC reacts to that key resistance area will provide important insight into the strength of this rally.
At this stage, the bullish case remains the higher probability scenario, while any short-term pullback into the FVG zone could offer a healthy reset and a potential long setup for continuation toward new highs.
Thanks for your support.
- Make sure to follow me so you don't miss out on the next analysis!
- Drop a like and leave a comment!
Flag

Lemonade Inc.: Breakout in Motion — Cup, Flag, and No BrakesLemonade Inc. (LMND) is accelerating after a clean breakout from a textbook cup with handle pattern, where the handle formed as a tight bullish flag. The breakout occurred around $32, and since then, price action has been sharp, controlled, and uncorrected — currently trading at $42.42 with buyers clearly in charge.
On the fundamental side, LMND is moving through a recovery phase: operational losses are narrowing, revenue is stabilizing, and the company is aggressively leveraging AI to automate its insurance processes. Expansion into Europe continues, and institutional interest is visibly rising — confirmed by volume building alongside price. Within the insuretech sector, LMND is starting to look like a comeback story rather than a cautionary tale.
Technically, the setup remains strong:
– Golden Cross confirmed (EMA50 crossing EMA200)
– EMA50/100/200 all below price — bullish structure firmly intact
– Volume expanding on up-days — healthy confirmation
– RSI hovering in the 60–65 range — momentum is intact, no signs of exhaustion
Targets remain aligned with the structure:
– tp1 = $64 — measured move from the flag
– tp2 = $94 — full realization of the cup pattern
Tactically, this is no longer a “wait and see” setup — the move is in progress. No correction so far, only continuation. Momentum traders may consider entries into strength. Above $45, the move could accelerate further as more participants recognize the structure.
LMND is showing technical and fundamental alignment — confirmed breakout, improving narrative, and strong trend structure. While the impulse holds, this chart favors continuation, not hesitation.

Natural Gas Flag PatternPurely based on flag pattern. According to flag pattern outbreak somewhere end of June. Just an opinion, NG always does his own thing.
TP1: 4.00
TP2: 4.40
TP3: 4.80
SL: 3.35

PNUT/USDT – Bullish Breakout from Falling Channel!PNUT Breakout Alert – 200% Potential on the Table
Hey Traders — if you're into high-conviction setups with real momentum, this one’s for you.
PNUT has officially broken out of a textbook falling channel after a healthy consolidation. This pattern often signals trend reversal and renewed bullish momentum — and PNUT looks ready to move.
🔹 Pattern: Falling Channel
🔹 Breakout Confirmation: Clear candle close above resistance
🔹 Previous Move: +204% before entering the channel
🔹 Current Setup: Long entry with defined risk-to-reward
🔹 Target: ~0.85
🔹 Stop: Just below the breakout zone
🧠 Technical Perspective:
Volume uptick during breakout confirms buyer strength
Strong support retest zone around 0.28–0.29
Holding above this range could fuel a significant leg higher
📌 This setup offers a clean structure with a high R:R potential. PNUT has proven it can move fast — now it’s about following the breakout with tight risk management.
📥 Add to your watchlist and let price action lead the way.

Ethereum breaking out!Two days ago, I've posted that we're most likely trading in a 2K-4K range on Ethereum. There was a slight deviation below 2K but the bulls swiftly regained control.
As for now, it's seems obvious we are heading towards, at least, 3K. I'm confident 4K is on the horizon, though I prefer to take it level by level.
ETH is breaking out off this bull flag and this chart looks more and more like one of those charts you study in textbooks.

USDJPY: Strong Intraday Bullish Price Action 🇺🇸🇯🇵
On the today's live stream, we discussed a very bullish setup
on USDJPY.
The price retested a recently broken horizontal resistance.
A resistance line of a falling wedge pattern was violated with
a strong bullish movement then.
We see its retest at the moment.
I think that the price will resume growth soon and reach 145.25 level.
❤️Please, support my work with like, thank you!❤️
I am part of Trade Nation's Influencer program and receive a monthly fee for using their TradingView charts in my analysis.

AUDCAD Buys ContinuePrice has finally broken out of the H4 resistance. Waiting on retest to continue the buys. Also have a bullish flag pattern that formed.

TOST getting toastyTOST Technical Analysis (Breakout Setup):
Current Pattern: Bull flag forming after a strong breakout from the $40.50 zone with increasing volume.
Resistance: $44.33 – key level to break for momentum continuation.
Support levels:
$42.00 (top of previous consolidation zone)
$40.55 (bull flag base and breakout pivot)
Ideal Breakout Play:
Watch for breakout above the flag’s upper trendline, ideally clearing $44.33 with volume.
A daily close above $44.33 confirms continuation — target $47–48 short-term, with potential run to $50 psychological.
Invalidation:
Break below $40.55 on volume negates the setup, suggesting failed breakout.
Favorable Path:
Consolidate slightly → Break flag above $44.33 → Ride momentum to $47–48. Risk/reward favors long bias above $44.33.
💡 This is a textbook bull flag following a high-volume breakout — high probability if volume confirms the breakout.

ETH on its way to 3000It’s clear we’re currently trading within a range between 2k and 4k on Ethereum.
Although we deviated below 2k, price reclaimed the range with strength, which is very bullish. Over the past few weeks we’ve been consolidating in what appears to be a bull flag, and I’ve been buying anywhere between mid to lower range.
A breakout seems likely soon, with a potential test of the 3000 resistance level
Long and confident

GOLD (XAUUSD): Important Supports & Resistances for Next Week
Here is my latest structure analysis for Gold.
Vertical Structures
Vertical Support 1: Falling trend line
Vertical Support 2: Falling trend line
Horizontal Structures
Horizontal Support 1: 3231 - 3286 area
Horizontal Support 2: 3121 - 3177 area
Horizontal Resistance 1: 3372 - 3404 area
Horizontal Resistance 2: 3427 - 3423 area
Horizontal Resistance 3: 3492 - 3500 area
Consider these structures for pullback/breakout trading.
❤️Please, support my work with like, thank you!❤️
I am part of Trade Nation's Influencer program and receive a monthly fee for using their TradingView charts in my analysis.

XRP Back on the MENU! XRPUSD Ripple next move? XrpUsdtIt's been a while since we looked at this chart.
🌍 SeekingPips 🌎 View remains the same and so we are strictly looking for strategic LONG entry points in
TIME & PRICE. 👌
Yes it's a WEEKLY chart and I understand that many of the trigger happy TRADERS or in some cases GAMBLERS can't stand to look at anything longer than a 30 minute chart BUT really sometimes you really just have to STEP RIGHT BACK to see the BIGGER PICTURE👍
✅️This week's candle CLOSE really has the potential to setup the next few weeks for easy MULTIDAY TRENDING MOVE TRADE SETUPS 👍
ℹ️ Note the price location on what we viewed as a HTF FLAG MANY WEEKS AGO .
Yes it was breached both sides but 🌎SeekingPips🌍 doesn't trade the patterns themselves but the HUMAN PSYCHOLOGY AROUND THESE PATTERNS.🤔
ℹ️ Note where most of the volume has been trading and also note the moves around the extreems of the dead patteren too.💡
In an even higher TIMEFRAME THE FLAG would still be valid and forming the flag itself too.
📊 [ b]CHECKOUT the MONTHLY chart for the example. 📉
Anyway we will see what the next 48 hours🕦 hold but no doubt this one is on our RADAR this week.
✴️ 2.048 to hold otherwise a potential for current low of this year to be tested.
✴️ Alternatively if support starts to form on the 240min chart at current levels last weeks high could expected to be tested
✴️ if so Xrp could easily give a multiday upside trending move.
Now like a NINJA we wait and stalk...
As always ladies and gentlemen whilst Seeking Pips 🌍 SeekingPips 🌎 says
" NO TRIGGER NO TRADE"
& "STICK TO YOUR PLAN"✅️
👍 Have a GREAT WEEK and we will see you soon with an UPDATE...

NVDA to $240 by 2026NASDAQ:NVDA is bullish still, anyone can see that, however I wanted to find some targets once it's in price discovery mode, well the golden pocket happpens to be $240 ($225-$250)
on weekly trend is confirmed extremely bullish so I'll continue holding and NASDAQ:NVDA should break $240 before 2026
Even a buy signal went off at the bottom in April. Let's see how much gas NASDAQ:NVDA has after it breaks the famous $150 resistance level

Almost readyThere might be an opportunity to enter a trade if the stock price breaks out of the triangle pattern upwards with a significant increase in volume."

Almost ReadyThere might be an opportunity to enter a trade if the stock price breaks out of the triangle pattern upwards with a significant increase in volume."

Target Sputters as Market Recovers Target has sputtered as the broader market recovers, and some traders may think the retailer has further downside risk.
The first pattern on today’s chart is the steady decline between early February and early April. TGT tried to stabilize after the move but barely rebounded. It also failed to hold the rally on May 12 after Treasury Secretary Scott Bessent cut tariffs on China. That feeble price action may suggest sellers remain in control.
Second, the stock spent about a month at its 50-day simple moving average (SMA) early this year before continuing lower. It’s now spent about three weeks at the same line without closing above it. Is the intermediate-term trend still bearish?
Third, the move between April 8 and May 20 may be viewed as a potentially bearish flag that’s now broken to the downside.
Next, the 8-day exponential moving average (EMA) recently crossed below the 21-day EMA. MACD has also turned negative. Those patterns may reflect a bearish short-term trend.
Finally, TGT is an active underlier in the options market. (It averages more than 70,000 contracts per day, according to TradeStation data.) That could help traders take positions with calls and puts.
Check out TradingView's The Leap competition sponsored by TradeStation.
TradeStation has, for decades, advanced the trading industry, providing access to stocks, options and futures. If you're born to trade, we could be for you. See our Overview for more.
Past performance, whether actual or indicated by historical tests of strategies, is no guarantee of future performance or success. There is a possibility that you may sustain a loss equal to or greater than your entire investment regardless of which asset class you trade (equities, options or futures); therefore, you should not invest or risk money that you cannot afford to lose. Online trading is not suitable for all investors. View the document titled Characteristics and Risks of Standardized Options at www.TradeStation.com . Before trading any asset class, customers must read the relevant risk disclosure statements on www.TradeStation.com . System access and trade placement and execution may be delayed or fail due to market volatility and volume, quote delays, system and software errors, Internet traffic, outages and other factors.
Securities and futures trading is offered to self-directed customers by TradeStation Securities, Inc., a broker-dealer registered with the Securities and Exchange Commission and a futures commission merchant licensed with the Commodity Futures Trading Commission). TradeStation Securities is a member of the Financial Industry Regulatory Authority, the National Futures Association, and a number of exchanges.
Options trading is not suitable for all investors. Your TradeStation Securities’ account application to trade options will be considered and approved or disapproved based on all relevant factors, including your trading experience. See www.TradeStation.com . Visit www.TradeStation.com for full details on the costs and fees associated with options.
Margin trading involves risks, and it is important that you fully understand those risks before trading on margin. The Margin Disclosure Statement outlines many of those risks, including that you can lose more funds than you deposit in your margin account; your brokerage firm can force the sale of securities in your account; your brokerage firm can sell your securities without contacting you; and you are not entitled to an extension of time on a margin call. Review the Margin Disclosure Statement at www.TradeStation.com .
TradeStation Securities, Inc. and TradeStation Technologies, Inc. are each wholly owned subsidiaries of TradeStation Group, Inc., both operating, and providing products and services, under the TradeStation brand and trademark. When applying for, or purchasing, accounts, subscriptions, products and services, it is important that you know which company you will be dealing with. Visit www.TradeStation.com for further important information explaining what this means.

Lemonade may be ready for a squeezeNYSE:LMND broke dramatically into overbought territory on the weekly chart earlier this year. It's taken understandable time to digest those gains and now looks like it could be building steam to revisit prices reached during that breakout.
The shorter term 4H chart, more suitable for entry and exit signals, illustrates a recent break above a cup and handle formation. That little pump appears to be consolidating rapidly.
Should the shorter term move find traction, the the weekly chart could provide a reasonable target as a trading range is formed for a larger move in the long run. A swing trade looks attractive at this point with potential 50% upside.

TSLA: Continues to form a Cup and Handle reversal patternHey folks,
Just a quick analysis of NASDAQ:TSLA on the daily chart. Compared to my last analysis, price has fallen a bit since, as a new flag (handle) continues to form following a cup pattern.
- Cup and Handle pattern forming. The handle would also count as a bull flag. This is known as
a cup and handle reversal pattern, after a downtrend. So yes, it is possible for a stock to
reverse its trend through the formation of a cup and handle reversal pattern (as you can see
in the chart).
- Major resistance at $366 which marks the peak of the flag (handle) pattern. This would have
to be broken in order for the cup and handle to be valid.
- Volume has also been decreasing during the formation of this pattern: this is typical amongst
Cup and Handle patterns, and generally a positive sign.
Note: Not financial advice.

GU Bulls Raise "Flag" Eyeing Higher PricesFX:GBPUSD has formed a Bull Flag and we could be getting ready to see the Bulls take the spotlight!
After Price broke through the Previous Level of Structure, Price retraces the High of 1.35589 to the 50% Fibonacci Level @ 1.35022 and is supported pushing Price back up from the Previous Level of Structure.
-The 50% retracement signals the end of the Consolidation Phase of the Pattern.
Now with a Bull Flag being a Continuation Pattern, we can suspect that Price will give us a Bullish Breakout of the Descending Channel and Retest before moving higher Confirming the Pattern and once the Breakout is Validated!
Based off the "Flagpole" of the Pattern, if a Bullish Breakout is Validated and the Retest is Successful, the extension of the Set-up would place the Price Target @ 1.3640 which is at the next big level of Resistance.

USDJPY Sell tradeSell opportunity on USDJPY
Entry: 144.000
Stoploss: 144.100
Take Profit: 142:150
Comment your opinion pls.
Follow me on X @shajudeakinoba1 for update and Account management

BTCUSDT is following flag PatternBTCUSDT is following a flag Pattern, it has also given a retracement of the 0.5 fib level.
GOLD (XAUUSD): Bullish Continuation Confirmed
As we discussed yesterday, Gold managed to break and close above
a resistance line of a bullish flag pattern on a daily.
It opens a potential for more growth.
Our next resistance is 3429.
For buying, consider the expanding demand zone based
on a broken horizontal resistance and a trend line.
❤️Please, support my work with like, thank you!❤️
I am part of Trade Nation's Influencer program and receive a monthly fee for using their TradingView charts in my analysis.

