Btc wave 5 will surprise everyoneHow are you HODL'rs holding up? Are you buying? Getting a divorce lol... She'll be back in a year or two as we already know.
Here is my prediction on this run. No one has anticipated such a run as we have had and it has been difficult for many amazing analysts to keep a high % of correct analysis albeit, some are gaining notoriety as they had predicted bearish price action and have even labeled this the bear market. Yet, how do we define a crypto bear market? Well the most noted determining factor is about an 80% pullback in the price of Bitcoin and around 90% for most alts. Yet, here we are with only a 60% pullback on Bitcoin and most alts have already done the 90% retracement or more for the less fortunate coins.
So where does that leave us? In my humbled option I believe we have not completed this run and entered a bear market as most are assuming. I do hold weight to the ideals that each run will extend longer as more consumers enter the market and raise the overall market cap, along with the law of diminishing returns this is something we should all take into consideration. That said, If you just look at this run starting from the bottom of the 2018 Bear market and apply a simple Elliott Wave 1-5 you will see that we have completed waves 1-3 and are currently playing out an Extended Flat correction for wave 4. If this plays to be true, based on the correction of wave C in wave 4 the price can fall down to two different fib retracements of waves A&B, those targets being the 1.236 and the 1.618 fibs. Since we have already passed the 1.236 it is likely we retrace to the 1.618 before heading into another impulse wave and completing the 5th wave before we see the typical 80% pullback. It is important to also note that we are currently at the 200 weekly SMA which has previously held as the market bottom in every bitcoin retracement in history.
A lot of factors played into the fact that we have had a different run than your typical run we have either all experienced or studied on the charts. You'll hear many reasons, some require a tinfoil hat and others are the more obvious reasons.... Yet, if you ask me, it was due to the few bitcoin futures ETF's that were approved. If you want to further investigate this, go back to 2017 and put the first bitcoin futures product released on the CME on the date and price of BTC, then move further down the line and place each one that has been approved since and I bet you will start seeing the trend. You can use this information in the future by staying up on the products being released on crypto assets. Just a hunch but, if you see something that has had a nice run and is being approved for a futures product, You may want to consider looking for ways to make profits on the way down.
I hope you enjoyed the idea and information. If you have, let me know in the comments, ask questions, lets discuss... we are all in this together, lets play like a team should!
Have a green week!
SAVVY
Below I have a link for you to read more in depth about Elliot Wave's and the fibs related to them to better your understanding of the chart I have posted.
elliottwave-forecast.com
I hope with all of the doom and gloom this will provide some clarity and set your mind at ease... and remember, Sell the hype and buy when the streets are soaked in blood... Now is the opposite of the time to panic sell at a loss.
Flat

Irregular flatWe are in this waves elliots ABC irregular flat.
Same on ETH
One push to the down and all in. 22/21/20k
And we'll be rich.

Bitcoin Pauses to Give Bulls Early Dose of HopiumBased on recent and continual analysis of Bitcoin, I believe that an upside trip to $32070 is minimally required (based on my perspective of the Elliott Wave count). This will serve as the final resistance level before Bitcoin takes an anticipated dip to $24K. From here, the crypto world will re-enter the "BTC to $100K" mindframe but that may become a troublesome idea.
See recent Bitcoin related posts for more perspective. For continued, near real-time analysis join the Digital Surf Trading Community.

Gold Stalls As Investors Remain IndecisiveBased on continued and ongoing analysis of Gold (XAUUSD), I believe that a) $1890 is due for test and denial, b) premature bulls will buy the dip near $1800, c) bulls will be denied again near $1890 and then we should/could make a drop below $1800 (between $1752 and $1770) to form final support for the macro pump that's currently pending.
A new all-time high is in store for Gold and I think I've deciphered the itinerary for it to do so. Updates will be applied below however, continuous updates are shared with my Digital Surf Trading Community :)
#SafeSurfing...

XAUUSD - Elliott wave update - corrective flat submicro abc
XAUUSD - Elliott wave update - corrective flat submicro abc
microwave (c) is running impulsive 5 waves
invalidation 1878

BTC Crimbo ShakedownWell, still waiting for the bottom.
Today's breakdown looks like we are tracking to the original idea from December based on a review of historical market tops. A few idea tweaks have taken place over the past few months to consider possible trajectory but ultimately Target remains $20k area.
The scenario was based on Weekly MA50 interaction. Market Top interaction with the 50 weekly MA has typically been in 3 parts:
1. Bounce on top of 50 WMA
2. Bounce up into 50 WMA
3. Break down away from 50 WMA
We are now at point 3 following a classic 'double tap' of the resistance.
- Expect a move down to $20k region
- points to a prolonged bear market
- ALTs.. plenty of folk warned others about the risk there
I'll note some positive signals in recent days and there are still scenarios that support various Flat Correction scenarios I outlined a few months ago - leaning towards an Expanded Flat Correction. If markets calm and DXY backs off from resistance there may be a rally in a week or so but ultimately I do not expect a reversal and target to be reached.
Best, Hard Forky

Bitcoin can go to 52k and fall Hi
In abc correction, we are in wave 5 of ending diagonal of wave c. Bit can touch the 52-54 resistance and must fall to 28k and beyond
Thanks for your attention
Have good trade

BTCUSDT . END OF CORRECTION . PRICE WILL BE GO DOWNThe flat correction with WXYXZ as wave B COMPLETED and
Wave C is starting .
Tell me what do you think ?

BTCUSDT Flat correction . WXYXZ maybe appearing ( Maybe ) 3-3-3-3-3 correction wave in the flat area that named WXYXZ with the elliott wave theory probably formed .
Tell me what do you think .

Elliott Wave Analysis: ShitCoin Index Is Eyeing July 2021 LowsHello Crypto traders and investors!
We are pretty sure you are wondering when it's time to buy cryptocurrencies again. Well, Cryptos are still trading in a bigger sideways correction, which we see it as an A-B-C flat formation, especially if we take a look on shitcoin index, where we see quite clear Elliott Wave Pattern, called 3-3-5 flat correction.
A 3-3-5 flat correction consists of three waves in leg A, three waves in leg B and five waves in leg C.
As you can see, we have (W)-(X)-(Y) complex structure in wave A, then wave have a three-wave (A)-(B)-(C) corrective recovery in wave B and now we are trading within a bigger ending diagonal pattern for wave C.
The ending diagonal is a special type of wave that occurs in wave 5 of an impulse, or wave C of a correction. This wave often occurs when the preceding move of the trend has gone too far, too fast, and has run out of steam. An ending diagonal pattern is a type of pattern that can occur at the completion of a strong move.
So, what we want to say is that shitcoin index and cryptocurrencies in general can be trading in final stages of a corrective movement, where we are tracking final wave (5) of C, which will ideally retest July 2021 lows and then we will expect real bulls to show up.
Be humble and trade smart!
If you like what we do, then please like and share our idea!
Disclosure: Please be informed that information we provide is NOT a trading recommendation or investment advice. All of our work is for educational purposes only.

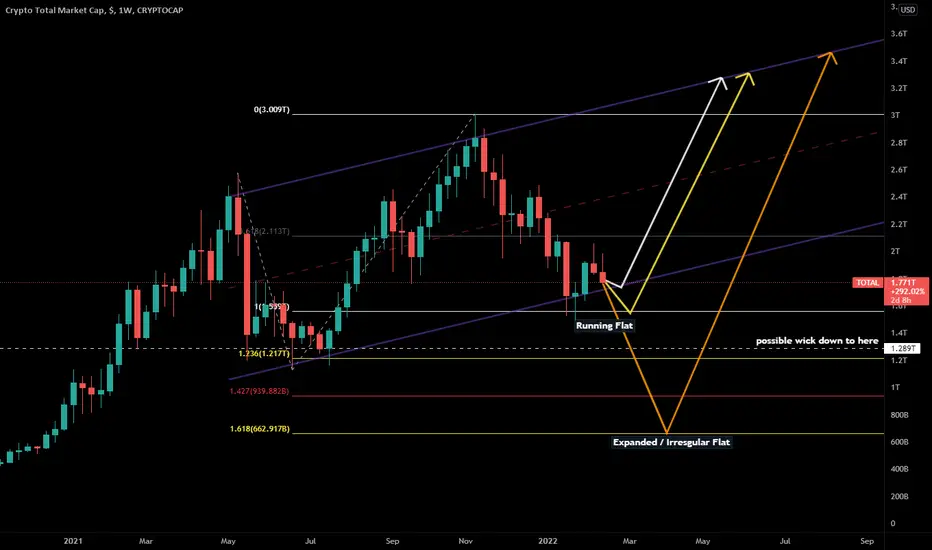
TOTAL - Running or Expanded Flat & Possible PathsQuick chart, possible paths for:
- Running Flat correction - presently this appears to be the formation
- Expanded Flat correction - becomes possible if we close with a lower low than our previous low
BTCUSDIt seems the correction has ended in a running flat with clear 5 waves down currently in a corrective mode to form the next leg up after C finishes
which will form the next 12.
Running flats are rare but it seems a lower low is not happening

ALLY Wave 4 Completed?Hello everyone, I wanted to share with you all what I'm seeing with ally. I believe Ally has completed a flat wave 4 correction. I have outlined 2 pink lines, one will invalidate the flat correction thesis and the other will validated. In other words if Ally breaks and closes below $44 the pattern will be invalidated and a larger correction will probably be in play ; on the other hand if ally breaks and closes above $49 the pattern will be valid and longs should be considered. I hope this helps some of you. I'm not a financial advisor, I'm only sharing what I'm doing. Good luck everyone!

NEO wave projects below 4000 in SPXA clear text book like Elliott wave counts shows that on going ''C'' wave correction will bring this index to below 4000 levels before march'22
I appreciate if any TA tool tells this story.

running flat CorrectionThe running flat has a three-wave structure, labeled A-B-C. Waves A and B consist of three waves. Wave B travels to a new extreme, exceeding the starting point of wave A of the pattern. And here comes the major difference between the two flat corrections. In an expanding flat, wave C travels beyond the starting point of wave B. Within the running type, it does not. In other words, a running flat wave C is not going to reach the termination point of wave A.
Read more at: ewminteractive.com

MSFT flat correctionElliott wave analysis view for MSFT suggests the decline from November 22, 2021 high is unfolding as a flat correction.
It turned out to be quite an interesting structure. Down from November 22 ATH wave (w) ended at 328.2 as simple ZZ, and rally in wave (x) is expanded flat ended at 343.86 (as we know each reactionary wave, labeled X, can take the shape of any corrective pattern). Wave (y) is ZZ and ended at 317.2. So we have complete WXY combination as a part of wave of flat. Rally in wave ended at 344.3 with internal subdivision as a ZZ. Final leg wave ended at 300.63 as ending diagonal and it has extension 1.272 from wave .
In terms of technical analysis, we have a price stop near the strong level of 305 and a good demand zone from 300.. There is also convergence of price and RSI indicator.
I can assume that wave 4 has probably ended and the formation of sub-waves of the 5th wave will soon begin.

GOLD short term updated 14/Jan/221)On Charts : Charts consist of 3-Dimensions - The X-factor ( Time or Cycle ), The Y- factor ( Price Geometry ), AND The Z-factor ( The Speed ).. 2)On Elliot Wave / Market Structure : Unlike Textbook written rule : ALL Impulsive wave comprise of ONLY a-b-c sub-waves NOT 1,2,3,4,5 waves.. AND there is NO Truncated 5th wave BUT ONLY wrong wave counts...

BITCOIN waves updated 12/Jan/22BITCOIN's Price possible retrace back to around 28000 at :- 1) Demand Zone 2) Support from parallel channel (cyan) ..for possible flat pattern in wave 4 (Yellow)

BTCUSD - Elliott wave – update - micro ((4))
BTCUSD - Elliott wave – update - micro ((4))
micro ((3)) ended 40620 - micro ((4)) should follow corrective flat - 43275 area
invalidation 43275

NSA breaking out of a flat base!* Good earnings
* Very Strong up trend
* High 3-month relative strength in the Real Estate sector
* Breaking out of a flat base of roughly 6 weeks with higher than average volume
* Pays out dividends quite generously since it's a REIT
Trade Idea:
* Now's a great time to enter as the price is just breaking out and is very close to the broken resistance.
* The REITs sector is also doing pretty well at the moment
* If you're looking for a discount you can look for a buying opportunity near the $62.50 to $63.30 area
Caution:
* A daily close below $62.50 would negate the idea

WABI/BTC Analyze !!! Hi, today I want to talk about one of the old Tokens of the market that has been in its five descending waves for a long time. maybe you can think about invest on it. The name of the token is 👉 Wabi 👈
Wabi Analyze ( WABIBTC ) Timeframe 2D ⏰
Location🌊 : Fortunately, Wabi was able to finish 5 descending waves at 0.00000929BTC , then it started to run on Big falling wedge & Descending Channel + started corrective structure by wave A that it had a Double Three corrective structure (W-X-Y) .
after wave A , it started to go down to the lower line of our Big falling Wedge , and at the same time, it finished Wave B (Structure of Wave B is ZigZag ).
The corrective structure of Wabi is Flat (3-3-5) , so we saw five impulsive microwaves (Wave C ) that ended on the upper line of our Big falling Wedge .
I was able to find another Small falling wedge inside on Big ones, it can be a key pattern for changing downtrend.
Price was able to break the Small falling wedge and Wabi started the new journey .
I think that Wabi can break Big falling Wedge too(soon) or it will rest on our Big falling wedge .
Resistance zone on Wabi's way : 0.00001843 BTC until 0.00001752BTC
Support zone on Wabi's way : 0.00000378 BTC until 0.00000237 BTC
Wabi Analyze ( WABIBTC ) Timeframe 4h ⏰
Location 🌊: as I said, Wabi was able to break a Small falling wedge and I tried to count waves after this happens. please pay attention to my analysis 👇https://www.tradingview.com/x/IGE2bc0P/
Wabi is on microwave C of main wave 4 .
End of the main wave 4 : 0.00000478 BTC - 0.0000046 BTC + TRZ ( Time Reversal Zone ), after that Wabi can start the main wave 5 or price can rest at time⏰ between 0.00000518 BTC until 0.0000046 BTC .
My Suggestion : if you want to have Wabi on your Portfolio , you can take it around 0.00000518 BTC until 0.0000046 BTC . // 🎯Target 🎯for end of August == 0.00000518 BTC until 0.0000046 BTC ( 0.00000478 BTC - 0.0000046 BTC (more possible))// Highest price of August Will 0.00000584 BTC .
Do not forget to put Stop loss for your positions (For every position you want to open).
Please follow your strategy , this is just my idea, and I will be glad to see your ideas in this post.
Please do not forget the ✅ ' like' ✅ button 🙏😊 & Share it with your friends, Thanks, and Trade safe

BTC, Major Update ! Flat Correction ScenariosBTC Shocked many analysts one more time ! What is the most possible scenarios now?
BTC proved 100 % today that those (including me) who expected a zigzag correction were completely wrong. But, this the nature of the market. Nobody can make 100 % accurate analysis and predictions.!
I see what is going on Bitcoin as a flat correction. There are three types of flat corrections : 1. regular 2. irregular and 3. Running
Regular flat correction is certainly rejected as we have a new ATH but both irregular and running are possible now and discussed below:
Right side of the chart
Irregular flat which is shown on the right side of the chart will push back the price down to below 28500 ! Is it really possible? Of course it is technically possible. Is it possible for BTC now? Of course possible but how much? I give very low chance for this scenario now but keep it in mind that every thing is possible in the market every time. Typical irregular flat correction target is 69000-74000 USD zone which is a strong resistance.
Left side of the chart:
Running flat correction will go much higher above former ATH typically up to 1.618 extension of last drop which is around 87000 USD for BTC now. If it goes there typical next correction of wave C is a decline down to previous ATH which is around 65000 USD.After that we have a new powerful motive wave which goes easily above 10000 USD. Less probable yet valid running flat scenario is to start correction after hitting 69000-74000 resistance target zone , a decline down to around 52000 and then starting a new motive wave up to above 10000 USD. Running flat correction scenarios is shown on the left side of the chart. I give more chance to typical running flat scenario now.
Hope this analysis to be useful for you my friends and wish you success in your trades

