AUDUSD: FLAT CORRECTION SPOTTED IN AN ELLIOT DOUBLE COMBO. please review the chart for details.
Zigzag been spotted in the wave A and wave B of the Flat correction , i hope for another zigzag move in wave C.
please kindly carefully review the analysis for better understanding.
please kindly follow, like and comment if you find it useful, or if you support the Idea .
Flat

Gold has a good chanceAlthough the falling channel has not broken yet. I expect to see finding the bottom in the green support zone and then the coming break out upward.
Gold must not go below 1670!
Waiting for bottoming and after an upward pressure

EURPLN FLAT correction 🦐EURPLN is in a FLAT correction (ELLIOTT's Waves) and broke a wedge. We will aspect a impulsive wave in order to reach the 'C' Point
According to Plancton strategy, we can set a nice order
–––––
Here is the Plancton0618 technical analysis, please comment below if you have any question.
The ENTRY in the market will be taken only if the condition of Plancton0618 strategy will trigger.

Irregular Flat spotted on Bitcoin?I noticed an irregular flat of wave 2- orange . As you can see the structure may have completed in (A)-(B)-(C), wave (B)- red warped higher than top of wave 1- orange , wave (C)- red also warped lower than wave (A)- red . If this correct, we might see a higher high as the price continue to complete the wave 3- orange and eventually complete higher degree of wave (5)- blue .

UPDATE!! USDSEK the last leg 🦐USDSEK creates the last impulse wave according to FLAT correction (Elliot's wave).
You can see the old call on the chart! Don't miss our signals!
–––––
Here is the Plancton0618 technical analysis, please comment below if you have any question.
The ENTRY in the market will be taken only if the condition of Plancton0618 strategy will trigger.

Head & Shoulders Sell Opportunity Chart Patterns:
- Elliot Wave 5 (Motive) - WXY( Correction) Combination
- WXY is a combination of an ABC (flat) - ABCDE (Triangle)
- Head & Shoulders Chart Pattern
Entry Point: 0.97098
Take Profit: 0.95958
Stop Loss: 0.97536

ADA/USDT - Flat 4th Looking like a nice flat setting up but I want to see a 1/2 before i take a position.

Powerful Traders, everyday EWA's analysing & working processCAT detailing complex Correction with FLAT (3-3-5) wave structure!
Regards, Team Traders "PowerfulTraders" flat

EURGBP BUYI've added notes to the chart that validate why I believe this is a buy opportunity based off of using the Elliott Wave Theory.
I believe we are in a corrective structure of a regular flat (3-3-5), moving into wave C.
Price is currently sitting in a demand zone.


EURUSD optionsMost traders short eurusd, that's the main scenario.
Anyway, we have to be pragmatic and consider nearest alternative scenarios.


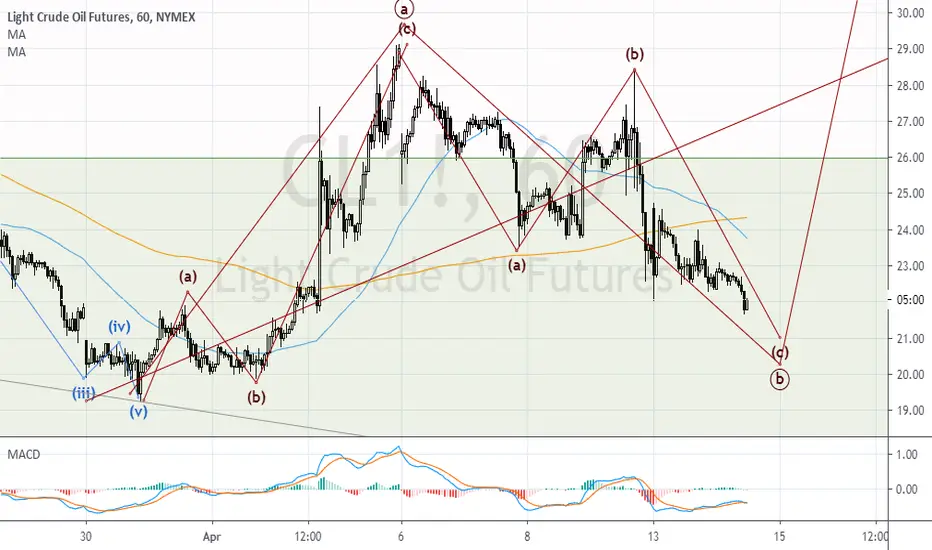
Possible Flat correctionOil war between Russian Saud and USA, and the OPEC, OPEC+ meeting, there are many things around oil, but it seems Oil is correcting in a flat way.
So there is a sideways possibility and. I am waiting for a Flat Elliott pattern as I have mentioned it in the previous oil analysis.
In the Flat pattern, the B wave possible target is in a very wide range. I expect an upward turn to above 30$ but from where I don't know. The turn could be from 21, 20, 19, 18$. I will wait for a fives wave(an impulse wave) from the zone of 18-21$ and rise above 23.15 and then I try to get a long position in a falling correction. This is my strategy, in a particular that the RR ratio will be above 2.5.
Sideways correction has created the possibilityAfter a short upward moving, the falling seems to look like an impulse wave. That is the wave (i). Now has been working a flat sideways correction almost three days.
Now I expect to see the impulse wave 3 to move the GBPUSD below 1.20 towards 1.15 or more.
The stop could at 1.2480

USDJPY Buy to Sell Price actionIdentified a number of PRZ of interest
Overlapping Fibonacci Retracement and Extension levels
- Double Bottom at 106.8900 level
- Potential Flat correction at B Leg of ABC correction
- Signs of strong rejection at completion (100%) of AB=CD pattern of double bottom
- Looking to enter long at 50% retracement of AB=CD pattern
- Projected Target is 138.2% extension level of Double Bottom Flat correction
Sell Limit
- Entry at 138.2% extension level of Double Bottom Flat correction
- Projected Target is 70.7% retracement of major Impulse Wave; 100% Extension of AB=C Correction
Always Use proper risk management

GBPAUD - first try to short into a longer-term moveHi traders,
I assume a leading diagonal and a three wave setback (wave C is an ending diagonal).
Smaller flat indicates price is likely start pushing down, I wish - in an impulsive way :)
Good luck!

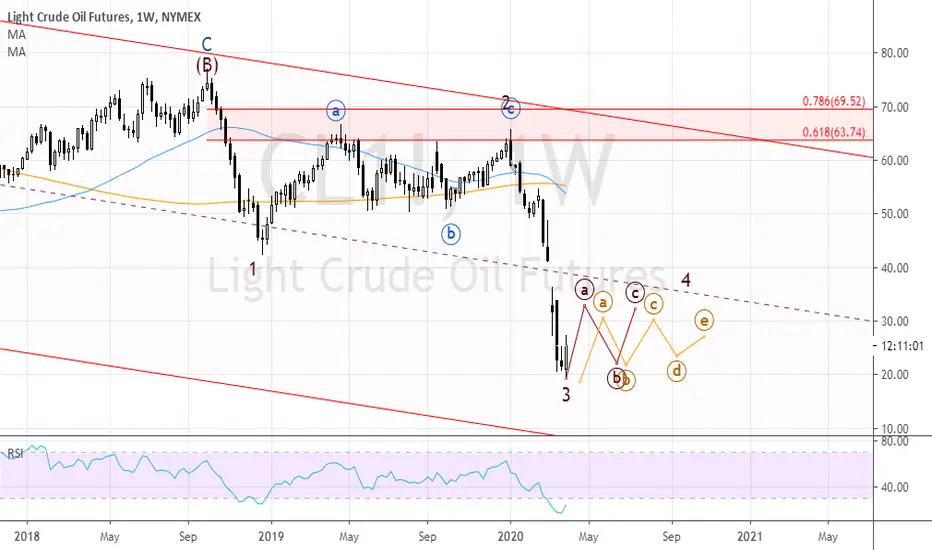
Sideways in oil for a whileAfter finding it's low at 19.50 I expect a sideways correction in oil because wave 2 was a Zigzag.
The alternation in the Elliott wave suggests me that after a deep correction there will be a sideways correction.
We are too early stage of wave 4, therefore, I don't know which one will be realised, a Triangle would be suitable for the coming situation, but a Flat or a type of Flat would come also. We will see it, but I will prepare for myself a sideways trading strategy, which is not my favourite.
At topping point, there will be extreme optimism and vice versa. In the sideways moving, the contrary attitude is well-paid.
USOIL- We Are Looking For Sell.Formation of Flat Or, Zigzag Correction Can happen Which Push It More Downside.


EURUSD is rallying but not yetI think what the low TF subdivisions tell us is that EUR is likely to draw a flat correction. This is compatible with my view of SPX500 near term.
