FLMUSDT


FLMUSDT (FLM) - IMMINENT BREAKOUT ANALYSIS 🔎
- FLMUSDT is consolidating in a symmetrical triangle pattern .
- A relatively big move is imminent.
- There's a breakout potential.
POSSIBLE PRICE ACTIONS
- Uptrend ⬆️: breakout above the symmetrical triangle's inclined resistance.
- Downtrend ⬇️: breakdown below the symmetrical triangle's inclined support.
TARGETS 🎯
- Uptrend ⬆️: Horizontal resistance levels (R1, R2).
- Downtrend ⬇️: Horizontal support levels (S1, S2)


FLM Could run from here FLM looks like it bottomed out creating a W pattern on the daily. Could break from here IMO.


#FLMUSDT Trading plan!Hi friends!
I think on the chart everything is clear!
The coin saves energy for a long time !
Above 0.1615$ I will buy.
Target 1 - 0.2466$
Target 2 - 0.3$


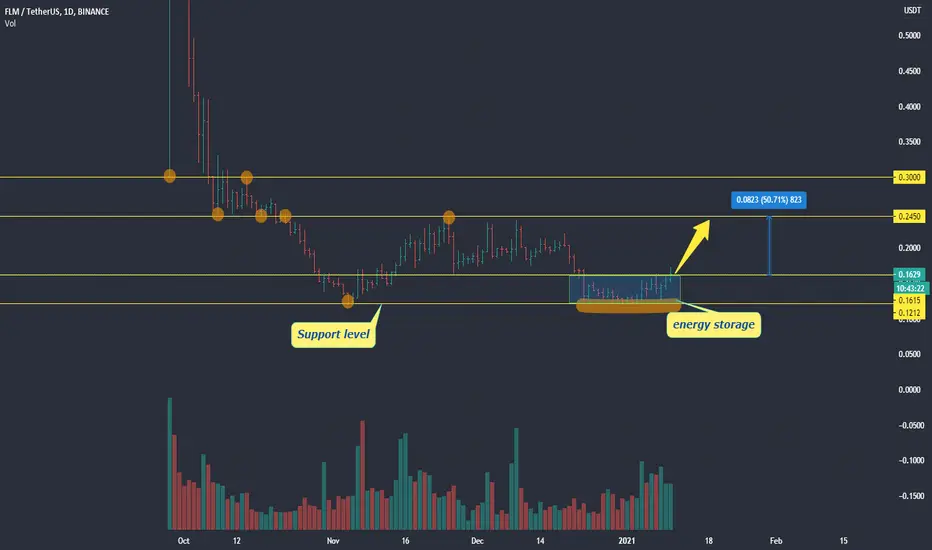
#FLMUSDT medium-term trading ideaHi friends!
After the fall, the pair bounced off the support level and saved up energy for several days!
In case of breakdown of the mirror resistance level of $ 0.1615, we can get a good upward movement!
Growth potential 50%


FLMUSDT Go Up to 0.22$FLM testing a daily resistance 0.13$ zone.
Buy zone highlighted in the chart, that is a great entry for a long if the price action will give it to us. Overall FLM is bullish long term.
Indicators are also turning bullish , To buy wait for support level.
The heading targets are at 0.225$ and Up.
📈 BUY At 0.1275 $ and Below.
***This information is not a recommendation to buy or sell. It is to be used for educational purposes only.***
Leave a comment , Let's make money together.

FLMUSDT - Potential buy entry 🔼FLMUSDT is printing a falling wedge pattern.
RSI is printing a bullish divergence signal.
Buy entry ⬆️ - breakout above the falling wedge resistance + previous swing low.
Target 🎯 - resistance levels.
Setup invalidation ❌ - breakdown below the falling wedge support.

FLMUSD Long. Reversal on goingFLM reached an important support level. Printing a potential double bottom. If we rebound on this level, we should head back to the top.


FLM Flamingo Easy Target - FLMBTC FLMUSD FLMBNB FLMBUSD FLMUSDTFLM Flamingo Easy Target - FLMBTC FLMUSD FLMBNB FLMBUSD FLMUSDT

We have a bullish set up hereFLMUSDT has been very bearish for a while now, but the reversal is at hand and its a short term one. i will keep you updated.
