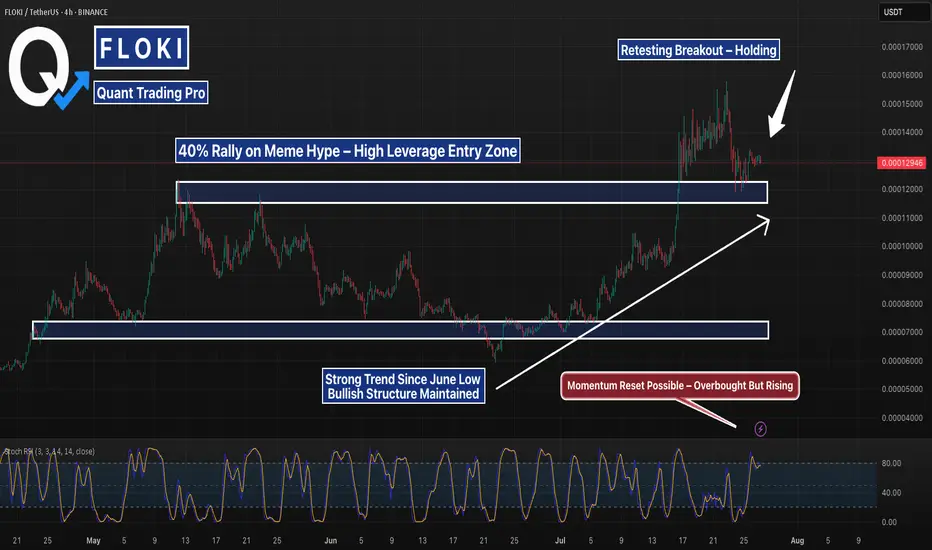
FLOKI Pulls Back After 40% Pump — Testing Breakout StructureFLOKIUSDT 4H chart shows a textbook meme-driven breakout followed by a clean pullback into prior structure. After a 40% move up in just a few sessions — driven by rising social media hype and a massive jump in futures open interest — FLOKI is now retesting the breakout base near the 0.0000120 level.
This zone served as the high of a multi-month range and is now being tested as support. Price is also riding a clear ascending trendline from the June lows, suggesting overall structure remains bullish unless that trend is broken.
Stochastic RSI is elevated but hasn't rolled over yet, signaling momentum could still push higher if support holds. If bulls defend this zone and break above the upper consolidation, the next leg could push toward the previous local highs around 0.0000170. If support fails, eyes turn to the 0.0000098 mid-range level.
Momentum cooling — structure still intact.
Floki
FLOKIUSDT Pullback at Fibonacci Resistance – Bounce?📊 Market Overview:
FLOKI has recently posted a remarkable rally, gaining over +200% from the swing low at 0.00004548. This surge broke through multiple resistance levels, forming a strong bullish market structure with clear Higher Highs (HH) and Higher Lows (HL).
However, this bullish momentum has now met a critical resistance at 0.00015339, which aligns with the Fibonacci 0.382 retracement level of the previous macro move. This rejection has triggered a pullback, raising questions: is this a healthy retracement, or the start of a trend reversal?
---
🧠 Technical Breakdown:
✅ Bullish Structure in Play
The recent move appears to be part of a larger impulsive wave, possibly Wave 1 or 3 of an Elliott Wave sequence.
✅ Golden Pocket Zone in Sight
The highlighted yellow box marks the Fibonacci Golden Pocket area between 0.5 (0.00011441) and 0.618 (0.0001104) — historically, this is a high-probability buy zone where bulls often regain control.
✅ Breakout Retest Potential
The current pullback could be a textbook retest of the previous breakout base, setting up for continuation — but only if this key zone holds.
---
🟢 Bullish Scenario:
If the price finds support at the 0.000110–0.000114 zone, and forms a strong bullish reversal candle (e.g., bullish engulfing, hammer), it could ignite a fresh wave upward targeting:
🔼 0.00015339 (breakout level)
🔼 0.00018212
🔼 0.00020366
🔼 0.00022000
🔼 0.00026506
🏁 0.00028898 — the previous major high and full swing target
Such a move would validate the continuation of the macro uptrend and possibly confirm Wave 3 in a larger Elliott Wave structure.
---
🔴 Bearish Scenario:
On the other hand, a daily close below 0.000110 would invalidate the bullish golden pocket thesis and potentially shift momentum in favor of the bears.
Possible downside targets include:
🔻 0.00008500 — minor support and demand zone
🔻 0.00004548 — the macro low and strong historical support
This would form a Lower High (LH) structure, which could signal the beginning of a bearish trend or extended consolidation.
---
🔍 Conclusion:
> FLOKIUSDT is now at a make-or-break level. The 0.000110–0.000114 zone is where bulls and bears will battle for control of the trend.
Hold here — and we may see a strong continuation.
Break below — and caution is warranted.
Wait for clear price action confirmation in the coming sessions before positioning. This zone will likely dictate FLOKI’s next major move.
---
💡 Pro Tips for Traders:
Watch for bullish reversal candlesticks in the golden pocket area.
Monitor volume — rising volume on a bounce increases breakout probability.
RSI divergence may provide early signs of trend reversal or continuation.
#FLOKIUSDT #FLOKI #CryptoAnalysis #AltcoinRally #FibonacciLevels #TechnicalAnalysis #BullishScenario #BearishScenario #PriceAction #CryptoBreakout #GoldenPocket #TrendReversal

FLOKI Headed to $0.01. Cents Floki to the upside after break out from bullish triangle pattern. Target is the 141.00%

FLOKIUSDT Breaks Key Resistance – Bullish Continuation Ahead?BINANCE:FLOKIUSDT is trading inside its longest ascending triangle. The price has respected the triangle's support and bounced back. It has now broken a key resistance zone. As seen in the chart, every time the price breaks a major resistance, a bullish move follows, and we can expect a similar scenario this time.
SEED_DONKEYDAN_MARKET_CAP:FLOKI CRYPTO:FLOKIUSD
Cheers
Hexa🧘♀️

FLOKI: The optimal entry price! Trading Setup
If you’re considering trading FLOKI, here’s a quick setup that may help you.
The idea is: Buy when the price breaks above $0.000105 and take profits at the levels shown in the chart.
Targets:
1. $0.000108
2. $0.000112
3. $0.000117
-------------------------------------------
About our trades:
Our success rate is notably high, with 10 out of 11 posted trade setups achieving at least their first target upon a breakout price breach (The most on TW!). Our TradingView page serves as a testament to this claim, and we invite you to verify it!

#FLOKI/USDT#FLOKI
The price is moving within a descending channel on the 1-hour frame and is expected to break and continue upward.
We have a trend to stabilize above the 100 moving average once again.
We have a downtrend on the RSI indicator, which supports the upward move by breaking it upward.
We have a support area at the lower limit of the channel at 0.00008150, acting as strong support from which the price can rebound.
Entry price: 0.00008490
First target: 0.00008713
Second target: 0.00008887
Third target: 0.00009129

#FLOKI/USDT#FLOKI
The price is moving within a descending channel on the 1-hour frame and is expected to break and continue upward.
We have a trend to stabilize above the 100 moving average once again.
We have a downtrend on the RSI indicator, which supports the upward move by breaking it upward.
We have a support area at the lower limit of the channel at 0.00007790, acting as strong support from which the price can rebound.
Entry price: 0.00007875
First target: 0.00008000
Second target: 0.00008133
Third target: 0.00008300

FLOKI/USDT — Major Breakout Incoming? The Calm Before a BullishThe daily chart of FLOKI/USDT reveals a highly compelling technical setup. After a prolonged downtrend that started in late 2024, FLOKI is now testing a key descending trendline — signaling a potential trend reversal and the beginning of a new bullish phase if a breakout is confirmed.
📊 Detailed Technical Analysis:
🔍 Pattern Formation:
Descending Trendline Resistance: Acting as a dynamic resistance since the November 2024 high, capping every major rally attempt.
Consistent Higher Lows: Since March 2025, FLOKI has been forming a series of higher lows — an early bullish sign of accumulation.
Volatility Squeeze: Recent candles are consolidating near the apex of the triangle, suggesting a breakout move is imminent.
Bullish Structure Forming: A successful breakout would complete a bullish reversal pattern on the daily chart.
🟢 Bullish Scenario (Breakout Confirmation):
If the price closes above 0.0001079 on the daily timeframe and confirms a clean breakout above the descending trendline, we can anticipate an extended move to the upside.
🎯 Key upside targets based on historical resistance zones:
1. Target 1: 0.00011535 → Previous minor resistance
2. Target 2: 0.00013414 → March 2025 supply zone
3. Target 3: 0.00016078 → Strong horizontal resistance
4. Target 4: 0.00020000 → Major psychological level
5. Target 5: 0.00028779 → Previous swing high (November 2024)
💥 A full breakout move to the top could offer over 200% potential upside, making it a high-reward setup for well-managed long entries.
🔴 Bearish Scenario (Rejection):
If FLOKI fails to break above the descending trendline:
⚠️ We could see a retracement to lower support levels:
Minor Support: 0.00007500
Key Support: 0.00005700
Last Defense: 0.00004548 → Previous cycle low
A breakdown below these support levels would invalidate the bullish setup and shift momentum back in favor of the bears.
🧠 Pro Tips:
Watch for Volume Confirmation during the breakout — high volume adds credibility.
Focus on Body Closes, not just wicks, when identifying valid breakouts.
Manage Risk Wisely — a stop loss just below the trendline offers solid risk-to-reward.
📅 Conclusion:
FLOKI/USDT is at a critical technical juncture. A confirmed breakout above the descending trendline could spark a strong bullish trend, while a rejection may lead to deeper correction or consolidation.
💡 The next few candles will likely determine the medium-term direction for FLOKI.
#FLOKI #FLOKIUSDT #AltcoinBreakout #CryptoSetup #TechnicalAnalysis #BullishCrypto #BreakoutTrade #TrendReversal #CryptoSignals

Floki Inu Bullish Signal Fully Confirmed (486% Easy Potential)The last time FLOKIUSDT moved above EMA55 daily, it produced a bullish wave exceeding 1,250% profits, within months. This same signal, the same development is happening now after years of bearish action and months of consolidation. In short, a very strong bullish reversal signal is now present on the chart.
To be honest, that's all there is. More information can just get things confused but, let's proceed.
The downtrend ends and we enter a transition period.
The transition is over and we enter an uptrend. That's all there is. Floki Inu is set to grow.
The bullish bias is already confirmed. As FLOKI now trades above EMA55, trading volume continues to increase. The chart structure is also perfect for a bullish wave. The last major low is still a long-term higher low compared to the bottom prices before the 2024 bullish wave.
Unlike in the past, there is no need to wait for months for this jump to come to be. Floki will start moving within weeks, maximum. It is possible that the next bullish wave goes into full force within days. The entire altcoins market has been consolidating long enough. The time is now.
Thanks a lot for your continued support.
Namaste.

FLOKI on Fire! Bullish Summer for FLOKIUSDTDuring the two-month period from July to August, it's unclear what the specific catalyst might be, but Floki appears poised for a price surge between 75% to 133%. The June low at 0.00005923 seems to mark a solid bottom, and from here, I anticipate a bullish trend in Floki’s price.

TOKENFI #TOKEN Trade alertPlay the bounce for a short term target trades from this clear support block with the deviation low already in place.
For long term believers good area to DCA to bring down your average cost.

FLOKI Technical Outlook: Trend, Patterns, and Trade PlanFloki (FLOKI) continues to demonstrate robust bullish momentum on the higher timeframes, with price action respecting the prevailing uptrend 📈. After continued retracements and expansion, the structure remains constructive, and my directional bias is firmly bullish.
While the emergence of a three-drive pattern warrants some caution ⚠️, the overall trend suggests that any corrective move could present a high-probability long opportunity. Wait for a retrace to key support zones before considering entries. My targets are set at previous swing highs visible on the 4H chart, with stops placed just below the most recent low for prudent risk management.
As always, this is not financial advice—trade safe and stick to your plan! 🚀

FLOKIUSDT Forming Bullish waveFLOKIUSDT is currently showcasing a strong bullish setup, supported by growing volume and technical confirmation. The recent price movement indicates accumulation at key support levels, followed by a tightening range that often precedes a significant breakout. This structure suggests high probability for a powerful upward move, aligning with the projected 80% to 90% gain. With market sentiment turning positive around meme tokens and community-driven coins, FLOKI is positioned for potential explosive growth.
The FLOKI project continues to capture attention across crypto communities due to its expanding ecosystem, including FlokiFi, NFT integrations, and utility within the DeFi space. This has helped build confidence among investors, especially as FLOKI has transitioned from a meme coin narrative to one with real-world use cases. As volume builds around this consolidation, technical traders may interpret this as a bullish continuation pattern, setting the stage for aggressive price expansion.
Technically, FLOKIUSDT is attempting a breakout from a downward channel, with recent candles showing strong rejection of lower prices and momentum starting to shift upward. Once this breakout is confirmed with sustained volume, the rally could accelerate quickly, as price targets move into the 0.000015–0.000016 range. This aligns with the 80–90% gain expectation highlighted on the chart, providing a favorable setup for swing and position traders alike.
Overall, FLOKIUSDT offers a compelling combination of bullish technicals, increasing investor interest, and narrative momentum. It’s a chart worth watching closely for breakout confirmation, especially for those looking to capitalize on mid-cap altcoin volatility during this phase of the market cycle.
✅ Show your support by hitting the like button and
✅ Leaving a comment below! (What is You opinion about this Coin)
Your feedback and engagement keep me inspired to share more insightful market analysis with you!

FLOKIUSDT 1D AnalysisFLOKI ~ 1D Analysis
#FLOKI Buy back from here with a short term target of at least 15%+ and a long term target of $0.00028

FLOKI Can it hit $0.0010 by the end of the year?Floki Inu (FLOKIUSD) made a strong rebound from its April 08 bottom, which happened to be on the Higher Lows trend-line from its 2022 Bear Cycle Low. That was a major Buy Signal long-term and right now the price has found itself ranged within the 1D MA200 (orange trend-line) and 1D MA50 (blue trend-line).
A break above its 1D MA200 would by the next Buy Signal as it would confirm the full extension of this Bullish Leg. This is similar to what took place on Phase 2 after the start of the previous Bullish Leg (November 2023).
That structure peaked at +2217% from the bottom. If the same price rally happens again, we can expect Floki to target 0.0010 by the end of the year, which will be marginally above the 0.5 Fibonacci level of the historic Fib Channel.
-------------------------------------------------------------------------------
** Please LIKE 👍, FOLLOW ✅, SHARE 🙌 and COMMENT ✍ if you enjoy this idea! Also share your ideas and charts in the comments section below! This is best way to keep it relevant, support us, keep the content here free and allow the idea to reach as many people as possible. **
-------------------------------------------------------------------------------
💸💸💸💸💸💸
👇 👇 👇 👇 👇 👇

Updated Analysis According to Current Market ConditionsFLOKIUSDT: Monitoring the Blue Box Support Areas
In this analysis, the blue boxes are identified as potential support areas where buying pressure could develop. While the market sentiment is currently unfavorable, the price has revisited my previously marked blue boxes. Based on this, I have chosen to add to my positions, confident in the structural importance of these zones.
Trading Strategy
Lower Time Frame Reactions: It's critical to observe how the price reacts within these blue box zones. Signals such as bullish candlestick formations, increased volume, or divergence patterns could indicate a reversal opportunity.
Long Trade Setups: Trades can be structured by leveraging these lower time frame confirmations, ensuring a clear entry and exit strategy aligned with market conditions.
Summary
Despite the broader market looking weak, the blue boxes in FLOKIUSDT offer potential support and a chance to position for a bounce. By focusing on reactions in these zones, traders can adjust their strategies to the prevailing conditions while managing risk effectively.
I keep my charts clean and simple because I believe clarity leads to better decisions.
My approach is built on years of experience and a solid track record. I don’t claim to know it all, but I’m confident in my ability to spot high-probability setups.
My Previous Analysis
🐶 DOGEUSDT.P: Next Move
🎨 RENDERUSDT.P: Opportunity of the Month
💎 ETHUSDT.P: Where to Retrace
🟢 BNBUSDT.P: Potential Surge
📊 BTC Dominance: Reaction Zone
🌊 WAVESUSDT.P: Demand Zone Potential
🟣 UNIUSDT.P: Long-Term Trade
🔵 XRPUSDT.P: Entry Zones
🔗 LINKUSDT.P: Follow The River
📈 BTCUSDT.P: Two Key Demand Zones
🟩 POLUSDT: Bullish Momentum
🌟 PENDLEUSDT.P: Where Opportunity Meets Precision
🔥 BTCUSDT.P: Liquidation of Highly Leveraged Longs
🌊 SOLUSDT.P: SOL's Dip - Your Opportunity
🐸 1000PEPEUSDT.P: Prime Bounce Zone Unlocked
🚀 ETHUSDT.P: Set to Explode - Don't Miss This Game Changer
🤖 IQUSDT: Smart Plan
⚡️ PONDUSDT: A Trade Not Taken Is Better Than a Losing One
💼 STMXUSDT: 2 Buying Areas
🐢 TURBOUSDT: Buy Zones and Buyer Presence
🌍 ICPUSDT.P: Massive Upside Potential | Check the Trade Update For Seeing Results
🟠 IDEXUSDT: Spot Buy Area | %26 Profit if You Trade with MSB
📌 USUALUSDT: Buyers Are Active + %70 Profit in Total

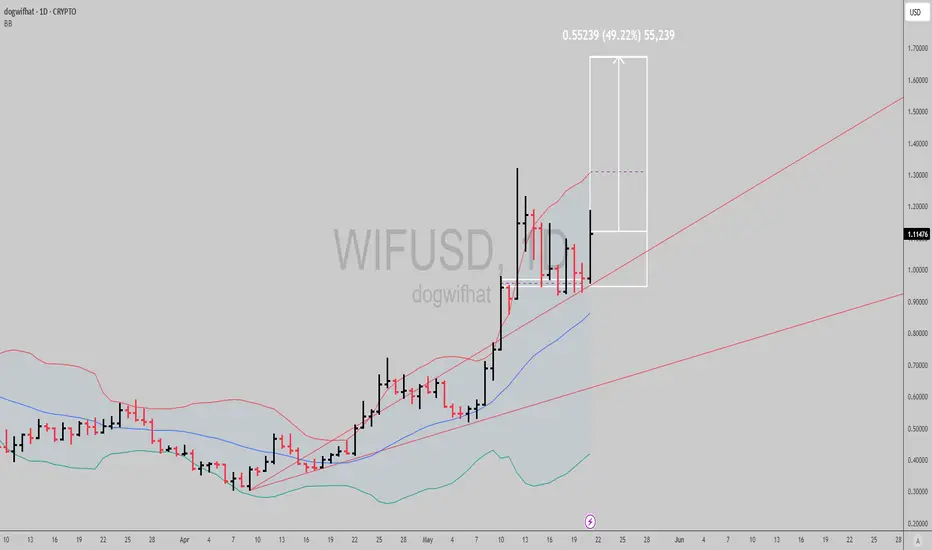
$WIF: Uptrend signal activeNice signal in SEED_WANDERIN_JIMZIP900:WIF here, the trend in the daily timeframe has been bullish since April 18th, and has been giving us multiple continuation signals to trade in and out, or scale in with low risk as we move the stop higher if playing it longer term.
If prices hold above recent lows, we can see a close to 50% run from here within a week give or take.
Best of luck!
Cheers,
Ivan Labrie.
FLOKI AT RESISTANCE LINElooks like price will drop lower from here. Trade with caution!
Please support this idea with a LIKE👍 if you find it useful🥳
Happy Trading💰🥳🤗

#FLOKI/USDT#FLOKI
The price is moving within a descending channel on the 1-hour frame, adhering well to it, and is on its way to breaking it strongly upwards and retesting it.
We are seeing a bounce from the lower boundary of the descending channel. This support is at 0.00010160.
We have a downtrend on the RSI indicator that is about to break and retest, supporting the upward trend.
We are looking for stability above the 100 moving average.
Entry price: 0.00010950
First target: 0.00012125
Second target: 0.00012120
Third target: 0.00012900

#FLOKI/USDT#FLOKI
The price is moving within a descending channel on the 1-hour frame, adhering well to it, and is on its way to breaking it strongly upwards and retesting it.
We are seeing a bounce from the lower boundary of the descending channel. This support is at 0.00006834.
We have a downtrend on the RSI indicator that is about to break and retest, supporting the upward trend.
We are looking for stability above the 100 moving average.
Entry price: 0.00007137
First target: 0.00007618
Second target: 0.00007274
Third target: 0.00008013

#FLOKI/USDT#FLOKI
The price is moving in a descending channel on the 1-hour frame and is adhering to it well and is heading to break it strongly upwards and retest it
We have a bounce from the lower limit of the descending channel, this support is at a price of 0.00009128
We have a downtrend on the RSI indicator that is about to break and retest, which supports the rise
We have a trend to stabilize above the moving average 100
Entry price 0.00009363
First target 0.00009596
Second target 0.00009935
Third target 0.0001030395

#FLOKI gonna see 600 % profit.... at leastIf I'm gonna bet on one coin that can make 600 % profit it will be #FLOKI
best buying areas are
0.000078_0.000076
0.000033_0.000041
Targets are
0.00035
0.00055
