FLOKi iNU: $0.000 27 | 30x Payot at Allocation levelsif you missed the run up..
we may have a chance to get on baord when a big shot
seeks for allocation 25% of the total coins available
for now.. only 2% is being used to dress up a pre valhalla preview
Floki

FLOKI Long IDEAFloki is forming a Cup&Handle pattern that can give us up to 60% profit on Spot. Safe entry wait for retest over the red Resistance level. Manage your Risk, use max. 5% of total portfolio on your trades.

$FLOKI recovery trading planSEED_DONKEYDAN_MARKET_CAP:FLOKI , like all altcoins, was hammered when CRYPTOCAP:BTC had its -20% correction. But now it shows all the signs of recovering.
- The CRYPTOCAP:BTC correction seems to be over.
- SEED_DONKEYDAN_MARKET_CAP:FLOKI has just launched a trading bot that is burning tokens every day.
- SEED_DONKEYDAN_MARKET_CAP:FLOKI is on BNB and ETH chains, and will benefit from the ETH ETF cash inflow.
- The SEED_DONKEYDAN_MARKET_CAP:FLOKI team is the same as the $TOKEN (Tokenfi) project and Valhalla metaverse, so it is not just a meme coin that can rug you, It also has a stacking system that is working.
- SEED_DONKEYDAN_MARKET_CAP:FLOKI is listed on all major exchanges (except Coinbase).
- SEED_DONKEYDAN_MARKET_CAP:FLOKI has all its tokens unlocked and has deflationary tokenomics. Already, 40% of the supply has been burned, locked in a public address.
- SEED_DONKEYDAN_MARKET_CAP:FLOKI has an active community of holders. Check Telegram; it is not fake.
**Conclusion:** This project is safe, has an ecosystem, a true community, has existed for three years, and will perform very well this bull run. The risk/reward is high, considering that it is a meme coin that can do 50% in a month, but it also has a solid team with a proven track record to support the project.
**What is the situation?**
After a massive pump, SEED_DONKEYDAN_MARKET_CAP:FLOKI was destroyed by the CRYPTOCAP:BTC correction and is now recovering.
- The MACD is soon having a signal cross on the 1D timeframe, indicating a long bullish phase is coming.
- The RSI is in oversold territory, indicating that investors are likely to buy more.
- TOTAL2 is in the same situation, indicating a bounce for altcoins.
- SEED_DONKEYDAN_MARKET_CAP:FLOKI is in a raising trend, the long term is bullish, it is one of the rare coins safe to hold until the end of this bull run.
** Compare with others **
- $SHIBA: Already overvalued. Its capacity to rise is limited, and given the competition, it is even possible that it will lose market share to others and drop.
- CRYPTOCAP:DOGE : It has the support of Elon Musk, but like XRP and MATIC, it is a heavy truck that doesn't move much except for rare pumps. Not really a meme.
- SEED_DONKEYDAN_MARKET_CAP:BONK : This coin suffers from a lot of competition. Being on the CRYPTOCAP:SOL chain only is hard because of the heavy competition. It is on all exchanges, so it is still strong, but what about its future? It is a new coin, and most memes are launched on $SOL. Their stacking does not show any APR%? Red flag for me. Community is fake, check TG, only bots there.
- CRYPTOCAP:WIF : Manipulated coin. Check the website and the tokenomics; it will die before the end of this cycle if nothing changes.
- CRYPTOCAP:PEPE : Copyright infringement. Overvalued and at risk of disappearing if the author sends a DMCA notice to exchanges. I do not gamble my money with this coin.
- $BRETT: Supported by a lot of influencers at the moment. Attempting to be a legal CRYPTOCAP:PEPE by changing the color. Copyright is still infringed. Also, it is on Base. Will not last if Base doesn't last. Risky.
---------------------------------------
If nothing major happens to CRYPTOCAP:BTC (such as a huge dump resulting in a flash drop to 50k), we are set for a massive leg up.
TPs are the Fibonacci levels, you can read them on the chart.
DYOR. Nothing is certain with crypto, so be careful when investing.

Meme Coins: What’s Behind the Curtains ?Have you ever wondered how meme coins keep pumping? Are people really getting rich from them?
How the Pumps are Made ?
Step 1: Establishing Credibility
First, the creators spend significant investment capital to demonstrate good credibility. This ensures that the strongest platforms list them. During the Initial Public Offering (IPO), coins are sold massively to investors. However, as their is no more buyers, prices begin to decline.
Step 2: Accumulation Phase
Next, the coin enters an accumulation phase where big whales start buying from bored speculators at the lowest prices. The whales objective during this phase is to accumulate the maximum quantities for the lowest price possible. The long accumulation time will breakdown the enthusiasm of the speculators , selling their coins for a loss or no profits.
Step 3: Controlling Supply and Demand
When accumulation reaches its peak, the whales start withdrawing their coins from the platform, leaving the market with small quantities. They then inject a significant amount of capital, such as $1 million, causing the price to take off.
Step 4: Advertising
Following this, the coin creators and whales invest heavily in advertising , attracting a big community and more investors. This new crowd keeps injecting liquidity into the pumps, leading to noticeable price increases.
Getting Rich Quick?
Can you get rich quick from meme coins? The reality is nuanced. Even if speculators buy at the bottom, their investments are often too low, leading them to sell at modest gains during the pumps. On the other hand, people who buy after a 1000% increase are typically looking for substantial returns. However, their small capital makes even a 5x return seem insufficient.
The meme coin trend is aggressive and driven by a powerful crowd. While investing in these coins can bring profits, it’s essential to remember that you are always at the mercy of the whales. If they decide to sell off, the market can crash just as quickly as it pumped. Therefore, caution and awareness of the market dynamics are crucial when dealing with meme coins.

FLOKI Bullish Channel: Pump Incoming?With BTC reversing after weeks of selling, it's to be expected that alts will follow suit.
FLOKI has reversed from the bottom support of the bullish channel, making way for a move towards the top resistance.
I'm waiting for a small drop in order to enhance the R/R of this trade. Target around the top resistance, stop below the recent swing low.

Alikze »» DOGE |Descending channel movement scenario🔍 Technical analysis: Descending channel movement scenario
- According to the analysis presented in the 4H time frame in the previous post, it faced selling pressure after hitting the supply zone and failing to break it.
- The projected downward path is in accordance with the movement path after the break of the green box area, and touched the 0.12590 area and the second green box area.
- But currently, according to the correction structure, if the green box area is broken, the correction will continue.
- Therefore, as long as it is below the Fibo area of 1.618, the first target close to it can be the range of 0.097 and then the specified Fibo 100 range of 009214.
Considering that it is moving in a descending channel, the Fibo 100 zone can collide with the bottom of the descending channel.
💎 Alternative scenario: In addition, if it can stabilize the neckline or Fibo range of 1.618 towards the break and above it, it can be the first target of the ceiling of the descending channel and the range of 0.1464.
»»»«««»»»«««»»»«««
Please support this idea with a LIKE and COMMENT if you find it useful and Click "Follow" on our profile if you'd like these trade ideas delivered straight to your email in the future.
Thanks for your continued support.
Best Regards,❤️
Alikze.
»»»«««»»»«««»»»«««

Alikze »» 1000PEPE | Pull Back to the broken structure🔍 Technical analysis: Pull Back to the broken structure
- In the frame time frame, a five -wave cycle has completed the upward movement.
- It is currently moving in a mid -time uptrend.
- After several reactions to the major roof, it eventually faces pressure in the middle of the channel and is now on the uptreen floor.
- This short return can continue the correction after the money to the broken structure, by failing the channel to the origin of the Movement and the Buyer Zone.
💎 Alternative scenario: can test the fiber range of 2.618 and the middle of the channel if it can break the supply area.
»»»«««»»»«««»»»«««
Please support this idea with a LIKE and COMMENT if you find it useful and Click "Follow" on our profile if you'd like these trade ideas delivered straight to your email in the future.
Thanks for your continued support.
Best Regards,❤️
Alikze.
»»»«««»»»«««»»»«««
BINANCE:1000PEPEUSDT.P

Alikze »» SHIB | Bullish Flag🔍 Technical analysis: Bullish flag in corrective zigzag wave 4
According to the analysis presented in the previous post, wave 3 or rising C in the area of 2.618 Fibo of the previous wave itself was completed.
💎 But now in the 1D time frame a bullish flag is formed in the form of wave 4 zigzag.
After exiting the congestion and descending channel in the supply range, it has faced selling pressure.
💎 Therefore, it can be offered after the pullback to the broken structure in the liquidity range by successfully collecting liquidity to break the zone.
💎 In addition, if the candle closes to the sub-zone in the daily time, the bullish scenario will be invalid and should be re-examined and updated.
»»»«««»»»«««»»»«««
Please support this idea with a LIKE and COMMENT if you find it useful and Click "Follow" on our profile if you'd like these trade ideas delivered straight to your email in the future.
Thanks for your continued support.
Best Regards,❤️
Alikze.
»»»«««»»»«««»»»«««

Alikze »» TURBO | 4H descending channel🔍 Technical analysis: Moving in the descending channel
- The daily frame time is moving in an upstream channel.
- But in the 4H frame time, there is a corrective form that is moving within a downtrend.
- This correction can first touch the range of 0.003052 if it is below the supply area and can extend this correction to the middle of the channel if continued.
💎 Alternative scenario: Also, if it can break the 0.0061 area, it could form an upward flag pattern that can continue the uptrend and continue its growth channel as much as the channel supply.
If the behavior and structure of the post will be updated, it will be updated.
»»»«««»»»«««»»»«««
Please support this idea with a LIKE and COMMENT if you find it useful and Click "Follow" on our profile if you'd like these trade ideas delivered straight to your email in the future.
Thanks for your continued support.
Best Regards,❤️
Alikze.
»»»«««»»»«««»»»«««

FLOKI Prints Bullish MACD Crossover On The Daily Chart — 15% PotHere are the details 👇
FLOKI printed a bullish MACD crossover on the daily chart. Simplified speaking, this happens when a shorter-term moving average moves above a longer-term average. Practically, it tells you that the token is gaining some upward momentum. Additionally, many market participants use the MACD to time their entry.
Backtest Details 🧐
On the daily chart, FLOKI has flashed the signal 11 times so far. FLOKI gained more than 2% in 10 out of 11 and more than 5% in 9 out of 11 signal occurences. However, the results for achieving more than 10% are slightly weaker (7 out of 11).
What about the chart 📊
FLOKI has found a local bottom at 0.00016 and should reverse from here. The first resistance is 0.0002, followed by 0.0003.
Potential & Approach 💰
The signal is calculated with a 15% profit potential, which is equal to the resistance at 0.0002. Therefore, a reasonable approach is to set a first take-profit target at the 0.0002 resistance and the second at 0.0003.

FLOKIUSD 1WFLOKI ~ 1W
#FLOKI We are still bullish here. As long as the price maintains this pattern.
buy in stages with a target of at least 15%+ from here.

#FLOKI / USDT inverted head and shoulder. What is next?CRYPTOCAP:FLOKI gained 20% yesterday, indicating that its previous consolidation phase has ended. Are we going to see more uptrend?
What do we know?
CRYPTOCAP:FLOKI has a motivated team with a roadmap to become the most traded crypto in the world!
CRYPTOCAP:FLOKI has just been listed on Coinbase perp futures, similar to CRYPTOCAP:BONK and $PEPE. This shows that it is likely following in their footsteps, albeit a little later; both saw a 50% increase after their listings.
CRYPTOCAP:FLOKI has some utility compared to other memes, with integration into TokenFi, use as the native currency of Valhalla (a metaverse), and other projects.
Regarding the charts, I see an inverted head and shoulders pattern, a bullish signal with a target of 0.0004754, which represents a 65% pump. This aligns with the pumps seen in CRYPTOCAP:PEPE and CRYPTOCAP:BONK after their Coinbase listings.
I also see a parabolic trend that seems to continue for now.
There is a bearish divergence due to a CRYPTOCAP:BTC dump, which pushed down the RSI in the middle of the uptrend. In my opinion, this will not have any lasting effect since it was due to an external, temporary factor, but it needs to be mentioned.
The take profits are the fib extension.
Not a financial advice, DYOR.

FLOKI/USDT Technical Analysis: Potential for a 100% Rally!Hello everyone, I’m Cryptorphic.
For the past seven years, I’ve been sharing insightful charts and analysis.
Follow me for:
~ Unbiased analyses on trending altcoins.
~ Identifying altcoins with 10x-50x potential.
~ Futures trade setups.
~ Daily updates on Bitcoin and Ethereum.
~ High time frame (HTF) market bottom and top calls.
~ Short-term market movements.
~ Charts supported by critical fundamentals.
Now, let’s dive into this chart analysis:
FLOKI is 57% below its all-time high of $0.000349. Currently, it is holding decent support at $0.000155, and a bounce-back is likely. The 200 EMA stands as resistance at around $0.000195 for FLOKI.
The RSI is currently at 40.01, suggesting that the price is in the neutral zone. There is room for upward momentum before reaching overbought conditions, which supports the bullish outlook.
Historical Price Movements:
~ First Bullish Leg (March 2024): The price surged by 162.82%, breaking out from a consolidation pattern and hitting a high of 0.00018581 USDT. This significant upward movement indicates strong buying interest.
~ Second Bullish Leg (May 2024): After a correction, the price saw another substantial increase of 154.55%, reaching 0.00019760 USDT. This confirms the ongoing bullish sentiment in the market.
~ Third Bullish Leg (Projected): The projected price action suggests a potential rise of 117.71%, targeting 0.00018233 USDT. This projection is based on the continuation of the ascending channel pattern and historical performance.
Invalidation Point: A breakdown and close below the mentioned support line.
DYOR. NFA.
Please hit the like button to support my content and share your thoughts in the comment section. Feel free to request any chart analysis you’d like to see!
Thank you!
#PEACE

Floki Short PositionAccording to the behavior of the Bitcoin currency and the liquidity that is leaving the market. We also get the shorts position for Floki

#FLOKI/USDT#FLOKI
We have a descending channel pattern on the 4-hour frame, the price is moving inside it and adhering to its borders well
We have a support area in green at a price of 0.000150 after the price touched it and rebounded from it
We have a trend to stabilize above the moving average 100
We have a downtrend on the RSI indicator that supports the price upwards
Entry price 0.0001641
First target 0.0001914
Second target 0.0002530
Third target 0.0002970

FLOKI FLOKI sweep the channel pattern high side liquidity. So downside movement was high possible.
Or If FLOKI moving countinues upside, next mitigate orderblock (1&2) to moving downside is high possible.
Because the trend was still bearish.

FLOKI FLOKI sweep the channel pattern high side liquidity. So downside movement was high possible.
Or If FLOKI moving countinues upside, next mitigate orderblock (1&2) to moving downside is high possible.
Because the trend was still bearish.

FLOKI FLOKI was moving sideway range. No any further movements and creating channel pattern.
So FLOKI is hunting channel pattern high side liquidity to moving downside is high possible.

FLOKI FLOKI chart showing short term upside momentum. FLOKI mitigating orderblock (1&3) to moving upside.
It's indicating trend reversel. But still order block (2) and Inducement (💎) was available.
So FLOKI moving definitely upside and mitigating orderblock (2) to moving some downside is high possible.

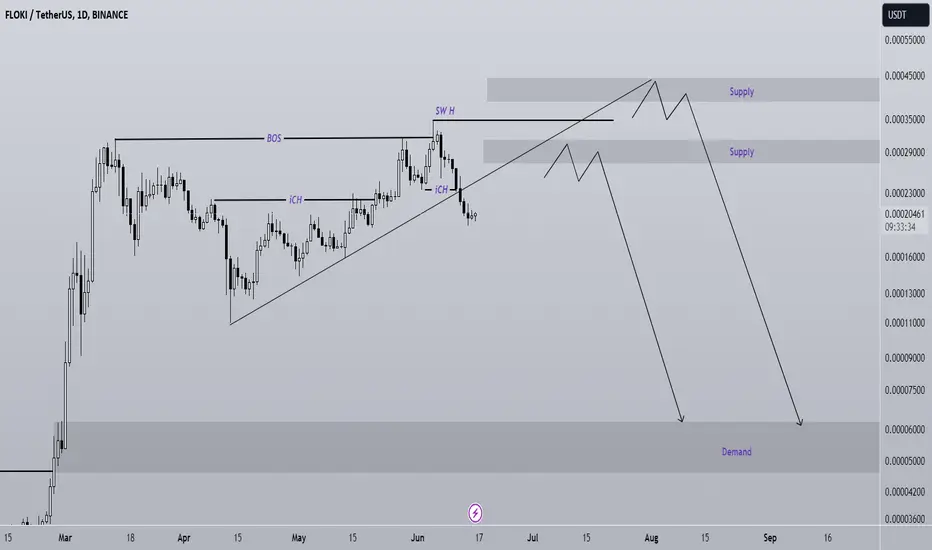
FLOKI analysisAfter the bearish iCH in the internal structure, the price has created an internal pullback.
A trend line has also been broken, but the bullish momentum is very high. FLOKI's bearish trend is expected to be created from one of the two specified supplies.
By maintaining the resistance swap range, it can drop towards the targets.
The target can be demand at the bottom of the chart
Note that the financial market is risky, so:
Do not enter any position without confirmation and trigger.
Do not enter a position without setting a stop.
Do not enter a position without capital management.
When we reach the first TP, save some profit and try to move the stop continuously in the direction of your profit.
If you have any comments please post them, comments will help us improve our performance
Thanks
FLOKIUSDT.4HExamining the 4-hour chart for FLOKI/USDT offers a detailed glimpse into its current technical landscape, allowing for an informed analysis.
Price Action: FLOKI/USDT is currently trading at 0.00024018, showing a slight increase of 1.99%. The chart indicates a pattern of higher lows, which could be viewed as a bullish signal. However, the price is presently near the support level S1 at 0.00018637, which needs to hold to maintain the upward trajectory.
Resistance Levels: The immediate resistance level R1 at 0.00033719 appears to be a significant barrier from past price interactions. The upper resistance R2 is set along an upward trendline, suggesting that if the price breaks above R1, it may find dynamic resistance as it ascends along this line.
Support Levels: The noted support at S1 is crucial; a breach below this could signal a shift in market sentiment to bearish, potentially leading to further declines. The support levels are critical for determining where buyers repeatedly enter the market, stabilizing the price.
Moving Average Convergence Divergence (MACD): The MACD indicator is below the zero line, which traditionally suggests bearish momentum. However, the MACD line is converging towards the signal line, indicating that the downward momentum may be losing strength, and a potential bullish crossover could occur if the trend continues.
Relative Strength Index (RSI): The RSI stands at 37.22, which is close to the oversold territory (below 30). This suggests that there might be potential for a bullish reversal as the market perceives FLOKI as undervalued.
Conclusion:
The technical outlook for FLOKI/USDT suggests cautious optimism. The near-oversold RSI and the converging MACD indicate potential for a reversal, but the key will be whether the support at S1 holds. If the price sustains above S1 and experiences a bullish MACD crossover, there could be an opportunity to target R1 as the next resistance level. However, if S1 fails, the sentiment might turn bearish, leading to a further decline. Traders should consider setting stop-losses below S1 to manage risk while preparing for a possible ascent towards R1 if upward momentum gains confirmation through technical indicators.

FLOKIUSDT.1DAnalyzing the FLOKI/USDT daily chart, I can see that the price recently peaked at a resistance level marked as R1 and is now retracing. I have drawn a green upward trendline that has been supporting the price movement; however, the current price action suggests a potential test of this support.
If the support holds, I anticipate a rebound towards the R1 level and potentially a move higher to R2. The Moving Average Convergence Divergence (MACD) shows a negative divergence as the MACD line is below the signal line, suggesting bearish momentum in the short term. Additionally, the Relative Strength Index (RSI) is around 54, indicating neither overbought nor oversold conditions but nearing the median, which aligns with a possible consolidation or retracement phase.
Based on the technical indicators and recent price behavior, my conclusion is that the market might experience further downward pressure in the near term. However, the support level delineated by the trendline and the S2 support zone should be monitored closely. A break below these could confirm a bearish trend, while a rebound from them could lead to a recovery back towards R1. The key will be how the price reacts to the trendline in the coming days.

FLOKI is Ready To Push Higher!Hello TradingView Family / Fellow Traders. This is Richard, also known as theSignalyst.
📈 FLOKI has been overall bullish, trading within the rising wedge in orange.
Currently, FLOKI is undergoing a correction phase and it is currently approaching the lower bound of the wedge.
Moreover, it is retesting strong demand zone marked in gray.
🏹 Thus, the highlighted blue circle is a strong area to look for trend-following buy setups as it is the intersection of the gray demand zone and lower orange trendline acting as a non-horizontal support.
📚 As per my trading style:
As #FLOKI approaches the blue circle zone, I will be looking for bullish reversal setups (like a double bottom pattern, trendline break , and so on...)
📚 Always follow your trading plan regarding entry, risk management, and trade management.
Good luck!
All Strategies Are Good; If Managed Properly!
~Rich
