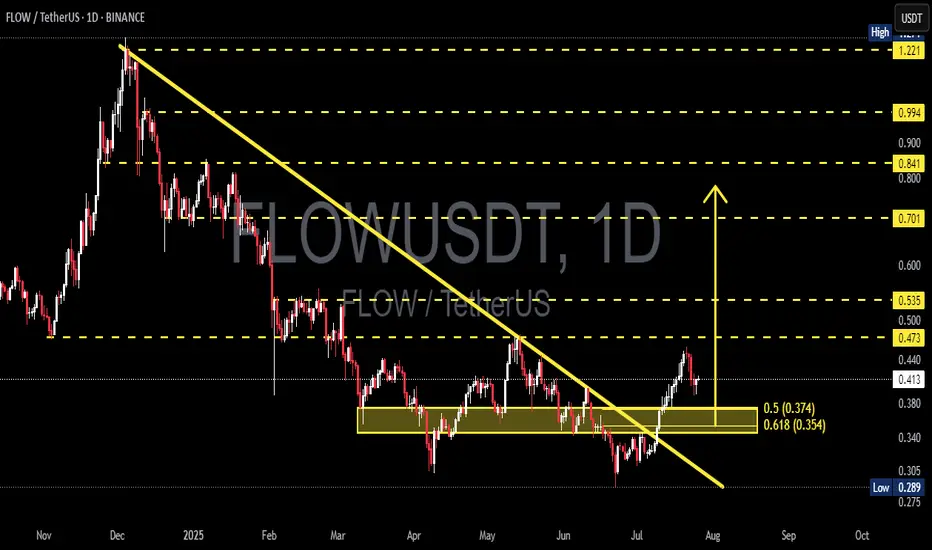
FLOWUSDT Breakout + Golden Pocket Retest: Ready to Explode?After being trapped in a persistent downtrend for months, FLOW has finally shown a major technical signal: a clean breakout from the dominant descending trendline that has defined price action since late 2024.
This breakout isn’t just visually appealing — it’s backed by strong technical confluence, including a key demand zone, Fibonacci retracement support, and potential shift in market psychology.
---
🧠 Technical Structure & Chart Breakdown
📉 Descending Trendline Breakout
The major downtrend line has been decisively broken, indicating that bearish pressure is weakening. This is an early but powerful sign that momentum may now be shifting toward the bulls.
🟨 Consolidation Zone & Flip Area (Yellow Box)
The $0.354–$0.374 zone has acted as:
Former resistance during sideways consolidation
Potential new support after the breakout (support-resistance flip)
📊 Fibonacci Retracement Levels
0.5 Fib = $0.374
0.618 Fib = $0.354
This area, also known as the "Golden Pocket", is one of the most critical levels in technical analysis. It often acts as a launchpad during bullish retests.
---
🟢 Bullish Scenario: Textbook Retest Before a Rally?
If the price holds and reacts positively from the $0.354–$0.374 zone, the following upside targets come into play:
1. 🎯 Target 1: $0.473 – Previous range resistance
2. 🎯 Target 2: $0.535 – Key horizontal level
3. 🎯 Target 3: $0.701 – Historical resistance
4. 🎯 Extended Target: $0.841 – $0.994, potentially up to $1.221 in a strong bullish expansion
For this scenario to play out, bulls must push a daily close above $0.473 to confirm strength and break market structure.
---
🔴 Bearish Scenario: False Breakout Ahead?
If the price fails to hold the golden pocket support:
The breakout could turn into a bull trap
The price may retrace toward:
$0.305 – Local support
$0.289 – The previous low
A strong bearish candle with volume below $0.354 would invalidate the breakout and may signal renewed downward pressure.
---
💡 Conclusion: Critical Decision Point Ahead
FLOWUSDT is now at a pivotal point. The breakout has happened — but the retest zone will decide everything. Will it serve as the foundation for a larger bullish rally, or will it mark the start of another bearish wave?
Watch price action closely around $0.354–$0.374 — that’s where smart money makes their move.
#FLOWUSDT #CryptoBreakout #TechnicalAnalysis #GoldenPocket #RetestZone #FibonacciLevels #AltcoinSetup #CryptoMomentum #FlowAnalysis
FLOWUSDT
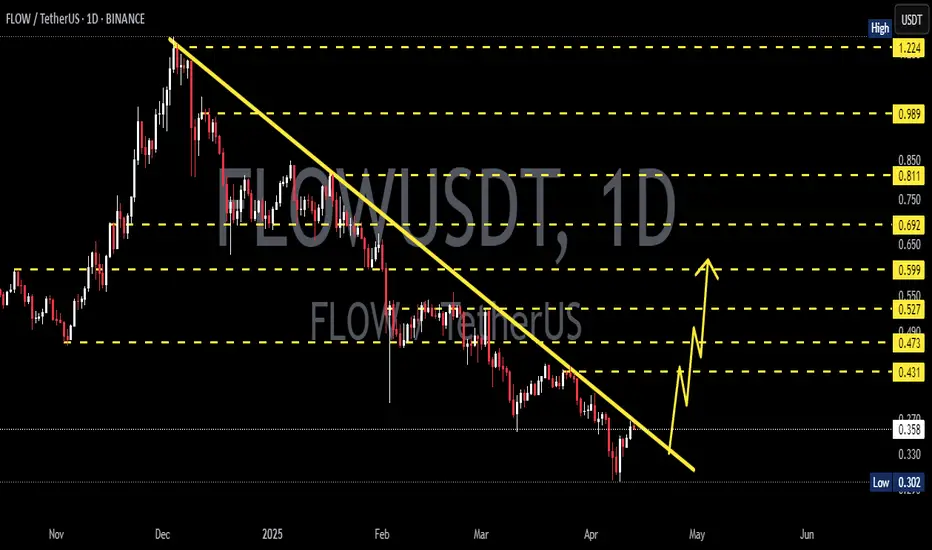
FLOWUSDT 1D AnalysisFLOW ~ 1D Analysis
#FLOW Buy back from this support block with a short term target of at least 15%+ From here.

Flow: Your Altcoin ChoiceBefore starting, I want to show you the linear chart for FLOWUSDT. I always use the log. chart to be able to see the high and lows and the candles more clearly.
When the candles become flat and almost invisible, it means the market is trading at bottom prices. This is FLOWUSDT long-term:
This applies to all pairs and Cryptocurrency projects. When the candles become almost invisible, it means that the current neutral market cycle has been exhausted. Next comes the bull market.
Now we can go to the full chart with all the data and drawings.
The logarithmic chart reveals all the info but it is hard to appreciate how low really a Crypto pair is trading in relation to past action. This is very important if you do your own technical analysis and numbers. This is important if you do your own search for good entry prices. Just go linear and see what the chart reveals.
FLOWUSDT is trading at a new All-Time Low. The ATL session has no bearish volume but instead is about to close green. Bears are gone. They had control of the market for so long, but this is over now.
A new ATL is good because it opens the doos for new players and also maximum growth. A bull market cannot come out of a new All-Time High. Out of an All-Time High, only a bear market can develop. Out of bottom prices, we can see sustained long-term growth. So there is always some positive that can be extracted out of the negative.
When prices are high, all is good because we are growing; there is money and there are profits. When prices are low, all is good because we can prepare for a growth phase. Regardless of how you look at it, everything is always nice, good, positive and great. Adopt the right mentality and you're bound to achieve success.
It is impossible to mistake the action on the chart. A bear market, a sideways market and then comes... A bull market.
» The bear market is marked as (1) on the chart.
» The sideways market is marked as (2).
» The bull market comes next, (3).
I am keeping it simple, because there is not much more for me to say; I am keeping it simple, because simple is best.
Namaste.

FLOWUSDT 1DFLOW ~ 1D Analysis
#FLOW Buy gradually after successfully penetrating this resistant line with a short -term target of at least 10%+.
FLOWUSDT 6DFLOW ~ 6D Analysis
#FLOW This is the lowest support block for now. Buy from here with a minimum target of 20%+.

FLOWUSDT 1WFLOW ~ 1W Analysis
#FLOW In Time Frame 1W re -test this support, buy from here if you still have a conviction on this coin with a minimum target of 20%++

#FLOW (SPOT) IN ( 0.600- 0.750) T.(6.900) SL(0.556)BINANCE:FLOWUSDT
#FLOW/ USDT
Entry ( 0.600- 0.750)
SL 1D close below 0.556
T1 1.100
T2 1.550
T3 2.600
T4 4.100
T5 6.900
______________________________________________________________
Golden Advices.
********************
* collect the coin slowly in the entry range.
* Please calculate your losses before the entry.
* Do not enter any trade you find it not suitable for you.
* No FOMO - No Rush , it is a long journey.
Useful Tags.
****************
My total posts
www.tradingview.com
**********************************************************************************************
#Manta #OMNI #DYM #AI #IO #XAI #ACE #NFP #RAD #WLD #ORDI #BLUR #SUI #VOXEL #AEVO #VITE #APE #RDNT #FLUX #NMR #VANRY #TRB #HBAR #DGB #XEC #ERN #ALT #IO #ACA #HIVE #ASTR #ARDR #PIXEL #LTO #AERGO #SCRT #ATA #HOOK #FLOW #KSM #HFT #MINA #DATA #SC #JOE #RDNT #IQ #CFX #BICO #CTSI #KMD #FXS #DEGO #FORTH #AST #PORTAL #CYBER #RIF #ENJ #ZIL #APT #GALA #STEEM #ONE #LINK #NTRN #COTI #RENDER #ICX #IMX #ALICE #PYR #PORTAL #GRT #GMT #IDEX #NEAR #ICP #ETH #QTUM #VET #QNT #API3 #BURGER #MOVR #SKL #BAND #ETHFI #SAND #IOTX #T #GTC #PDA #GMX #REZ #DUSK #BNX #SPELL #POWR #JOE #TIA #TFUEL #HOT #AVAX #WAXP #OGN #AXS #GALA #ONE #SYS #SCRT #DGB #LIT #QI #FIL #GLMR #ATOM #LTC #MANA #ONT #TLM #SLP #ROSE #NEO #EGLD #CHR #FLOW

TradeCityPro | FLOWUSDT New Weekly Move?👋 Welcome to TradeCityPro Channel!
Let’s analyze the weekly crypto watchlist together during the final hours of the market holiday.
🌐 Overview Bitcoin
Before diving into today’s altcoin analysis, let’s take a quick look at Bitcoin. In the 1-hour timeframe, Bitcoin has broken its trendline but remains below the key resistance level of 98606, which it has been rejected from twice, highlighting its significance.
At the start of the new week, I anticipate a potential upward move, likely during the U.S. session. If Bitcoin breaks 98606, a long position can be opened. If Bitcoin dominance is breaking 57.08 simultaneously, long positions on Bitcoin itself are preferable. Otherwise, if dominance faces rejection or forms red candles, a quick switch to altcoins is recommended.
📊 Weekly Timeframe
In the weekly timeframe, this altcoin, like most of the crypto market, is still in its range box, continuing its oscillation within this boundary.
After breaking 0.674, FLOW attempted to reach the range’s upper boundary but faced rejection. Even RSI was rejected at 70, preventing FLOW from reaching the resistance at 1.460.
On the positive side, during this pullback, the volume of red candles decreased, and FLOW is now at a previous resistance-turned-support level, suggesting the potential for a rebound.
Keep in mind that the main support level is 0.463. If it breaks, exiting this coin would be wise. A re-entry can be considered upon a breakout above 1.460 with momentum confirmation.
📈 Daily Timeframe
In the daily timeframe, after a fake breakdown below the key support level of 0.509, FLOW bounced back strongly, initiating a move toward the resistance at 1.169.
If we use Fibonacci levels (ignoring fakeouts), the 0.7 level emerges as a key support. It acts as a previous resistance-turned-support and aligns with the significant 0.618 Fibonacci retracement level.
The 0.7 level has been tested twice, with the price bouncing each time. If FLOW breaks 0.809, it could start a move toward 0.969 and eventually 1.169.
For spot buying, wait for a breakout above 0.809, with: Risky Stop-Loss: 0.7 Conservative Stop-Loss: 0.509 For futures trading, consider a position after a breakout above 0.809.
The resistance level at 0.809 is crucial, offering a solid opportunity for both spot and futures trades.
📝 Final Thoughts
Stay calm, trade wisely, and let's capture the market's best opportunities!
This analysis reflects our opinions and is not financial advice.
Share your thoughts in the comments, and don’t forget to share this analysis with your friends! ❤️

FLOW can fly !#FLOW has similar pattern to many alt coins the correction waves made a good potential for a big rising wave but i think there should be another drop before the big rise !

#FLOW (SPOT) entry range (0.480- 0.580) T.(1.183) SL(0.437)BINANCE:FLOWUSDT
entry range (0.480- 0.580)
Target1 (0.658)- Target2 (0.913)- Target3 (1.183)
SL .1D close below (0.437)
*** Collect in the entry range ****
**** #Manta ,#OMNI, #DYM, #AI, #IO, #XAI , #ACE #NFP #RAD #WLD #ORDI #BLUR #SUI #Voxel #AEVO #VITE #APE #RDNT #FLUX #NMR #VANRY #TRB #HBAR #DGB #XEC #ERN #ALT #IO #ACA #HIVE #ASTR #ARDR #PIXEL #LTO #AERGO #SCRT #ATA #HOOK #FLOW ****

Flow/USDT: Preparing for a Breakout Opportunity
Flow/USDT is approaching an interesting phase as it moves closer to a significant resistance level. The chart shows consolidation, indicating potential energy build-up for a breakout.
Key observations:
- Flow/USDT is testing a resistance zone that has held strong in previous attempts. A successful breakout could result in a bullish move with considerable potential.
- Momentum indicators such as RSI and MACD suggest growing bullish sentiment, increasing the likelihood of upward movement.
- A volume surge during the breakout would confirm buyer strength and validate the move.
Strategy:
- Wait for a clear 4-hour or daily candle close above the resistance to confirm the breakout.
- Consider entering after a retest of the resistance as new support, which often provides a safer entry point.
- Use stop-loss orders below the breakout level to manage risk effectively.
- Watch for fake breakouts; avoid entering prematurely without proper confirmation.
Potential targets:
- First target: .
- Second target: .
This is for educational purposes only. Always conduct your own research and trade with caution.

FLOWUSDT Reversal Confirmed!FLOWUSDT technical analysis update
The price of FLOWUSDT has formed a triangle pattern at the bottom, with the 100 EMA acting as resistance for the past 150 days. Now, the price has broken through the triangle's resistance and crossed above the 100 EMA on the daily chart. In the coming days, we can expect a strong bullish move.

Double bottom on weekly TF on $FLOWPrevious analysis on AMEX:FLOW worked like a charm .
-Double bottom on weekly TF
-Bull seazon started
Target 1:
1.44-1.68
Target 2:
2.62-2.92

FLOWUSDTFLOW ~ 1W
#FLOW If you have Conviction on this coin,. You can place purchases on this support block. previously the price bounced quite strongly from here.

Huge move for FLOW is comingFollow the FLOW, another beautiful base which should break up sooner or later. Playing spot here. Nice PA and TA.
NOT A FINANCIAL ADVICE + MANAGE YOUR RISK AND USE STOPLOSS

monthly time frame, FlowUsdtmonthly time frame,good candles are a sign of a good price rise
#spot
#flowusdt

FLOWUSDTFLOW ~ 1W
#FLOW If you have Conviction on this coin,. You can place purchases on this support block. previously the price bounced quite strongly from here.

FLOW Technical AnalysisFLOW/USDT has been in a prolonged downtrend, with the price consistently respecting a descending resistance trendline since March 2024. Currently trading at $0.537, the pair is approaching key resistance near $0.593, where it has previously been rejected multiple times. The failure to break above this level continues to reinforce the bearish sentiment. The market is watching closely for a breakout above this trendline, which could signal a potential shift in momentum toward the upside.
On the downside, FLOW has found support in the $0.471-$0.507 range naked , highlighted by the yellow zone on the chart. This area has held firm during recent pullbacks, preventing further declines. If the price fails to break through resistance and reverses from current levels, a retest of this support zone seems likely. A break below this key support could push the price toward the next critical level at $0.390, where further bearish movement might slow down.
Despite the ongoing bearish trend, a breakout above $0.593 and the descending channel upper boundary would open the door for a potential rally. The next major resistance levels sit at $0.683 - $0.711, highlighted by the green zone on the chart, offering targets for bulls if the market shifts in direction. Until this breakout happens, the overall trend remains bearish, and traders should approach with caution, particularly around the critical support and resistance zones

#FLOWUSDT Ready for an Imminent Breakout or Fall? Key Insights Yello, Paradisers! Are you ready for a potential bullish surge with #FLOWUSDT? Let's look at the latest analysis of the AMEX:FLOW and find out what's happening:
💎Currently, #FLOWUSDT is showing strong potential for a bullish continuation from a critical demand zone at $0.519. We’ve been closely monitoring this asset as it follows a falling wedge pattern, and it's attempting a breakout from this formation. The next key target for #FLOW after a successful breakout is the internal minor resistance at $0.725.
💎If AMEX:FLOW can hold firm above this level, we could be on the verge of a significant bullish rally, echoing past market moves. Breaking above the crucial resistance at $0.725 could clear the path toward even higher resistance zones, opening up opportunities for further gains.
💎However, caution is essential. If momentum weakens at this critical demand zone, we might see a pullback to the lower demand area around $0.438.
💎Keep a close watch on #FLOW's price action. A daily close below this demand area could invalidate our bullish scenario, potentially leading to further declines.
Stay focused, patient, and disciplined Paradisers.
MyCryptoParadise
iFeel the success🌴

Flow coin zones for ProfitBINANCE:FLOWUSDT
Possible Targets and explanation idea
➡️2 main signals to buy was on Weekly timeframe based on Trade On indicator
➡️We formed big divergency on weekly (ADZ indicator) showing where whales accumulate coin
➡️Market Mood (also in accumulation stage)
➡️Targets bearish around 0.30 cents if market drop. Bullish marked above
➡️Road is open to close weekly gaps and touch "Take profit" indicator line (top blue line) where will be time out of FLOW for 2023
Hope you enjoyed the content I created, You can support with your likes and comments this idea so more people can watch!
✅Disclaimer: Please be aware of the risks involved in trading. This idea was made for educational purposes only not for financial Investment Purposes.
---
• Look at my ideas about interesting altcoins in the related section down below ↓
• For more ideas please hit "Like" and "Follow"!

FLOWUSDT 2DFLOW ~ 2D
#FLOW Trying to break through this resistance line.
This I am Bullish as long as price Continues to maintain above this resistance line.

#FLOW/USDT#FLOW
The price is moving in a descending channel on the 12-hour frame and we are about to break it
We have a bounce from a major support area in green at 0.480
We have a downtrend on the RSI indicator that has been broken upwards
We have a trend to stabilize above the moving average 100 which supports the rise
Entry price 0.600
First target 0.800
Second target 0.945
Third target 1.12

Flow's Next Big Move: Bullish Surge or Deep Correction?Yello, Paradisers! Have you been tracking #FLOWUSDT? If not, now's the time to pay attention! This cryptocurrency is showing promising signs of a bullish continuation from its current support, and you won't want to miss it.
💎#FLOWUSDT recently broke above a critical resistance level at $0.647, signaling a strong upward movement. This breakout marks a crucial moment for potential gains, as resistance has now turned into support. If #FLOW maintains this momentum, we could see a surge toward the Fair Value Gap (FVG) at $1.045. This level will be pivotal in determining the next phase of market action.
💎Market sentiment also appears to be shifting, with diminishing intensity of rejections at the resistance zone, suggesting a possible ease in selling pressure. If the price of #FLOW fails to sustain momentum at the support level of $0.647, we are looking for a bullish rebound from the lower demand zone at $0.539.
💎However, it's crucial to be cautious. A breach below the demand level at $0.539 could lead to a significant decline. This demand zone is critical as it holds substantial liquidity, making it a potential point for either a bullish recovery or a deeper correction.
Strive for consistency, not quick profits. Treat the market as a businessman, not as a gambler. This is the only way you will make it far in your crypto trading journey. Be a PRO.
MyCryptoParadise
iFeel the success🌴
