GOLD 1H: Fibo speaks louder than words - $3365 in focusGold is testing the upper zone near $3362–3365, which is just above the 0.5 Fibonacci level ($3353) from the previous impulse. The price has already bounced from the top of the channel, indicating potential exhaustion of the current upward move.
Technicals:
- MA50 and MA200 are below the price — bullish trend intact
- RSI is cooling down from overbought territory
- Fibo 0.5 ($3353) was breached, but no clear confirmation yet
- Channel resistance remains unbroken
Plan:
- If price rejects $3365, targets are $3340 and $3314
- If price holds above $3365, next move could be toward $3377+
- EMA structure supports further upside, but caution is needed at this zone
Gold isn’t shouting - it’s whispering key levels. Listen closely.
Followme

EURJPY SWEET BLUESEurjpy has hit all take profits with very little drawdown and huge profits very quickly nice pattern, simply followed

ABCL: When biotechnology not only curesABCL: When biotechnology not only cures, but also makes your wallet happy!
Hello, fellow investors and those who just like to tickle your nerves on the stock exchange!
Today we have on our agenda (and on the chart) - the stock AbCellera Biologics Inc. (ABCL), which seems to have decided to prove that even at the bottom there is life, and then even throw a party with a breakthrough!
As you can see, our hero ABCL has been playing ‘hide and seek with the trend line’ for a long time, showing an enviable resilience in the fall, just like your sofa after a day at work. However, if you look closely, the ‘ma/ema below price’ signalled that buyers, like secret agents, had already taken control of the situation, preparing for the decisive throw.
And here it is, it's happening! The recent ‘breakout + retest’ is not just a technical term, but a real escape from the ‘bearish’ prison with a subsequent test of strength. Not only did price break through resistance, but it came back to see if it was indeed broken. It's like going out of the house, forgetting your keys, coming back in, getting them, and then going out again - only in the stock market it's a sign of strength and determination!
Now that the dust has settled and the ‘1d’ trendline is behind us, our sights are set on the upside. Targets? Of course! ‘tp1-4.81’ and ‘tp2-6.00’ are not just numbers, they are potential points where we can pat ourselves on the shoulder and say, ‘I told you so!’. А ‘2,618 (6,61)’ - is for the very brave and patient who are willing to wait for the true bull dance.
All in all, ABCL seems to have turned a page in its history, swapping sad ballads for upbeat dance hits. But remember, friends: the market is a capricious thing, and even the most beautiful charts can bring surprises. So, act wisely, don't forget about risks and, of course, enjoy the process! Have a good trading!

Airbnb: Proof that even stocks love to traveThe analysis of Airbnb (ABNB) stock reveals an intriguing setup following the breakout and retest of a key resistance level, which previously acted as a trendline on the daily chart. After successfully breaking above this line and confirming it with a retest, the price is now showing potential for further upside — aligning with a bullish scenario that targets the $164 area, which also coincides with the 1.0 Fibonacci level (164.12).
The current structure suggests the beginning of an upward movement after a period of consolidation, with both the 50-day and 200-day moving averages (MA50 and MA200) positioned to support further growth, reinforcing the overall bullish outlook.
Notably, trading volume has increased in line with the breakout and continued price movement, adding confidence to the scenario playing out toward the higher targets. Key Fibonacci resistance levels to watch next include 0.786 (150.37) and 1.272 (181.61), with a long-term extension target at 1.618 (203.85).

Trade Reflection & Overview – Final Thoughts on the Day’s SetupIn this final video, I’m reflecting on the trade and the key lessons learned throughout the session. Looking back, I realize I should have taken profits when price tested the 9:33 AM fair value gap, which would have given us a nice profit. Although I expected lower prices, considering we had a bearish daily bias, I underestimated the strength of the daily fair value gap, which had already been tapped multiple times. Price held above the 50% level, and that was a strong signal for higher prices.
Additionally, the double top formation near Monday’s buy-side liquidity could have been a target for price, which adds to the case for a reversal higher. Despite missing some potential profit, we ended the day with a total of $50,723.16 in profit.
Looking ahead, the focus is on consistent trades, avoiding FOMO, and maintaining solid setups that make sense. I’m committed to sticking with MNQ for now, refining my confidence in the setups and building a steady rhythm. Once we’re fully confident and have more capital, I’ll look to take on more risk, but for now, the goal is simple — keep it consistent and avoid repeating past mistakes.
This is the year of building profitability and consistency, and I’m ready for the journey ahead.
Trade Overview:
Profit: $200
Account Balance: $50,723.16 for the day
Reflections: Missed opportunity to take profits at key levels
Next Steps: Focus on solid setups, consistency, and avoiding FOMO
Trading Plan: Sticking with MNQ for now, working on building confidence and rhythm.

Gold 8H – Probable Scenario Until the End of May 2025Briefly today!
Greetings, let’s take a look at the current situation for gold.
Technically, we can see a classic symmetrical triangle forming on the 8-hour chart, with a support zone established in the 3291–3300 range.
I'm expecting a move towards the 3440–3450 area, followed by a retest and an upward push toward the 3833 level.
Fundamentally, we take into account Trump's policy stance and the ongoing conflict between Pakistan and India.

Gold Buy/Sell Zone Bana Diya Ha Kya Yahaan Sa Trade Leba Safe HaGold ka latest price action dekhte hue maine TradingView par Buy aur Sell zones clearly mark kar diye hain.
Iss chart idea mein aapko milega:
✅ Fresh zones jo price respect kar sakta hai
✅ Kya aap is zone ko dekh kar trade le sakte ho?
✅ Confirmation signals ka short breakdown
✅ Risk management aur entry tips
Agar aap Gold (XAUUSD) mein trading karte ho to yeh chart aapke liye game-changer ban sakta hai.
Chart idea check karein, analysis samjhein aur informed decision lein!
📈 Follow karo aur ko like/share karna na bhoolein!
#GoldAnalysis #XAUUSD #BuySellZone #TradingView #PriceAction #ForexTrading #GoldTrade

XAU/USD Short Setup | M15 Trend Reversal OpportunityGold (XAU/USD) M15 timeframe par bearish signals show kar raha hai. Price ne key resistance zone reject kiya hai aur lower highs bana raha hai — possible short opportunity.
Trade idea includes:
Resistance rejection
Bearish candlestick pattern
Volume confirmation
Tight stop loss & clear TP levels
Disclaimer: Educational purpose only. Always manage your risk and use proper risk-reward ratio.

DOGEIn my opinion, Dogecoin needs to confirm a breakout and hold above the $0.205 resistance level. After that, we can expect a bullish outlook for Dogecoin, targeting the $0.30 to $0.339 range. Additionally, holding the $0.16 support level is crucial. The scenario I have outlined on the chart may play out, but only if the conditions mentioned above are met. What do you think? Share your thoughts with me.

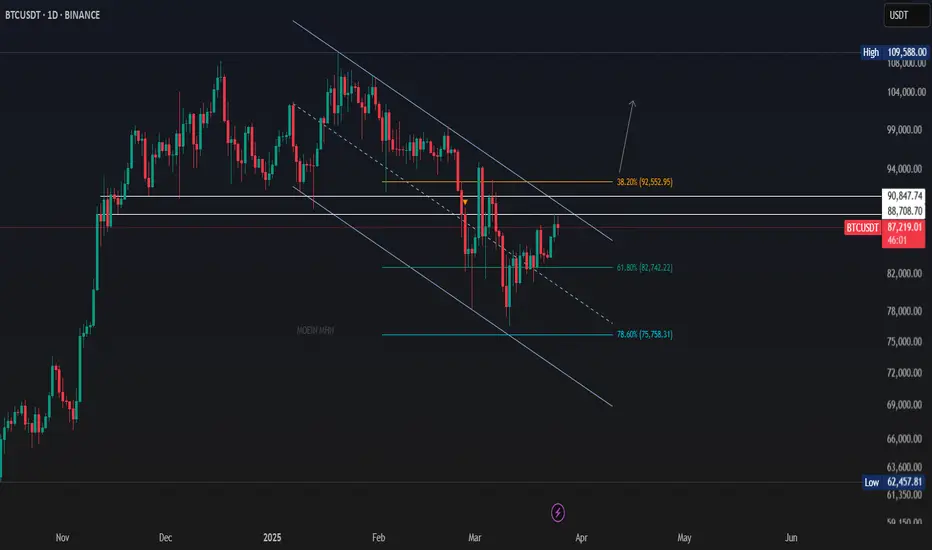
BTC Bitcoin has followed previous analyses and predictions well so far. I believe that breaking the $91,000 level, which is the most significant resistance ahead, could reinforce the expectation of a strong trend reversal in Bitcoin.
Daily bias for Spot gold #xauusd I have spotted an absolute Low so we should definitely see some bullish pressure on gold for the rest of the day
Take a look at my markup as I have marked previous day high and low and from experience determined that the previous days low is an absolute low so we should definitely see some bullish pressure building up as the day goes on.

USD/JPY – Precision Short Trade Breakdown🔥 Executed a precise short trade on USD/JPY this morning, aligning with institutional order flow and Prime Market Terminal insights. Here’s the full breakdown of how this setup played out!
🔍 Trade Setup & Analysis:
📌 Entry: 149.300 – Price rejected a key supply zone & Fibonacci retracement level.
📌 Stop Loss: 149.558 – Above key liquidity & invalidation area.
📌 Take Profit: 148.504 (first TP), 148.213 (final target).
📌 Risk-Reward Ratio: 1:3
📊 Prime Market Terminal Insights That Confirmed This Trade:
🔻 Institutional Positioning & Market Flow:
✔ Smart Money Report:
Large institutions were heavily net short USD/JPY, with leveraged funds reducing their long exposure.
Dealer intermediaries (banks and liquidity providers) also added more short positions, indicating further downside momentum.
✔ COT (Commitment of Traders) Data:
Open interest showed a significant drop in long positions, suggesting weakness in USD/JPY.
Hedge funds and asset managers increasing short exposure aligned with my bearish bias.
✔ DMX Open Interest:
66% of institutional traders were short on USD/JPY, confirming my sell-side setup.
Short positioning had increased by 34% in the last session, reinforcing my downside expectation.
🔻 Volatility & Liquidity Insights:
✔ Average True Range (ATR) Analysis:
ATR showed a high probability of an extended move, suggesting the potential for price to hit my targets.
Recent daily ranges indicated USD/JPY had room to move another 100+ pips to the downside.
✔ Session Range & Market Structure:
Liquidity grab above 149.300 supply zone, followed by strong rejection and sell-off.
Previous session lows were swept, indicating smart money targeting deeper liquidity.
Institutional orders clustered around 148.200, suggesting a likely downside target.
🔻 High-Impact News That Influenced USD/JPY:
📢 Japanese Unemployment Rate (Actual: 2.5% | Forecast: 2.5%) → No surprise, minimal impact.
📉 Business Capex (MOF YY) (-0.2% vs. 8.1% previous) → Indicated economic slowdown, weakening JPY demand.
📰 U.S. Economic Data Later Today:
Redbook YY (USD) expected at 6.2% – could impact USD sentiment.
Fed’s Williams speech on monetary policy could affect USD volatility, reinforcing our bias.
🎯 Trade Execution & Outcome:
✅ TP HIT! Price dropped as expected, hitting both targets with precision.
🚀 Perfect confluence of:
✅ Smart money selling pressure
✅ Liquidity sweep & supply zone rejection
✅ High-probability move from ATR analysis
📸 Prime Market Terminal Screenshots Included:
📊 DMX Open Interest → Confirmed institutions were net short.
📊 COT Data → Showed decline in long positions.
📊 ATR & Volatility Charts → Supported extended downside movement.
📊 Session Ranges & Market Structure → Confirmed liquidity grab & supply zone rejection.
🔑 Key Takeaways from This Trade:
✔ Trade with institutional momentum – Always check positioning before entering!
✔ Multiple confirmations = High probability setups – Don’t rely on a single indicator.
✔ Liquidity is key – Smart money moves price to hunt liquidity, trade accordingly.
✔ Fundamentals matter – Weak JPY capex data helped push price lower.
💬 What’s your view on USD/JPY? Will we see further downside? Drop your thoughts below!
📊 Follow for more trade setups, market analysis & strategy breakdowns!

BITCOIN Hi friends, I think Bitcoin could form an inverse head and shoulders pattern, provided it holds the $82,000 level and breaks through the $87,000 resistance. After that, we could see Bitcoin’s price rise to $95,000. What do you think? Please share your thoughts in the comments.

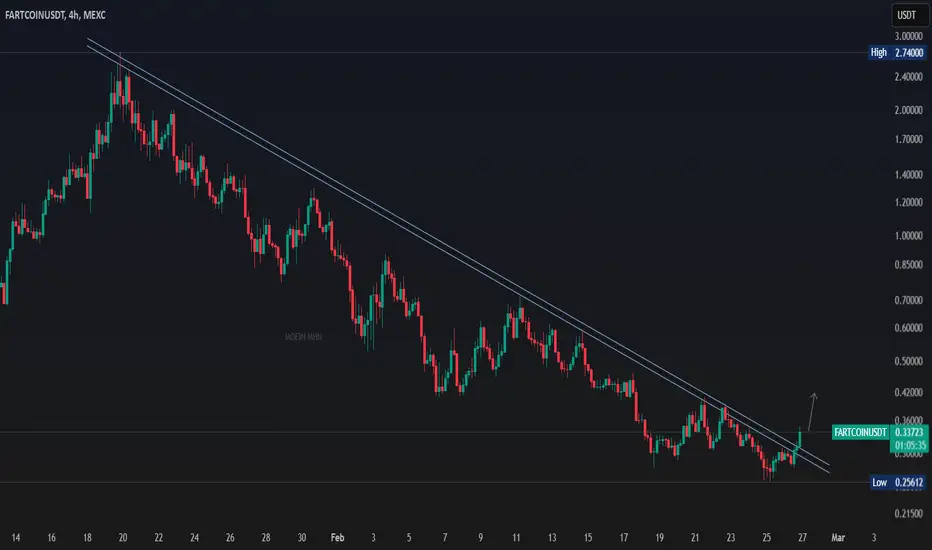
FARTCOINFARTCOIN has broken out of its descending trendline, which could be a positive signal for this coin and potentially lead to a price increase.
BTCHi friends, I think Bitcoin has formed a descending channel and can continue its downtrend until it reaches the bottom of this channel. What do you think? Please leave your thoughts in the comments.

BNX Soars to New Heights: A Strong Uptrend Signals Promising FutHi everyone!
BNX is on uptrend and is the perfect moment to buy with price target 1.23.
Shorting this coin would be a massive mistake as smarts money plan is to sweep the shorts!!
Chart looks bearish but don't fall in to their trap!
If you open a long position make sure you are covered for at least 25% drop. Avoid the high leverage! Remember profit is greater that loss.
We are not day traders. just profitable traders!
Our job is to identify the trend.
Trade safe

Do not short this coin yet!!! Hi everyone,
We totally understand how much you want to short this coin at this point, but we strictly suggest to hold your horses as it will push higher..
Instead if it will try to grab the longs (drop it) Buy the dip. And when i say the dip we talking about 5.7 entry even lower if possible, with spreading your capital.
This coin is still on uptrend!
More updates are coming for this coin.

TAOI think TAO can complete this scenario. The RSI has also broken its trend and is moving above 50. In my opinion, TAO’s next target is the top of the channel, which is in the range of $650 to $750, provided the $358.5 support zone holds.
Good luck! This analysis reflects only my personal opinion, and you are responsible for your own trades. Please share your thoughts with me.

BB / USDTI believe Bitcoin has the potential to complete this scenario, and I think it is a good buying opportunity as it has approached its demand zone. What do you think? Please share your opinion with me.

DOGE-USDTDogecoin, after a 45% correction in its price, has started forming an ascending channel. The next target for Dogecoin could be the upper boundary of the channel, provided the $0.2393 support level holds. In my opinion, we can consider making an initial buy here, although the subsequent buy levels are also marked on the chart.
Good luck! This analysis reflects only my personal opinion, and you are responsible for your own trades. Please share your thoughts with me.

DENTDENT is in a downtrend, and as long as it does not break out of its descending trendline, there is still the potential for further correction in this token. Additionally, the first support level is around the price of $0.0012, which is crucial to maintain.
Good luck! This analysis reflects only my personal opinion, and you are responsible for your own trades. Please share your thoughts with me.

Bitcoin to 120k ?Bitcoin, in the long-term timeframe, is moving within an ascending channel. As long as the price trades above $100,000, Bitcoin's target remains the upper boundary of this ascending channel. However, if the daily timeframes close below $100,000, it is likely that a short-term corrective trend will form in Bitcoin's price.
Good luck! This analysis reflects only my personal opinion, and you are responsible for your own trades. Please share your thoughts with me.
