AUDJPY 1D: breakout toward 100–105AUDJPY has confirmed an inverse head and shoulders breakout on the daily chart, with a strong move above the neckline. All key moving averages, including MA50 and MA200, remain below the current price — confirming bullish momentum. Volume increased on the breakout, and price has held above the 95.6 neckline zone. As long as that level holds, the setup remains valid. Targets are set at 100.36 (1.618 Fibo) and 105.19 (2.0 Fibo).
Followthetrend

OKLO — when nuclear momentum breaks resistanceSince late 2024, OKLO had been consolidating inside a clear rectangle between $17 and $59. The breakout from this long-term range triggered a new bullish impulse. The price has since returned to retest the breakout zone, now aligned with the 0.618 Fibonacci retracement at $51.94. The retest has completed, and the price is bouncing upward, confirming buyer interest.
Technically, the trend remains firmly bullish. The price closed above the prior range, EMAs are aligned below, and the volume spike during breakout supports genuine demand. The volume profile shows a clean path toward $100, indicating limited resistance ahead. The structure suggests a controlled rally rather than an exhausted move.
Fundamentally, OKLO is a next-generation SMR (Small Modular Reactor) company focused on delivering compact, efficient nuclear power solutions. Following its public debut via SPAC and recent capital injection, OKLO is transitioning from development to implementation. Institutional interest is holding strong, and the broader move toward decarbonization and energy independence places the company in a strategic position.
Target levels:
— First target: $100 — psychological and technical resistance
— Second target: $143 — projected from prior range breakout
OKLO isn’t just another clean energy ticker — it’s a quiet disruptor with nuclear potential. The chart broke out. The volume confirmed. Now it’s time to see if the market follows through.

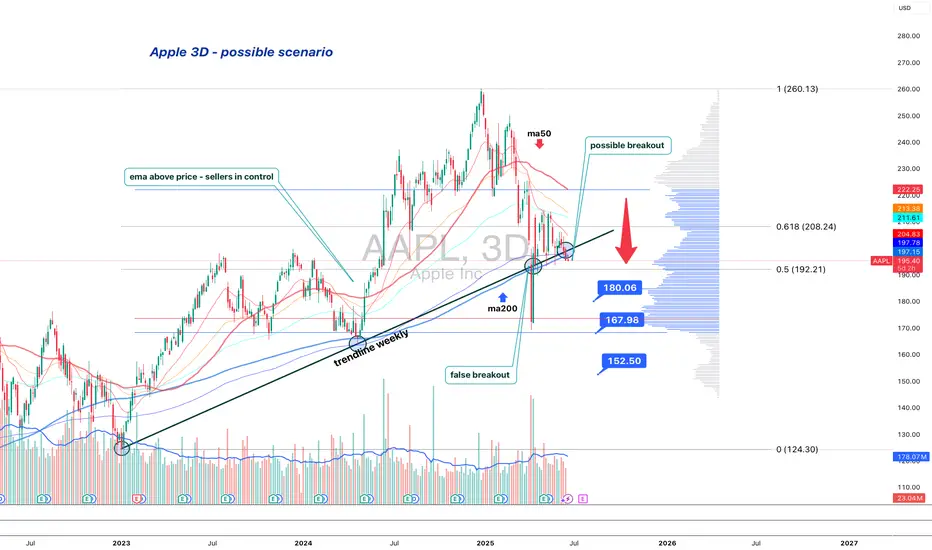
Apple is standing at the edgeApple (AAPL) is losing its long-term structure — second retest of the broken trendline suggests a bearish setup
On the 3D chart, Apple shows signs of structural breakdown. The weekly trendline from 2023 was broken and retested — twice. The price failed to regain it and now trades below, with candles showing weakness: low body closes, upper wicks, and no upside follow-through.
MA200 is now above price, and all EMAs are turning down. Volume Profile shows a heavy resistance block near $197. If the price remains below, sellers are in control.
Key levels:
— $192.20 = 0.5 Fibo support.
— Breakdown ➝ targets: $180 → $167 → $152.
Fundamentals:
Apple's recent reports show decelerating growth, weak China demand, and compressed margins. While AI buzz supports sentiment, institutional flow suggests distribution. BigTech may be topping out, and Apple is positioned for pullback.
Strategy:
Short below $196 with confirmation. Stop: $198. Targets: $180 / $167 / $152.
Failure to reclaim $192–197 = broken trend confirmed.
This is not a growth setup. This is where trends end — and profit-taking begins.
EUR/USD - 4H Analysis - High Probability Trade Setup🔍 Bias: Bullish continuation (Wave 5 setup)
📌 Key Confluences:
Wave (4) is retracing into a key demand zone with strong volume support.
Price is approaching the 71% Fibonacci retracement, a proven institutional entry level.
Ichimoku cloud is holding as dynamic support.
Wave (5) projection targets 1.1550–1.1600 zone (Swing Range).
🎯 Trade Idea:
Buy EUR/USD between 1.1280 – 1.1320
Stop Loss: Below 1.1220 (invalidates wave count)
Take Profit: 1.1550 (1:3+ RR)
⚠️ Risk Note: Confirmation via bullish engulfing candle or volume spike would increase the entry's conviction.
This setup offers strong confluence for a wave 5 rally, making it a high-probability long trade toward the upper swing range.
Follow along for more setups

AUD/CAD - Is this a turning point?!We are currently sitting at a very high-probability area for potential downside continuation!
🔎 Key Observations:
Elliott Wave Count: We have completed waves (1)-(3) and are currently finalizing a corrective wave (4) into a critical supply zone.
71% Fib Retracement: Price has retraced deep into a typical exhaustion zone for wave (4) setups — extremely common before the major trend resumes.
Supply Zone: Clear rejection visible near 0.90500 area; price is showing early signs of weakness.
MACD: Bearish cross aligned perfectly with supply pressure. Momentum indicators are favoring bears.
Volume Spike: High volume during the wave (3) selloff confirms real seller presence behind this move.
📈 My Plan:
Watching for bearish confirmation (weak candles, rejections) in this supply zone.
Expecting a potential wave (5) extension lower, targeting sub-0.82000s over the next several months.
Risk Management: Stops placed above 0.9100 structure if activated.
📢 Summary:
The trend is still bearish — we are just seeing a corrective rally.
Big money tends to load shorts on these pullbacks...
Don’t miss this potential monster setup! 🔥
💬 Drop a comment if you're watching AUD/CAD too!
🔔 Follow me for more high-probability setups each week!
#Forex #AUDCAD #ElliottWave #SupplyAndDemand #TradingSetup #SwingTrade #Bearish
Would you also like me to make a second version that's even shorter (for quick engagement) or one that sounds a bit more aggressive and hyped (depending on the style of your audience)? 🎯

Gold Price at a Crossroads: Awaiting the Next MoveCurrently, I foresee two possible scenarios for XAUUSD. In the more optimistic scenario (black label), the recent correction is assumed to be wave ii of wave (v), which suggests that XAUUSD still has the potential to strengthen toward the 3,177–3,306.
However, attention should also be given to the bearish scenario (red label). If XAUUSD fails to break above the 3,167 resistance level, it is likely that wave 3 has already been completed, and the current movement is part of wave 4. In this case, XAUUSD may decline toward the 2,489–2,832.

Mark your all new resistance Zone for GBPUSDThe orange line I drew 1.29620 is significantly respected dating back beyond 2018
I'm looking forward to the next NFP om April 4 where price starts to make trends whilst respecting our resistance.
cheers.

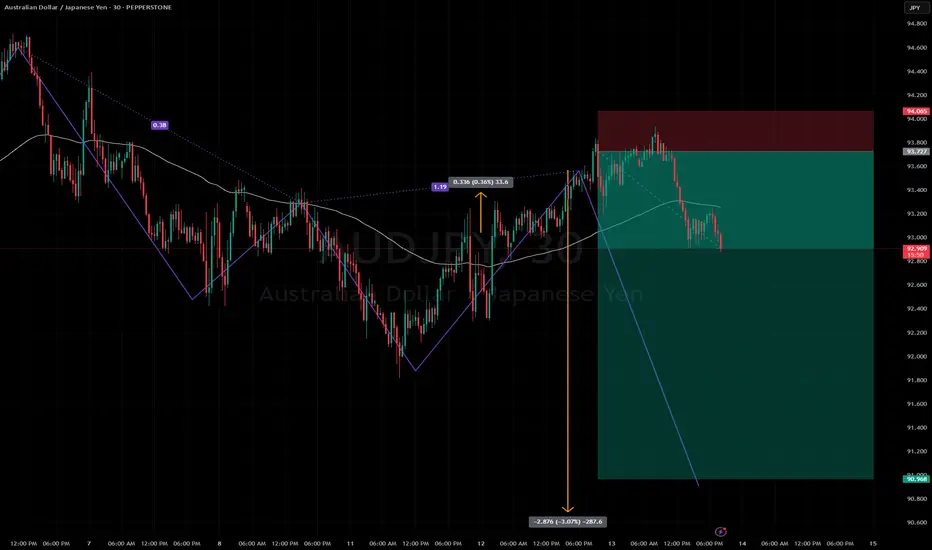
Follow up on my previous AUDJPY short upon accounting for CPI volatility , this trade idea is still valid for a lot of room for gains from the downside ,
some of the benefits CFD trades take advantage from setups like this,
Cheers.
CHFJPY POSSIBLE NEXT MOVE!CHFJPY currently break down of traingle and trade and down side of traingle now market will going to retest this traingle resistance and make any candle that show bearish momentum and break thier low so we will see downward market will going.
Remember! The result of your past trades, whether they were winning or losing ones, shouldn’t affect how you handle your next positions.

BNX Soars to New Heights: A Strong Uptrend Signals Promising FutHi everyone!
BNX is on uptrend and is the perfect moment to buy with price target 1.23.
Shorting this coin would be a massive mistake as smarts money plan is to sweep the shorts!!
Chart looks bearish but don't fall in to their trap!
If you open a long position make sure you are covered for at least 25% drop. Avoid the high leverage! Remember profit is greater that loss.
We are not day traders. just profitable traders!
Our job is to identify the trend.
Trade safe

Bearish trends in the days ahead. Hello,
To all my folks who are trading forex. Right now everything has been going crazy with all the news across the world.
One thing can be sure is the USD is reigning supreme. With a guy sitting at the big White House in DC. Be rest assured he wants to be first at everything. He wants US first in everything. It’s only a matter of time before things start to reflect certain aspects of that. Especially the USD.
So let’s take a look at what the EUR has been doing for a while! What it has been doing for a long time is falling.
Things will continue to be that way. If we extend the times on the chart to 4hrs, day, week and even month. You can see that things are looking to trace back to low’s that haven’t been hit in years.
Of course, things will always have to retrace, you will have your support and resistance levels. That’s a gimme. It’s what we do at those levels is what will define these future trades.
At this time. It’s time to throw the towel in and admit. We are in a EUR/USD downtrend for a long time to come.
As always, research your entries, confirm your strengths and look for opportunities to trade smarter. If you enjoy this publish idea, please follow and boost this up.
- Thank you

Altseason is Here - Follow Triangle BreakoutLong positions are piling up on Bitcoin (BTC) after each other.
I think that investors follow the consolidation to buy more.
Know that symmetrical triangles can break on either side.
Enabling you to follow the breakout, I made this chart.
This chart shows a symmetrical triangle tracing Bitcoin price action.
High as investors' risk appetite is, any drawback is potentially considered an opportunity.
I estimate that large-cap altcoins will do even better.
So, it might be a good idea to follow up on Ethereum.

bitcoin 40,000 soon ALL trading ideas have entry point + stop loss + take profit + Risk level.
hello Traders, here is the full analysis for this pair, let me know in the comment section below if you have any questions, the entry will be taken only if all rules of the strategies will be satisfied. I suggest you keep this pair on your watchlist and see if the rules of your strategy are satisfied. Please also refer to the Important Risk Notice linked below.
Disclaimer

SAGA long setup ALL trading ideas have entry point + stop loss + take profit + Risk level.
hello Traders, here is the full analysis for this pair, let me know in the comment section below if you have any questions, the entry will be taken only if all rules of the strategies will be satisfied. I suggest you keep this pair on your watchlist and see if the rules of your strategy are satisfied. Please also refer to the Important Risk Notice linked below.
Disclaimer

GOLD April 9, 2024: Next TargetAs TVC:GOLD reached the first price target that I wrote on March 30, 2024 (see the related ideas section) I closed half of my position.
For another half, I still hold a long position while moving up the trailing stop.
Now let's find the next target for OANDA:XAUUSD
As shown on the chart, I expect the next stop is around $2500.

SPOT April 3, 2024: Breaking into New HighOn April 3, 2024, NYSE:SPOT broke out into new high which provide an entry opportunity.

MSFT March 15, 24: A Failed BreakoutOn March 12, 24, I wrote about NASDAQ:MSFT as it crossed the trendline with higher than average volume, which provides a buying opportunity.
Later, on March 14, 24, the stock again broke out into the new all-time high, which provided an additional buy point.
You can see these 2 posts below in the related idea section.
However today NASDAQ:MSFT , although still looking good, moved down the previous resistance with very big volume which showed that the breakout on March 14, 24 was failed.
I bought the stock on March 12. I also bought some on March 14. But as the breakout failed I sold what I have bought on March 14. I am ready to enter again if the stock move up to new all time high again.
What do you think about NASDAQ:MSFT Please share your idea. Thank you

SUSHI LONG SETUP ALL trading ideas have entry point + stop loss + take profit + Risk level.
hello Traders, here is the full analysis for this pair, let me know in the comment section below if you have any questions, the entry will be taken only if all rules of the strategies will be satisfied. I suggest you keep this pair on your watchlist and see if the rules of your strategy are satisfied. Please also refer to the Important Risk Notice linked below.
Disclaimer

SMCI March 29, 2024: A Head & Shoulder FormingNASDAQ:SMCI is a clear leader during this bull market. However, after a 260% run-up from a previous buy point as shown on the chart, the stock is struggling to move up further.
Now it might slowly form a Head & Shoulders Pattern, and a breakdown through the neckline would signal a sell.
Interestingly, the neckline is right near the 50-day moving average (blue line), therefore a breakdown there will be an even stronger sell signal.

LRCX March 20, 24: Reclaiming MA-20On March 20, 24, NASDAQ:LRCX reclaimed its moving average MA-20 which provides a possible entry with a stop loss below the MA-20.

NVDA March 29, 2024: Can It Break To New High?NASDAQ:NVDA is THE leading chip stock during in AI-powered bull market. The stock is currently trading near its ATH and right at its MA-20.
A break through the resistance to move into a new high would be an appropriate buy point.

MSFT March 21, 24: A New HighOn March 20 NASDAQ:MSFT reclaimed a previous resistance as show on the chart, and on March 21 went up into new high.
A new high is a good entry point for trend-following traders.

DELL March 28, 2024: Trending Up Together With MA-20On March 21, 2024, we entered a position in NYSE:DELL as it broke out of a trendline as we discussed in a post you can find in the related ideas section.
At the end of March 28, 2024, the stock continues to trend up together with its rising MA-21 and an break above the yellow trendline shown on this chart would provide an additional buy point.
