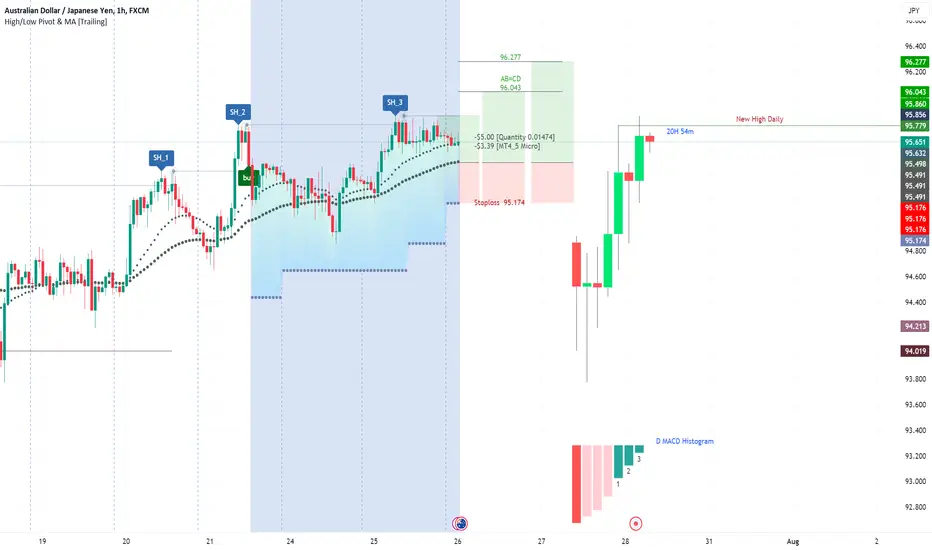
AUDJPY - Long by High Low Pivot & 2EMAs 7/26/2023* Daily timeframe: Previous Higher Candle breakout.
* Current timeframe:
1- Long trend when Swing High (1) & EMA 21 above EMA 50.
2- Swing High(2) is continue & low still above Swing High (1).
3- Opens a Buy with Stoploss at lowest price (Swing Low) between Swing High (1) & Swing High (2) (Rule to find Stoploss).
a/ Moving stoploss when occurs Swing High(3), Swing High(4)(5)...
b/ Wait to retest previous swing high if ratio of Reward > Risk (>1).
Followthetrend
NZDCHF
If price move to 0.54500 and break the upward trend line then we can expect a bullrun in the market along with sharp move and 1st resistance will be 0.55000 and second resistance will be most probably 0.55750 and 3rd resistance will be 0.56500
If price move to 0.54500 resistance at 0.54500 and trend line rejects the price then we can expect that market will move along with trendline or follow the trendline and price will move in downward direction.

USDCHF - Start a bull cycle!* Daily timeframe: Previous Higher Candle breakout.
* Current timeframe:
1- Long trend when Swing High (1) & EMA 21 above EMA 50.
2- Swing High(2) is continue & low still above Swing High (1).
3- Opens a Buy with Stoploss at lowest price (Swing Low) between Swing High (1) & Swing High (2) (Rule to find Stoploss).
a/ Moving stoploss when occurs Swing High(3), Swing High(4)(5)...
b/ Wait to retest previous swing high if ratio of Reward > Risk (>1).

NZDUSD - Long by high low pivot & 2 EMAs 7/16/20234
* Daily timeframe: Previous Higher Candle breakout.
* Current timeframe:
1- Long trend when Swing High (1) & EMA 21 above EMA 50.
2- Swing High(2) is continue & low still above Swing High (1).
3- Opens a Buy with Stoploss at lowest price (Swing Low) between Swing High (1) & Swing High (2) (Rule to find Stoploss).
a/ Moving stoploss when occurs Swing High(3), Swing High(4)(5)...
b/ Wait to retest previous swing high if ratio of Reward > Risk (>1).

BTCUSD -Long by High Low Pivot & 2 EMAs 7/14/2023* Daily timeframe: Previous Higher Candle breakout.
* Current timeframe:
1- Long trend when Swing High (1) & EMA 21 above EMA 50.
2- Swing High(2) is continue & low still above Swing High (1).
3- Opens a Buy with Stoploss at lowest price (Swing Low) between Swing High (1) & Swing High (2) (Rule to find Stoploss).
a/ Moving stoploss when occurs Swing High(3), Swing High(4)(5)...
b/ Wait to retest previous swing high if ratio of Reward > Risk (>1).

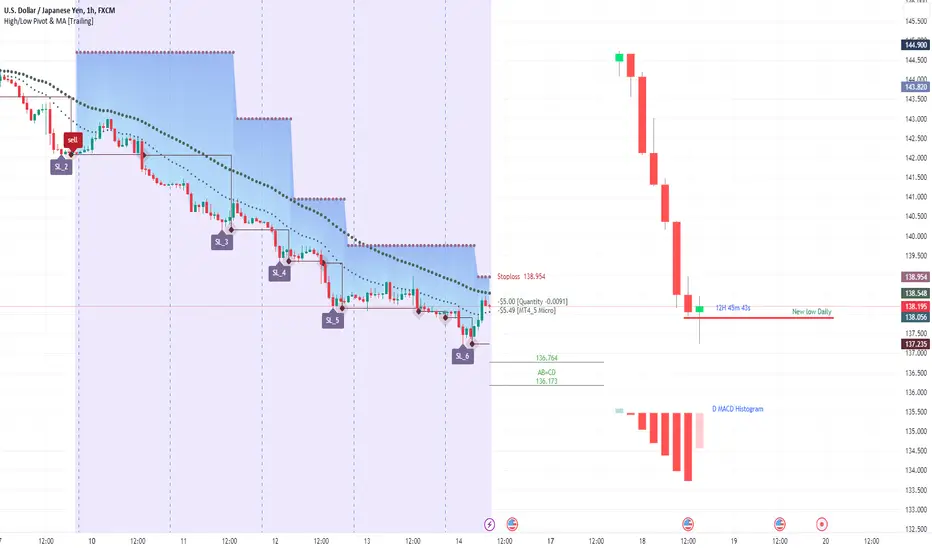
USDJPY - Short by High Low Pivot & 2 EMAs 07/14/2023* Daily timeframe: New low & MACD histogram bear.
* Current timeframe:
1- Short trend when Swing Low (1) & EMA 21 under EMA 50.
2- Swing Low(2) is continue & High still under Swing Low (1).
3- Opens a Sell with Stoploss at Highest price (Swing High) between Swing Low (1) & Swing Low (2) (Rule to find Stoploss).
a/ Moving stoploss when occurs Swing Low(3), Swing Low(4)(5)...
b/ Wait to retest previous swing low if ratio of Reward > Risk (>1).
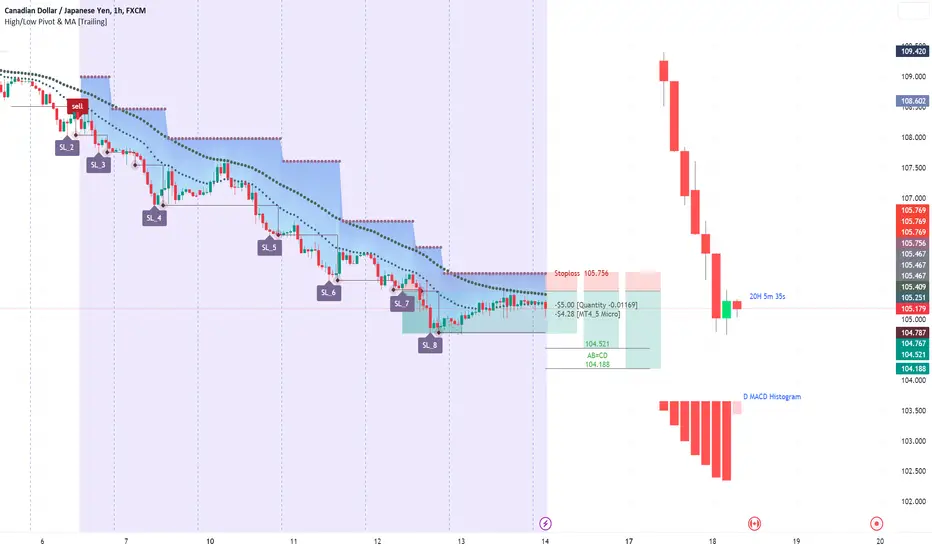
CADJPY - Short by High Low Pivot & 2 EMAs 7/14/2023* Daily timeframe: New low & MACD histogram bear.
* Current timeframe:
1- Short trend when Swing Low (1) & EMA 21 under EMA 50.
2- Swing Low(2) is continue & High still under Swing Low (1).
3- Opens a Sell with Stoploss at Highest price (Swing High) between Swing Low (1) & Swing Low (2) (Rule to find Stoploss).
a/ Moving stoploss when occurs Swing Low(3), Swing Low(4)(5)...
b/ Wait to retest previous swing low if ratio of Reward > Risk (>1).
USDCAD - Short by High Low Pivot & 2 EMAs 7/13/2023* Daily timeframe: New low
* Current timeframe:
1- Short trend when Swing Low (1) & EMA 21 under EMA 50.
2- Swing Low(2) is continue & High still under Swing Low (1).
3- Opens a Sell with Stoploss at Highest price (Swing High) between Swing Low (1) & Swing Low (2) (Rule to find Stoploss).
a/ Moving stoploss when occurs Swing Low(3), Swing Low(4)(5)...
b/ Wait to retest previous swing low if ratio of Reward > Risk (>1).

AUDUSD - Short by High Low Pivot & 2 EMAS 6/30/2023* Daily timeframe: New low
* Current timeframe:
1- Short trend when Swing Low (1) & EMA 21 under EMA 50.
2- Swing Low(2) is continue & High still under Swing Low (1).
3- Opens a Sell with Stoploss at Highest price (Swing High) between Swing Low (1) & Swing Low (2) (Rule to find Stoploss).
a/ Moving stoploss when occurs Swing Low(3), Swing Low(4)(5)...
b/ Wait to retest previous swing low if ratio of Reward > Risk (>1).

XAUUSD - Short by High Low Pivot & 2 EMAs 6/30/2023* Daily timeframe: New low
* Current timeframe:
1- Short trend when Swing Low (1) & EMA 21 under EMA 50.
2- Swing Low(2) is continue & High still under Swing Low (1).
3- Opens a Sell with Stoploss at Highest price (Swing High) between Swing Low (1) & Swing Low (2) (Rule to find Stoploss).
a/ Moving stoploss when occurs Swing Low(3), Swing Low(4)(5)...
b/ Wait to retest previous swing low if ratio of Reward > Risk (>1).

LTCUSDT - Short by High Low Pivot & 2 EMAs 6/30/2023* Daily timeframe: New low
* Current timeframe:
1- Short trend when Swing Low (1) & EMA 21 under EMA 50.
2- Swing Low(2) is continue & High still under Swing Low (1).
3- Opens a Sell with Stoploss at Highest price (Swing High) between Swing Low (1) & Swing Low (2) (Rule to find Stoploss).
a/ Moving stoploss when occurs Swing Low(3), Swing Low(4)(5)...
b/ Wait to retest previous swing low if ratio of Reward > Risk (>1).

EURGBP - Long by High Low Pivot & 2 EMAs 6/29/2023* Daily timeframe: Previous Higher Candle breakout.
* Current timeframe:
1- Long trend when Swing High (1) & EMA 21 above EMA 50.
2- Swing High(2) is continue & low still above Swing High (1).
3- Opens a Buy with Stoploss at lowest price (Swing Low) between Swing High (1) & Swing High (2) (Rule to find Stoploss).
a/ Moving stoploss when occurs Swing High(3), Swing High(4)(5)...
b/ Wait to retest previous swing high if ratio of Reward > Risk (>1).

GBPAUD - Long by High Low Pivot & 2 EMAs 6/28/2023* Daily timeframe: Previous Higher Candle breakout.
* Current timeframe:
1- Long trend when Swing High (1) & EMA 21 above EMA 50.
2- Swing High(2) is continue & low still above Swing High (1).
3- Opens a Buy with Stoploss at lowest price (Swing Low) between Swing High (1) & Swing High (2) (Rule to find Stoploss).
a/ Moving stoploss when occurs Swing High(3), Swing High(4)(5)...
b/ Wait to retest previous swing high if ratio of Reward > Risk (>1).

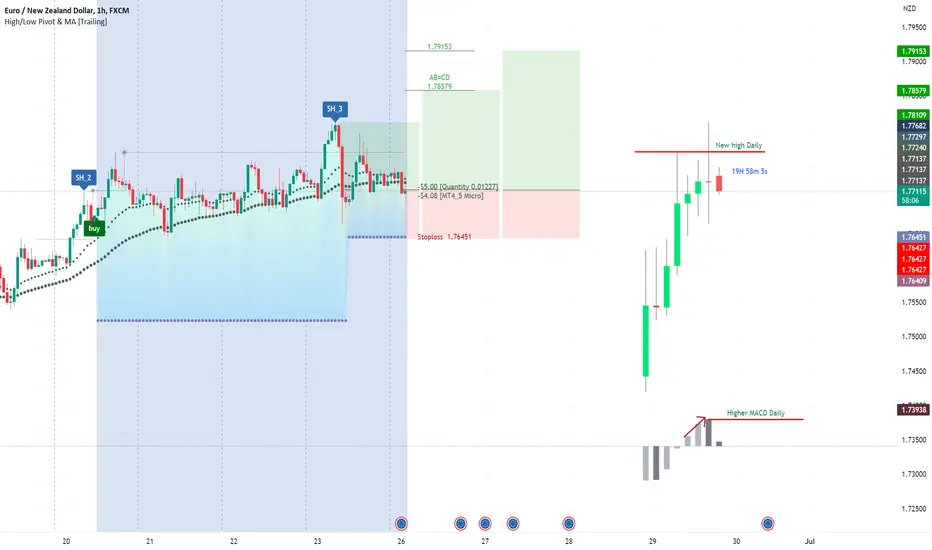
EURNZD - Long by High Low Pivot & 2 EMAs 6/26/2023* Daily timeframe: Previous Higher Candle breakout.
* Current timeframe:
1- Long trend when Swing High (1) & EMA 21 above EMA 50.
2- Swing High(2) is continue & low still above Swing High (1).
3- Opens a Buy with Stoploss at lowest price (Swing Low) between Swing High (1) & Swing High (2) (Rule to find Stoploss).
a/ Moving stoploss when occurs Swing High(3), Swing High(4)(5)...
b/ Wait to retest previous swing high if ratio of Reward > Risk (>1).

Bitcoin's next big moveWe are witnessing a divergence in the RSI indicator. After hitting and rejecting the daily resistance, the price has entered the indecision phase and has the potential to fall to the minor level.

Btc Bottoms and next target area for bears and best poss bullishIn My last Sand analysis i expected us to reach major lows of 0.5 cent per sand, but i was more interested in finding this cycle bottom in case of no heavy market manipulation.
This my actual point of view of the Btc Chart
i predicted 15k btc last year but Russian war and Ukrain make u believe anything can happen anytime and usually its bad news

GBP/JPYSo in this idee we can clearly see a nice double top formed and ABCD patter running great strong resistance line, also stoch showing that price is running above 80% about to go down to retest on the support area.
Please share you comments on this idea.

NZDCAD || Going Long || W6Series of HHs and HLs >> UPTREND
Going Long
HL @ 0.618 Fab Retrancment
Price Action following and Upward Trendline

USDJPY continuationSo I had a new signal to keep going higher. 150.00 is the obvious target but this start is looking for 152.00

EURAUD 4H= down tren
- supply confluence with ema 200
- ABCDE pattern
- I expect bearish move from 1.45751 and the stop los 1.46442
= TP1 1.45061
- TP 2 1.44370
- TP 3 1.43680

CADCHF 1H- break event
- demand confluence with EMA
- for the time being there is no bearish divergence on the RSI indicator
- i expect bullish move from 0.74284 and the stop los 0.74067
- TP 1 ( 0.74501 )
- TP 2 ( 0.74171)
- TP3 (0.74934 )

