NZDCHF short trade present. Hello traders
Who's still trading come this time of year?
If you still are trading our script presented this trade on the charts earlier today. A NZDCHF short trade on the H1 chart.
With our strategy you simply execute trades when the script presents them on the chart.
This is easy right?
No lines, no S&R - no analysis, all I have to do is follow it.
The major plus point is I can see it works with all the data within the strategy tester.
This helps me and our traders have confidence and belief in our execution.
When do we close this?
We close on a reverse signal - but you can do as you wish and use the script to trade the way you want.
For any information on the script in question please drop me a message.
Followthetrend

BTCUSD - Follow trend & day trade by Keltner 19/12/20201. How to use Keltner Channel
a_ Length of Keltner's basis line is 50. It gives the best result in finding rule of BTCUSD.
b_ How to confirms a trend.
- Upper 2 is used to confirm Keltner channel at Uptrend.
- Lower 2 is used to confirm Keltner channel at Downtrend.
c. How to determine a swing Entry.
_ Upper 1 is used to buy when the market make a corrective.
_ Lower 1 is used to sell when the market make a corrective.
2. Long signal is confirmed when Closed of candle crossover the Upper 2.
3. Short signal is confirmed when Closed of candle crossunder the Lower 2.
4. Stoploss is calculated by the price closed candle +/- the value of Average true range (length=20 bars)
Stoploss = previous Close +/- atr(20)x2
-> To move the stoploss every 1 hour.
5. Filter the Candle is over 93% for Not Entry.

ETHUSD - Follow the trend by Keltner Channel 19/12/20201. How to use Keltner Channel
a_ Length of Keltner's basis line is 50. It gives the best result in finding rule of ETHUSD.
b_ How to confirms a trend.
- Upper 1 is used to confirm Keltner channel at Uptrend to give Buy_1.
- Lower 1 is used to confirm Keltner channel at Downtrend to give Sell_1.
c. How to determine a swing Entry.
- Upper 1 is used to buy when the market make a corrective.
- Lower 1 is used to sell when the market make a corrective.
d. Color count calculate
- Color count = Green + Red
- If Color count > 0 is Uptrend to give Buy_2
- If Color count < 0 is Downtrend to give Sell_2
2. Long signal is confirmed when Closed of candle crossover the Upper 1 & Color count for Uptrend.
3. Short signal is confirmed when Closed of candle crossunder the Lower 1 & Color count for Downtrend.
4. Filter the Candle is over 93% for Not Entry.

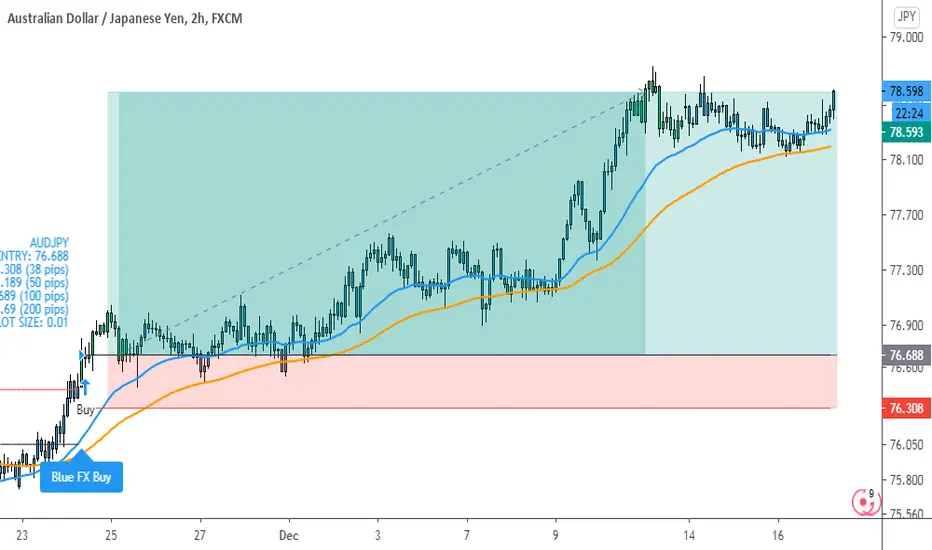
AUDJPY I'm still riding this huge wave! Hello traders
I wanted to share my first idea of the day on how our script can be used to trade larger time frames.
This trade on AUDJPY on the H2 time frame was a trade entered on the 24th of November and we have been following the trend upwards ever since. Currently at a 1:5 risk to reward ratio.
With our strategy you simply execute trades when the script presents them on the chart.
This is easy right?
No lines, no S&R - no analysis, all I have to do is follow it.
The major plus point is I can see it works with all the data within the strategy tester.
This helps me and our traders have confidence and belief in our execution.
When do we close this?
We close on a reverse signal - but you can do as you wish and use the script to trade the way you want.
For any information on the script in question please drop me a DM
Nvidia long position ongoing. Hello traders.
Just wanted to share an ongoing Nvidia trade with opportunity to still enter before market reopen.
Working the H1 time frame here on this stock using a follow trend script.
Nvidia is a great example of how the script I'm using can be used on stocks if you operate on lower time frames to catch the ups and downs needed for working those lower time frames.
On this stock I'm using the script to work to a stop loss and take profit target.
Back test data is show at the bottom of screen on three years worth of data.
For anymore information please drop me a message.

CADJPY short valid.Morning traders
I have woken this morning to a short position valid on CADJPY .
Working the H1 chart here I simply take the trade set the stop loss and follow this trade now until next signal.
This has proven to be the most profitable way on bigger time frames using this script.
For more information on the script used please drop me a message.

How I've traded Netflix this year. Morning traders.
I just wanted to share how I've traded Netflix this year with the script I am using and the results I've gotten.
Traded netflix only on an account with a well known CFD provider. £200 deposited and 76% gains on investments since March risking 1% per trade.
This information is all provided by the back test data screen shot at bottom of the screen.
As you will see from the idea screen I have provided details of how the script prompts me when to enter the market.
I simply enter the market set my stop loss and take profit targets and let the trade play out. That easy!
All the back test data backs the strategy up and takes away all the emotion of trading. Something we all struggle with as traders.
Once the trade has played out I simply wait for the next signal alert and go again.
This particular example is working the H1 and the example is taken from back in June and July.
Currently I am in a live long position on this chart as we speak. So we will see how that plays out.
For any more information on the script I am using please message me.

A look at DataDog stock growth.Hello Traders
I've covered the potential of the strategy script I am using on stocks like Tesla and Apple and how the script presented early entry opportunities.
Working the W1 chart on those two stocks mentioned buy signals presented on both at stages in 2019 and have kicked on to some unreal gains.
But now its time to focus on some potential growth stocks. Here I talk about Datadog.
This stock year to date has grown 164% and the strategy I use presented a buy signal back in June which is when I entered this one in to my portfolio. Since then it has gone on to gain 15%. Still loads of potential growth and when working this time frame its all about long term growth.
For any more information on the strategy I utilize please drop me a message.

Potential long position soon on UCAfternoon Traders
Here we have the 30M chart on USDCHF.
We are working to a stop loss and take profit target. We entered a short trade this morning which has since hit it's 32 pip take profit target.
Looking at the chart currently both EMA price is trying to break to the upside and I await a possible long trade signal to present on my chart.
For more information on the script I am running please drop me a message.

If only I had this script years ago! Apple review. Afternoon traders
I just want to demonstrate the possibilities of the script I'm using on trading stocks.
I've used Tesla as an example before on the potential of using this strategy for long term investments.
Today I will show Apple quickly as an example of when the strategy presented a buy signal on the 1W chart all the way back in August 2019 and has since gone on to gain 144% in value. A stop loss parameter is set and now its a case of following the trend until a next signal presents.
No one had this script at the time but now we do I'll go over some potential long term growth stocks over the course of the next few days on my profile. I'll be using the 1W chart to present possible ideas of investing in stocks with long term growth potential.
For any information on the script I am using please drop me a message.

US30 - Follow the trend by Keltner & Stoch indicatorMax risk: 2%.
Stop loss move follow the trend.
------
+ A Long trend is when the price close & crossover the Keltner Upper 2 + k value of Stochastic indicator crossover 80.
------
+ A Short trend is when the price close & crossunder the Keltner Lower 2 + k value of Stochastic indicator crossunder 20.
------
+ to Entry when k value (Stoch indicator) make correction and cross the d value (Stoch indicator)
- Buy: k & d > 79
- Sell: k & d < 17

The potential when you stay in trades. Hello traders
Reviewing some trades I am still entered before markets kick in for the week.
Just wanted to share this one and highlight the benefits of running some strategies on longer time frames and crucially gains made by staying in those trades.
On bigger time frames I run the strategy I am using with a stop loss and follow trend set up until the next signal presents on my chart. At this point I close the current trade and enter the next one.
Here we have a AUDJPY trade that I entered on the 24th of November. Trade is currently running at 182 pip gain.
From the back test data this method of trading this pair at these settings on a 2% risk per trade has produced 83 gains on investment year to date.
For more info on the script I am using please drop me a message.

EURCAD ShortAfternoon traders
New York session has started and we have a EURCAD short presented on the charts.
Working the 30M chart here. Working to a stop loss and take profit target of 3:1 risk to reward. 111% gains on the back tested data year to date!
Data shown at bottom screen for your viewing.
For any more information on the strategy I am using drop me a message.

AUDCHF Long postion valid. Morning Traders
The strategy I am using has presented a trade on my H1 chart for a buy on AUDCHF
Already gaining some traction looking like it could push into the green zone quiet well.
For information on the strategy I am using please drop me a message.

BTCUSD - Day trade by Keltner channel & ADX indicator 12/9/2020* Risk 3% per Trade.
* Data backtest is maximum history bars/premium account.
* Commission = 0.07%/contrast.
* Slippage = 2 ticks.
--------
1. The basis Keltner Channel is 20.
2. ▲ Long trend is confirmed when the Close of candle crossover the Upper 2.
3. ▼ Down trend is confirmed when the Close of candle crossunder the Lower 2.
4. to entry if the medium ADX value crossovers 45 and the medium ADX (h1) > the slow ADX (h4).
5. Stop loss = Entry price +- (ATR(20)*2 ) * 1.624
-------
"Use the link below to obtain access to this indicator" or "PM us to obtain access"


CADJPY Short trade present.Hello Traders
Here I have a CADJPY chart on the 30M time frame that I trade on settings at a 1:2 risk reward strategy.
A sell signal has just presented. I have taken the trade with the SL set and I am working to the TP2 setting on screen.
Traded this pair this way since February and have 132% gains on capital. Shown by the back tester at bottom of screen.
Drop me a message for information on the script I'm running.

CADJPY Short trade present.Morning Traders
Working the H1 chart on the CADJPY pair here and after a successful long trade a sell signal has presented at 10 am UK time.
I know enter the sell and follow the trend until next signal. That is how I work this strategy but you can adapt the strategy for to your own needs and for example if you worked to a take profit target you could of choose any of those take profit targets in the previous trade and would of banked good pips.
For more information on the strategy drop me a message.

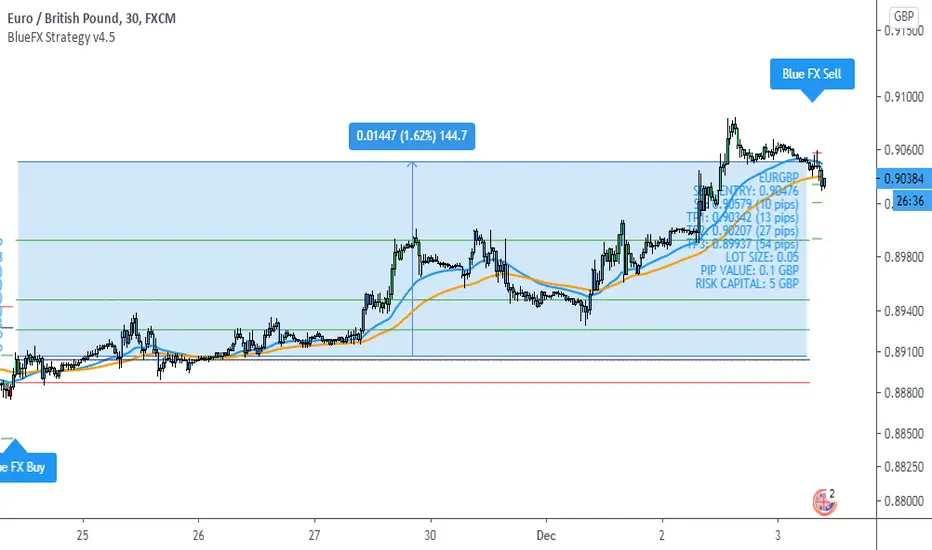
EURGBP short Morning traders
Working off the 30M time frame here on EURGBP with a follow trend strategy.
After riding a long trade from the 24th of November which was a 144 pip move that trade has come to an end this morning and I am now in a sell that has presented on my chart.
Personally feel EUR strength wont continue as hard as the last few days. Here's to some profit hopefully on the short trade.
For more info on how to be the right side of the market please message me.
Has your strategy got you in these moves EURUSDMorning traders
Some massive moves yesterday as we see EURUSD pass 1.21 for first time in 18 months
Did your strategy have you on the right side of the market. This follow trend strategy I'm using did with a simple buy indicator presenting yesterday at 1:00pm UK time.
Currently the trade is running at 1:3.5 risk to reward, 120 pips in profit.
Don't miss these moves drop me a message for more information on the strategy.

BTCUSD - Next target 20.600 [Keltner channel & ADX] 12/3/2020- H4 key level is valid (Higher Low).
- H1 keeps up (Higher Low).
- Elliot wave 3 target 1 is reached.
- 20.600USD is the Elliot wave 3 target 2.
- Plan fails below the Key Level H4.

EURJPY Long currently running at 1:6 risk reward. Hello traders.
Just wanted to show an ongoing trade on the H1 time frame I am currently entered that is running at 1:6 RR at 175 pips and still climbing.
On the H1 chart I run this strategy with a stop loss and follow the trend until next signal presents.
For more information on the strategy I am using please drop me a message.

CADCHF long aiming for three out of three on this pair. Morning traders.
Posted an idea yesterday afternoon on this pair which was in a sell after a successful long trade.
That sell landed also and we are now in a long trade hoping for three out of three trades and 76 pips of profit in two days.
This is working the 30M chart on a 1:2.15 risk reward ratio.
I've been trading this pair since March and the back tested results are at bottom of screen.
For more information on the strategy I am using please message me.
