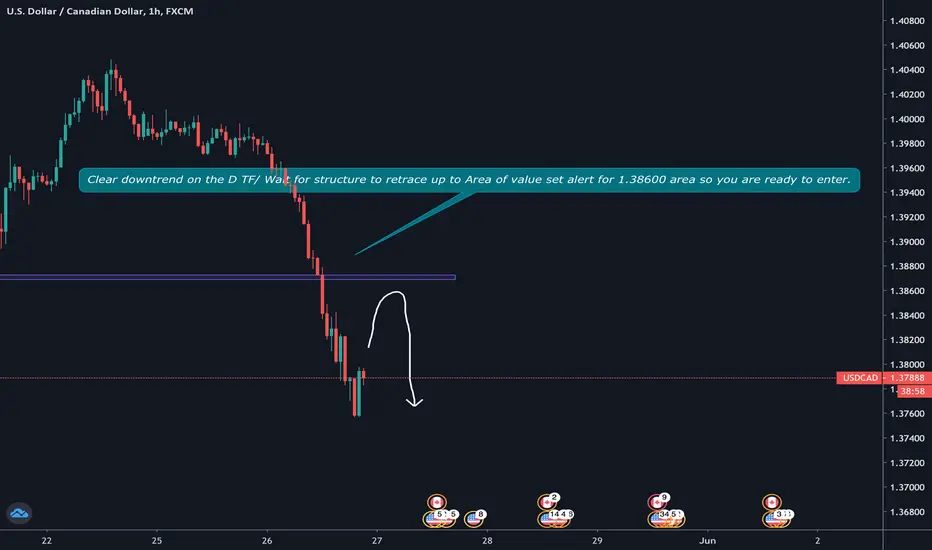
USD/CAD USD/CAD in a clear down trend on Daily TF, Switch to the 1hr TF wait for RETRACEMENT from the downward movement to the area of value (Rectangle) and set a alert to enter/ Look for Shooting star long wick patterns ( strong rejection) or a bearish engulfing candle for confirmation to enter trade!
Any questions comment and I'll reply.
Followthetrend
I WARNED you: It's a BULL TREND.Today SPX killed a lot of bears. It’s impressive, and I understand the bear’s point. With all the problems the world is facing right now, how could this bull trend persist? Well, I have no idea, all I know it is a bull trend and that’s what I’ve been warning you guys since I started to write my analyses here. First, I invite you to follow me to keep updated about our trades and analyses, I’m every day here, and I’m sure you’ll find something interesting.
Those who follows me know that I’m a bull, I have my portfolio and I bought more stocks on Friday. Check my social media for more details. My stocks are performing very well, thank you very much, despite of my personal beliefs about the market. As I said, I get the bears, but my trading style is reactive, not predictive , and I just do what the chart tell me to do. I’ll talk openly about my stocks in future posts. I’ve already analyzed two of them here (links below), but the remaining I just mentioned briefly on my social media, so remember to follow me there too!
Now SPX is testing a resistance zone again, which is the previous tops and the 61.8% fib retracement, and it did a higher high than these tops. All of this are very strong bullish signs, and it seems it will close slightly above the fib retracement. A stronger bullish sign would be if it close above the higher high of Apr 29’s candle, but that’s ok. At the hourly chart you can see my concerns:
The price found support at the “support zone” and did a false breakout of the purple trendline. Now we see that it is very important for the price to close above this pink line (Apr. 29 top), because the market may see a triple top here, and this could sink the price all the way back to the “support zone”. In any case, I wouldn’t short SPX to hedge my positions, I prefer to buy VIX, but only tomorrow we will know if the bulls will win this battle.
Remember to follow me, I’m a trader who uses the classic technical analysis (barely any indicator, just the candles and the volume). Like this idea if it helped.
Thank you very much.
* LIKE this idea and FOLLOW me, because:
- Here, you will see clean charts;
- Trades with clear risk management;
- The best of Dow Theory, Price Action and Candlestick psychology;
- Chart patterns with statistics. *
* My name is Nathan, I'm a trader and portfolio manager and I'm here to LEARN. Leave your COMMENT and FOLLOW me to keep in touch. *

On course to hit another TP 🔥🥵🤑This is a trade I took earlier and hopefully you took the same trade when I sent out my signal. If not then hit that follow button, on absolute fire this week 🔥🔥🔥
So looking at the chart guys, higher highs and higher lows being made, very simple stuff. This tells us the trade is still valid and is still moving in that uptrend.
We almost had a perfect entry 🤑, be sure to hit that follow button and don’t miss out on another trade.
Trade currently sitting around the 35pip mark, just under half way to the TP, aiming for around 80-90pips. SL sitting at break even but with be trailing my stop loss soon.
Consider following 🙏🏻
Risk management is key 🔑
Stay profitable 🤑

On course to hit TP🤑🔥🥵 higher highs lower lows being madeJust a quick update on the trade I took earlier and hopefully you took it to, if not make sure to follow to get these signals, been on absolute fire 🔥 this week.
So enough chat, looking at the chart, very simple stuff guys, we can see ‘higher highs’ & ‘higher lows’ being made. Tells us this trade is still valid, still in a beautiful uptrend, and guys we pretty much got a perfect entry on this trade.
Around 35pips profit so far, TP is set at around 90pips I believe, SL currently at break even looking to move around 15pip area. Dont miss another one off my signals hit that follow button and lets get these pips!! 🔥🤑🔥🤑

USDCHF: SELL- Structure: Downtrend
- Tendency: Downward
- Below support & EMA, reject on support & EMA
- Breakout trendline
=> SELL

BTCUSD: possible long scnearioTechnically speaking, BTC has broken out from the triangle chart pattern on 4h timeframe...
...so entering from around 6600 with S/L around 5650 and T/P around 9200 (previous March high) price levels provides decent R:R opportunity.
Fundamentally, BTC was under pressure as other major markets and I am not sure we are not going to see lower levels in the coming days/weeks, but before that another bull rally is quite possible.
Keep in mind, that It's important to follow predefined risk and money management rules.
//
I would very much appreciate if you support my work by hitting like .)
Feel free to share your opinion/position via comment and follow me to stay updated.


BE FLEXIBLE , TRADING IS FOREVER CHANGING - SP500Good Day Traders!
Congrats to those who made money following our calls! 💰💰💰
Simply following us and we will get you guys our latest updates FOR FREE! Go to the link below & hit the " FOLLOW " button right now !
👉 www.tradingview.com
👉 www.tradingview.com
👉 www.tradingview.com
Below is our latest call, and if you are following us, you are IN THE MONEY RIGHT NOW. 💰💰💰 📈📈📈 TVC:SPX
👉https://www.tradingview.com/chart/SPXUSD/TlMBSxNi-HOW-TO-MAKE-MONEY-ON-SP500/
"Your strategy has to be flexible enough to change when the environment changes" - Mark Weinstein
Yesterday, US equity market rebounded after Fed offered to buy unlimited amounts of assets to steady markets and expanded its mandate to corporate bonds.
HOWEVER, all gains was erased and SP500 closed in negative territory again. (SIGN OF WEAKNESS - SHORT)
THE TREND IS STILL DOWNTREND , lasted more than a month ➡️ SUPER BEARISH ➡️ SHORT
White boxes (shown in the chart) is expanding. Volatility is expected in the next few days. Opportunities are only for the people who are prepared.
Hit like and comment if you agree with our ideas !!
Follow us Rule_no1 so we can get you our latest updates !
👉 www.tradingview.com
👉 www.tradingview.com
👉 www.tradingview.com
Happy Trading :)
DISCLAIMER: There is a very high degree of risk involved in trading. Past results are not indicative of future returns. Trade at your own risk.

RVNUSDT: possible buy opportunityThe price is above 200 MA and can reach previous high above it.
EMA indicator also bullish.
Entering the market from around 0.0148 price level with S/L below 0.012 and 0.0283 T/P provides decent R:R.
//
I would very much appreciate if you would support my work by hitting like.)
Feel free to share your opinion/position via comment and follow me to stay updated.

LTCUSD: possible buy opportunityCryptocurrency market also crashed and didn't act as safe-heaven asset-class...
ETC lost more than 50% of it's value in March.
At the moment it's moving sideways in a triangle, accumulating longs?
EMA indicator is bullish.
Entering the market from around 5 price level with S/L below 4.5 and T/P above 7 provides decent R:R.
//
I would very much appreciate if you would support my work by hitting like.)
Feel free to share your opinion/position via comment and follow me to stay updated.

USOIL: #stayhome effect Oil prices have dropped more than 50% in March (yearly performance is around-62,1%). Is it the end or are we going to see more downside movement?
Let's assume this is another opportunity for joining bears, based on technical analysis (thoughts) you can see on the chart.
How much lower can the price go? Can it reach the lows of 1999?
My answer is: why not?
Most of developed countries are on quarantine #stayhome and the supply wasn't cut by OPEC.
The major US indices, including DJI, S&P500 and Nasdaq, have fallen in the following order: 35%, 30% and 25%. While different sectors and industries in the US have the following yearly performance so far:
1. Energy minerals sector (931,2B MKT CAP): -58,04%, out of which e.g.:
-Coal Industry: -69,17%
-Oil & Gas production Industry: -62,67%
-Integrated oil Industry: -57,05%
-Oil Refining/Marketing: - 55,7%
2. Industrial Services Sector (515,96B MKT CAP): -36,09%, out of which e.g.:
-Oilfield Services/Equipment Industry: -60,01%
-Oil&Gas Pipelines Industry: -42,93%
3. Process Industries Sector (681,34B MKT CAP):-27,36%, out of which e.g.:
-Pulp&Paper Industry: -50,05%
-Chemicals: Major Diversified Industry: -49,87%
-Agricultural Commodities/Milling: -41,45%
4. Non-Energy Minerals Sector (476,43B MKT CAP): -25,73%, out of which e.g.:
-Steel Industry: -48,32%
-Other Metals/Minerals: -40,16%
-Aluminium: -39,87%
5. Transportation sector (569,48B MKT CAP): -23,84%, out of which e.g.:
-Airlines industy: -49,2%
6. Finance sector (6038,64B MKT CAP): -23,12%, out of which e.g.:
-Life/Health Insurance Industry: -37,69%
-Real Estate Development Industry: -37,64%
-Financial Conglomerates Industry: -34,83%
-Major Banks Industry: -31,13%
7. Consumer Services sector (1481,09B MKT CAP): -21,53%, out of which e.g.:
-Hotels/Resorts/Cruise Lines Industry: -43,78%
-Casinos/Gaming Industry: -34,22%
8. Producer Manufacturing sector (1030,45B MKT CAP): -21,02%, out of which e.g.:
-Auto Parts: OEM Industry: -34.64%
-Metal Fabrication Industry: -33,09%
-Industrial Conglomerates Industry: -31,72%
It's quite interesting when and how these industries will be able to recover, but I am quite sure it's a great opportunity to start analyzing particular companies and building portfolio with these businesses.
This is going to be my next step...
//
I would very much appreciate if you would support my work by hitting like.)
Feel free to share your opinion/position via comment and follow me to stay updated.

CRUDE BREAK PREV LOW!! WHAT'S NEXT?? SHORT. TP LEVEL 20Good Day Traders!
Congrats to those who made money following our calls! 💰💰💰
Simply following us and we will get you guys our latest updates FOR FREE! Go to the link below & hit the " FOLLOW " button right now !
👉 www.tradingview.com
👉 www.tradingview.com
👉 www.tradingview.com
LATEST UPDATE ON CRUDE :
Since crude broke below previous low of 27.31 level, the likelihood of going lower increased. (SHORT)
SP500 rebounded yesterday after Trump proposed a stimulus package to tackle the Covid-19 outbreak, crude DID NOT follow. Sign of weakness. (SHORT)
Saudi Arabia-Russia oil price war (SHORT) :
👉https://oilprice.com/Energy/Oil-Prices/Saudi-Aramco-Is-Very-Comfortable-With-30-Oil.html
👉https://www.ft.com/content/88fa4174-6499-11ea-a6cd-df28cc3c6a68
** We will short around level 28.00-30.00. CL 32.00. TP near level 20.00. RR >3 **
Please like and comment if you agree!
Follow us Rule_no1: "Having trading discipline is the beginning, staying disciplined is the success"
Happy Trading :)

People are lining up to buy guns follow LOCKHEED MARTIN CORP People are lining up to buy guns because they're afraid they'll be looted amid the coronavirus crisis
People in the US are stockpiling guns and ammunition amid the coronavirus crisis.
Some say they are afraid that as businesses are forced to close, looters will start emerging.
have you ever trade on LOCKHEED MARTIN CORP, is it a flop or fly?

FSLR: buy opportunityThe future belongs to stocks related to the climate theme.. here is one them: First Solar.
It is involved in designing, manufacturing, marketing, and distribution of photovoltaic solar power systems and solar modules.
Joining bulls around 52.9 price level with 49.1 S/L and 65.3 T/P level provides decent R:R (3.26).
//
Feel free to share your opinion/position via comment and follow me to stay updated.)

USDJPY: possible scenario for joining bearsGlobal uncertainty around coronavirus puts USDJPY under selling pressure, which might continue..
Joining bears between 108.9-109.27 price zone with 108.1 T/P provides decent R:R (at least 2.16).
//
Feel free to share your opinion/position via comment and follow me to stay updated.

EOSUSD: optimistic scenario..what's next?Already with bulls since around 3 price level.. unreal. P/L around 40%, what should i do?
Should i close the position now? Don't think so..
1. Cryptocurrency market is breaking out, this month already had 5 posts regarding BTC, BCH, TRX, ETC and ETH..
2. EOS volume profile provides most traded area in the last 6, 3 and 1 month, so in my opinion selling around 3.8 price level is decent..
3. In this case i am risking 17% (with 23% profit in my pocket) with R:R ratio 3,8..
4. If we think from another point of view i have two options: 100% vs. 23%
5. Nothing more to add.. am i loosing this time..? No.)
Feel free to share your opinion/open positions via comment and follow me to stay updated.

A cup of tea goes a long way
Weekly cup & Handle
Since making new highs, there have been a slight pull back but the trendline stays intact and it remains in an uptrend.
The trend is strong high above 50 week MA and preparing for a possible breakout to new highs.
Don't fight the trend.
Don't be scared of new highs.
Catalyst 2020:
Cervical Cancer Phase 2 data due 1H
DARZALEX ENHANCE PDUFA estimate 12 MAY
Price target:
29 of January; Dutch Kempen & Co raised their PT to 1750 DKK from 1700 DKK

EURUSD LONGEURUSD to hit demand zone and retest back up to supply aiming 20 pip tp and swing for 1.1117
COMMENT YOU'RE THOUGHTS BELOW

USDJPY: possible scenarioRisk-on sentiment is still valid, the Japanese yen is in the uptrend and there is no sign for a reversal..
Joining bulls from around 110.05-109.78 with 110.8 take profit provides decent R:R (2.73).
Keep in mind that this idea can be realized in several days and long position in USDJPY has negative swap.
//
Follow me to stay updated.)

usdcad buyhey let me know what you guys think, if you're interested in learning I offer training one time fee $60.

ETCUSD: what's going on?One week ago on Sunday (12th of January) Ethereum Classic completed the "Agharta" hard fork, which makes it "more interoperable" with sister-chain ethereum.. whatever that means, ETC more than doubled its value in a couple of days during the week.
Technically speaking the price broke out from the descending bearish trend, which provided a good signal for possible trend reversal and opening long positions on 12th of January..this proved to be a good idea! However, 2 days ago (on 17th of January) the price formed a kind of a shooting star candlestick chart pattern (which was more like an inverted hammer pattern but in the up-move), so at the moment the correction or realization of profit is taking place.
Now the question is how deep is it going to be?
I think buying now is more like a FOMO, so it's better to wait for a correction at least until 61,8 fibo retracement level, which is around 7.39 price.. from there it's possible that we are going to see a rebound and continuation of the uptrend.
If playing the above mentioned scenario, the target can be around 9.85 and stops below 6.645 (R:R=3.3).
It's also possible that we are going to see a deeper correction to 5.88 price level..so everyone should calculate and implement their own risk management strategy.
ETC annual yield: 1,023%
//
Follow me to stay updated.)

BCHUSD: possible long scenarioIn my previous post i was wondering whether BCHUSD going to go up.
Now BCHUSD price is testing the downtrend line formed since July 2019, if today the price closes above the line it seems reasonable to join bulls.
The target can be around 384 price or 61,8 Fibonacci retracement level, while setting stop below 218 is decent from R:R (4:1) prospective.
BCH annual yield: 3,7657%
//
Follow me to stay updated with my ideas!)

