Gold Crashes $100 After Hitting Monthly High | What’s Next?In this video, I break down everything that moved the price of gold last week, from the early-week rally toward $3,430 to the sharp midweek drop toward $3,325. We go beyond the surface, diving into what caused the reversal, and how I'm approaching next week’s market using a simple ascending channel on the 4-hour chart.
With major events like the FOMC rate decision, U.S. GDP, PCE inflation, NFP and the August 1 tariff deadline all on the radar, this analysis will help you stay grounded and prepare for volatility.
👉 If you find this content valuable, don’t forget to Boost, Comment, and Subscribe for weekly market breakdowns.
Disclaimer:
Based on experience and what I see on the charts, this is my take. It’s not financial advice—always do your research and consult a licensed advisor before trading.
#goldanalysis, #goldforecast, #xauusd, #goldpriceprediction, #technicalanalysis, #fundamentalanalysis, #tradingstrategy, #forextrader, #priceaction, #fomc, #usgdp, #pceinflation, #goldtrading, #forexeducation, #dollarvsgold, #tariffnews, #chartanalysis, #forexmentorship, #rebuildingthetraderwithin
FOMC

S&P 500 (ES1): Post FOMC, Buyers Pushing Back To The Highs!In this video, we will analyze the following FX market for July 31 - Aug 1st.
S&P 500 (ES1!)
In the Weekly Forecast for the S&P 500, we highlighted:
- price is bullish, and expected to go higher. It did move to ATH before pulling back.
- the sell side liquidity under the ascending lows would draw price.... which it did.
- the Area of Fair Value below the lows, with the Demand Zone as the potential level where a
a high probability long could setup.... which was spot on!
Did you benefit from the forecast? Let me hear from you if you did, in the comment section.
Enjoy!
May profits be upon you.
Leave any questions or comments in the comment section.
I appreciate any feedback from my viewers!
Like and/or subscribe if you want more accurate analysis.
Thank you so much!
Disclaimer:
I do not provide personal investment advice and I am not a qualified licensed investment advisor.
All information found here, including any ideas, opinions, views, predictions, forecasts, commentaries, suggestions, expressed or implied herein, are for informational, entertainment or educational purposes only and should not be construed as personal investment advice. While the information provided is believed to be accurate, it may include errors or inaccuracies.
I will not and cannot be held liable for any actions you take as a result of anything you read here.
Conduct your own due diligence, or consult a licensed financial advisor or broker before making any and all investment decisions. Any investments, trades, speculations, or decisions made on the basis of any information found on this channel, expressed or implied herein, are committed at your own risk, financial or otherwise.

FOMC rate decision 30-07-2025FOMC announced no change to interest rate, but the new tariffs is the major player for the upcoming quarter, we shall see its effect on the economy and corporates earnings soon, then the fed can make better judgment whether to lower interest rate or not.
Disclaimer: This content is NOT a financial advise, it is for educational purpose only.

USD Dollar Index (DXY): Pushing Higher As Forecast!Welcome back to the Weekly Forex Forecast for the week of July 30 - Aug1
In this video, we will analyze the following FX market:
USD Index
In my last USD video, the forecast was for higher prices. Check the related links below to see that video forecast. It played out exactly as analyzed. The +FVG was used to push for higher prices. The FOMC decision to keep the rate unchanged only pushed it further along.
Enjoy!
May profits be upon you.
Leave any questions or comments in the comment section.
I appreciate any feedback from my viewers!
Like and/or subscribe if you want more accurate analysis.
Thank you so much!
Disclaimer:
I do not provide personal investment advice and I am not a qualified licensed investment advisor.
All information found here, including any ideas, opinions, views, predictions, forecasts, commentaries, suggestions, expressed or implied herein, are for informational, entertainment or educational purposes only and should not be construed as personal investment advice. While the information provided is believed to be accurate, it may include errors or inaccuracies.
I will not and cannot be held liable for any actions you take as a result of anything you read here.
Conduct your own due diligence, or consult a licensed financial advisor or broker before making any and all investment decisions. Any investments, trades, speculations, or decisions made on the basis of any information found on this channel, expressed or implied herein, are committed at your own risk, financial or otherwise.

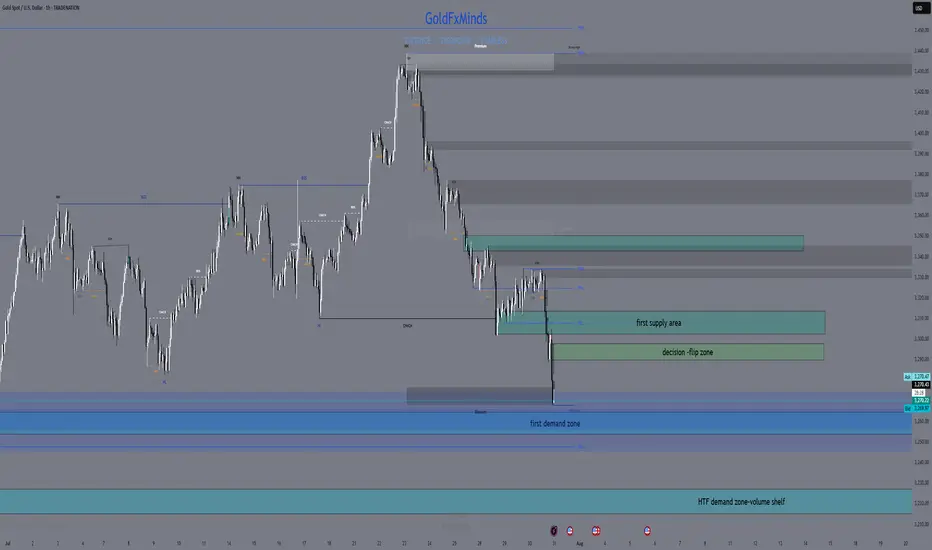
XAUUSD Market Update – July 30 Late NY Recap🔸Macro Context
Markets are still digesting Powell’s ongoing speech with no clear pivot signals. While FOMC tone remained cautious, no dovish surprise emerged. Trump’s upcoming comments keep geopolitical risks elevated. USD remains firm. Gold is reacting within key HTF demand as intraday volatility cools off.
🔸Bias Overview
Weekly Bias:
• Bearish rejection from the major supply wick 3439–3350
• Structure still below 3345, maintaining downside pressure
• Weekly RSI cooling off — no bullish divergence yet
Daily Bias:
• Lower high locked below 3345
• Price reentered the imbalance toward 3272
• Clean structure remains bearish unless we reclaim 3302
H4 Bias:
• Lower high formed at 3314
• Current price testing HTF Extreme Demand Base (3289–3272)
• Still bearish unless we see a confirmed M15 or H1 BOS from demand
🔸Key Structural Zones
🔺Above Price (3272):
• 3289–3294
Decision Block – M30 OB + FVG. First sign of momentum shift if reclaimed.
• 3302–3314
Supply Reversal – H1 OB + previous BOS zone. EMA alignment adds pressure.
• 3345–3350
Major Rejection Zone – H4 origin of last leg down. Strong resistance area.
🔻Below Price (3272):
• 3254–3264
Imbalance + OB – H4 FVG + clean demand zone. Buy setup only on deep flush + reversal PA.
• 3227–3214
HTF Demand Base – Daily OB + historical volume shelf. Final structural floor before deeper downside opens.
🔸Battle Plan
▶ Scenario 1 – Bearish Breakout
If 3272 fails with momentum and no reversal signs, expect continuation into 3254–3264.
No long trades unless BOS confirms.
▶ Scenario 2 – Reactive Long from Demand
If price gives a strong reaction from 3272 with BOS on M15 or H1 and clears 3294, then a recovery into 3302 is possible. Only valid with confirmed PA + EMA shift.
▶ Scenario 3 – Choppy Rejection from 3294
If price tests 3294 but fails, watch for rejections back toward 3272. Scalpers can fade reactions if no bullish structure forms.
🔸Final Thoughts
Price is once again testing our Extreme Demand Base from July 28 (3289–3272). The zone remains valid — but execution depends entirely on confirmation. Bears still in control unless we reclaim 3302 cleanly.
No need to rush. Best RR setups are found at clean structural edges.
Patience = profits.
—💬 Drop your thoughts in the comments.
❤️ Like if you appreciate the precision.
🔔 Follow GoldFxMinds for more sniper-level updates.
With you all the way,
— GoldFxMinds
📊 Analysis based on Trade Nation TradingView charts.
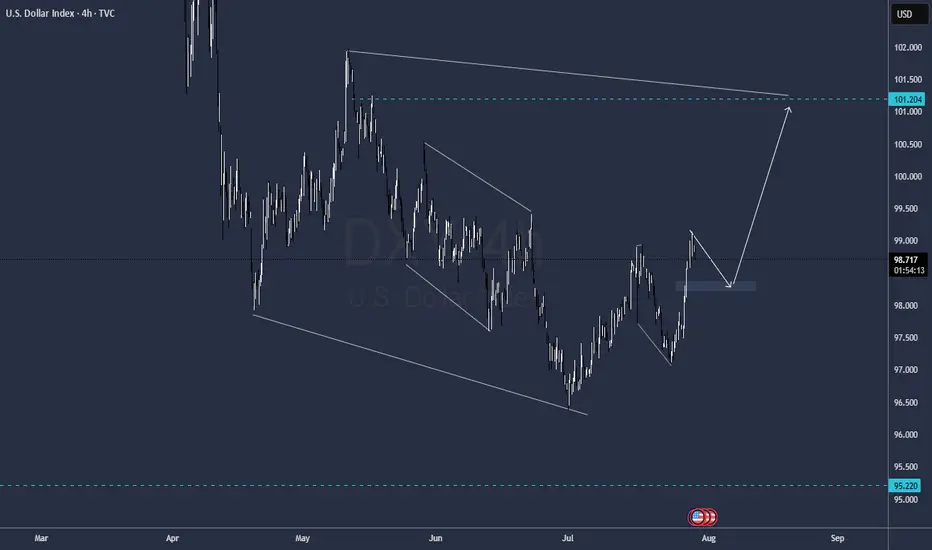
DXY Bulls Ready — Can Powell Spark the Rally?📊 DXY Pre-FOMC Outlook
In my previous analysis released on Monday, I expected the Dollar Index to fill the gap around the 98.60 zone and range below the key red line at 99.429.
Now, with less than 8 hours left until the highly anticipated FOMC rate decision, it’s time to take a closer look at tonight’s event and what it could mean for the markets.
From a purely technical perspective — setting the news aside — the Dollar Index looks ready to break through the crucial 100 level and kick off a strong bullish rally.
However, recent political pressure from Trump urging rate cuts, along with visible tension between him and Fed Chair Jerome Powell, has created uncertainty. If it weren’t for these conflicting signals, I would’ve confidently expected a clean breakout above 100.
As much as I enjoy trading news-driven events, I’ll likely stay out of the market tonight and observe from the sidelines. The setup is tempting, but the dual narratives make it risky.
That said — if you ask for my final take — I believe the stage is fully set for a bullish dollar and a corresponding drop in gold, EUR, GBP, and other major assets.
Let’s see how it plays out. 👀💥

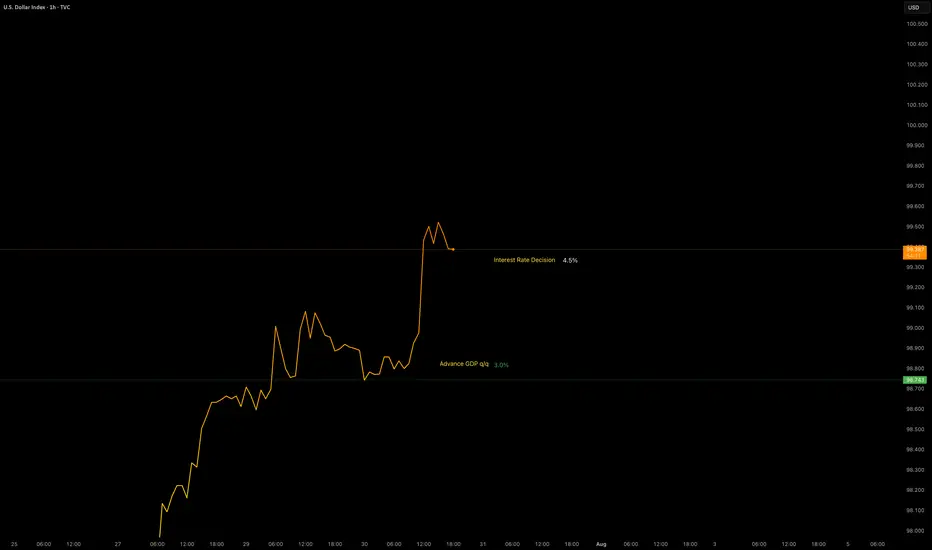
Data Release - Interest Rate DecisionJul 30 2025: Interest Rate Decision (4.5%)
Rates remain unchanged as expected.
OANDA:XAUUSD remains bearish with the help of GDP data.
TVC:DXY remains bullish with the help of GDP data. No major changes in either pairs.
Volatility is increased.
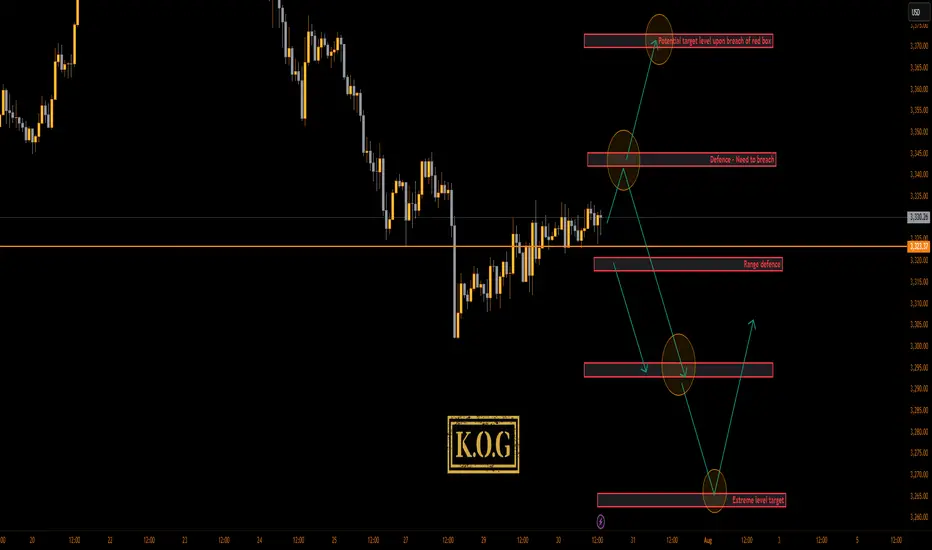
THE KOG REPORT - FOMCTHE KOG REPORT – FOMC
This is our view for FOMC, please do your own research and analysis to make an informed decision on the markets. It is not recommended you try to trade the event if you have less than 6 months trading experience and have a trusted risk strategy in place. The markets are extremely volatile, and these events can cause aggressive swings in price.
It’s been an aggressive month on the markets especially this week which has been testing for traders due to the extended movement on gold. We’ve managed to stay ahead of the game and although we missed the move downside, we’ve capture scalps up and down trading it on an intra-day basis rather than a swing.
Looking at the 4H chart, we can see we have support forming at the 3310 level which is the key level for this week and will need to be broken to go lower. If we can flip the 3334 resistance, price should attempt higher into the 3355-60 region which is where we may settle in preparation for NFP. on Friday This is the level that needs to be watched for the daily close, as a close above will confirm the structure and pattern test which can form a reversal if not breached.
Now, here is the flip! We’re still sitting below the daily red box but we know this break does give a retracement and with sentiment long, it may not be a complete retracement again. Here 3345-50 is the red box to watch and as above, if not breached, we may see a rejection here which will confirm no reversal for higher and, potentially a further decline into the 3270-5 regions for the end of the month and quarter.
Pivot – 3323-6
RED BOX TARGETS:
Break above 3335 for 3338, 3340, 3345, 3347 and 3357 in extension of the move
Break below 3320 for 3310, 3306, 3302, 3297 and 3393 in extension of the move
Please do support us by hitting the like button, leaving a comment, and giving us a follow. We’ve been doing this for a long time now providing traders with in-depth free analysis on Gold, so your likes and comments are very much appreciated.
As always, trade safe.
KOG
LONG ON NZD/USDNZD/USD is at a major demand level.
Dollar is bearish. Economic News this afternoon should assist and pushing this pair up.
Looking to catch 200 pips to the previous high.

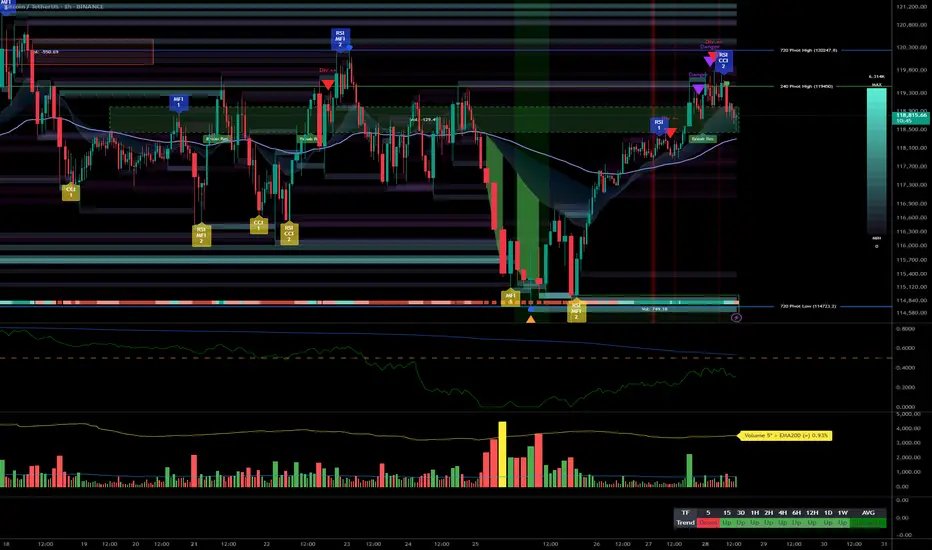
BTC – Pre-FOMC consolidation, bullish momentum, key zones__________________________________________________________________________________
Technical Overview – Summary Points
__________________________________________________________________________________
Momentum : Primary uptrend confirmed on all swing timeframes (daily to 1H). Active consolidation below major resistance (119650–120247), no capitulation or massive selling signals at this stage.
Major Supports / Resistances :
Main Supports: 116950, then 114732. Structural invalidation if daily close below 114K or low <110K.
Key Resistances: 119650–120247 (recent block), then 123218. Clean breakout >125K targets next stat zone at 141K.
Volumes : Transactional flows remain healthy, no anomalies or distribution events; normal volumes with a few impulsive bursts. No panic or selling climax detected.
Multi-timeframe behavior : Uptrend alignment from 1D to 2H; short-term divergence (MTFTI “Down” on 30m/15m/5m) indicates only breath/consolidation pre-macro event (FOMC).
__________________________________________________________________________________
Strategic Summary
__________________________________________________________________________________
Global Bias : Medium/long-term bullish bias, confirmed, with no behavioral excess or visible structural weakness.
Opportunities : Pullbacks to major supports (116950–114732) offer strategic accumulation. Potential for adding exposure on clear breakout above 125K with volume confirmation.
Risk Areas : Post-FOMC flushes, anticipated high volatility until Thursday morning, $115–123K range still active. Tactical stop loss below 114.5K, structural recalibration <110K.
Macro Catalysts : FOMC tonight (20:00 Paris): status quo expected, but markets highly sensitive to Powell’s statement. Widened spreads, max volatility expected within the following 2 hours.
Action Plan : Favor patience on breakout, accumulate on retracement, keep stops disciplined. Avoid aggressive scalping until post-FOMC volatility peak fades.
__________________________________________________________________________________
Multi-Timeframe Analysis
__________________________________________________________________________________
1D (Daily): Uptrend confirmed up to dense resistance zone 119800–123200. Solid momentum, no excess on Risk On / Risk Off Indicator or volume. Key Supports: 116950, 114732.
12H/6H/4H: Structured consolidation below 120247–119650. No behavioral warnings; markets strong, healthy liquidity. Accumulation-distribution rhythm without extremes.
2H/1H: Sideways, no sell-off or euphoria; potential consolidation before breakout. Major supports unchanged.
30min/15min: Noticeable short-term divergence (“Down”). Micro bearish setup, possible loss of short-term momentum before FOMC.
Summary: Broadly bullish swing trend with consolidation below resistance, reinforcement possible on breakout; short term fragile until macro moves (Fed) are digested.
Patience is key ahead of FOMC: prioritize accumulation on major pullback, keep stops disciplined, and avoid intraday over-trading unless clear exhaustion signals emerge.
__________________________________________________________________________________
Risk On / Risk Off Indicator: Strong Buy from 1D to 1H, intact sector support, positive structural bias.
ISPD DIV: Neutral across all timeframes: no excess, no behavioral climax.
On-chain/macro: 97% of holders still in profit; market absorbed stress test ($9B sell-off); only moderate euphoria, consistent with late bull phase but not exhausted.
Swing validation if >125K.
Tactical stop <114.5K; full capitulation <110K.
__________________________________________________________________________________

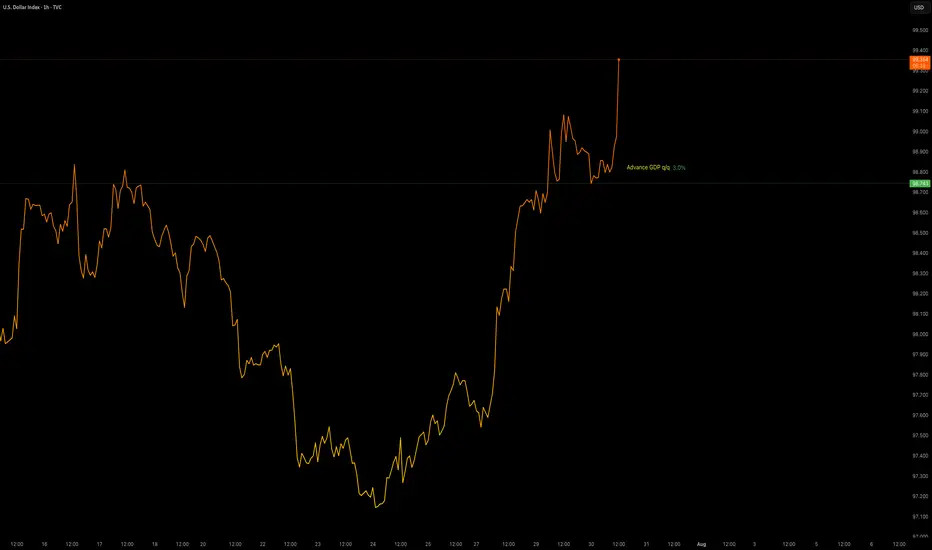
Data Release - Advance GDP q/q (3.0%)Jul 30 2025: ADVANCE GDP q/q (3.0%)
OANDA:XAUUSD sees some downside pressure with positive GDP data.
TVC:DXY gaining strength.
Volatility is increased. This data will be used with Interest Rate Decision later in the day to provide a XAUUSD insight.
Gold’s Biggest Day of 2025: Collapse or New High Incoming?🟡 Gold Pre-FOMC Update | Patience Paid Off
In my previous analysis released on Monday, we highlighted the significance of the 3310 key red level on gold. I mentioned that if we got a daily candle close below this zone, it could trigger further downside.
That scenario didn’t play out — price closed above 3310, and that’s exactly why we stayed out of any short positions. No guessing, no forcing. Just patience.
On the flip side, I also said we need a daily close above 3350 to even consider going long. And as you can see, for the past two days, price has been ranging tightly between 3310 and 3330 — with relatively low trading volume across the board.
After 9 years of optimizing this strategy, one core principle remains unchanged:
🛡️ Capital protection and maximum risk control always come first.
And I can confidently say — those filters are working beautifully. I hope you’re benefiting from this approach too.
Now technically speaking, everything is lining up for a bullish DXY and bearish gold —
But tonight’s FOMC meeting and Powell vs. Trump drama will be the final trigger.
Let’s watch closely. Smart trading is patient trading. 🧠⚖️
🔁 This analysis will be updated whenever necessary.
Disclaimer:This is not financial advice. Just my personal opinion.

DXY Rebound Pulls EURUSD Below 1.16Following the DXY’s significant rebound off a 17-year trendline, the EURUSD has broken below a trendline that connected all consecutive lows of 2025. This opens the door to further bearish risks, with key support levels now in sight.
If the pair closes cleanly below 1.15, 1.1440 and 1.1380, downside extensions could reach 1.12 and 1.11, respectively.
On the upside, a close back above the 2025 trendline and the 1.18 mark could reinstate bullish momentum, potentially lifting the pair toward the 2021 highs between 1.20 and 1.23.
Written by Razan Hilal, CMT

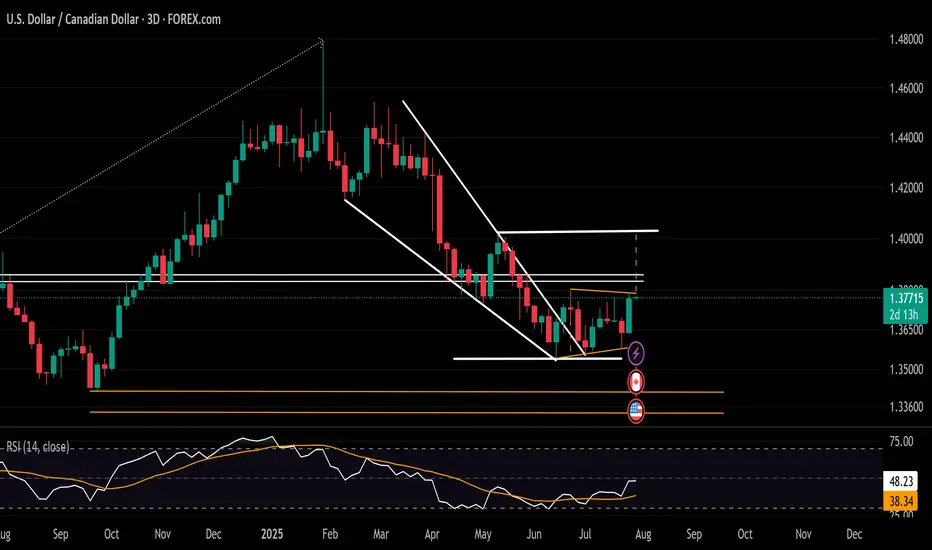
USDCAD Rebound Steadies Ahead of BOC and FOMC MeetingsAligned with the DXY holding above the 96 support and approaching the 100-resistance, the USDCAD is maintaining a rebound above the 1.3540 level.
It has maintained a hold beyond the boundaries of a contracting downtrend across 2025 and is aiming for the 1.38 resistance to confirm a steeper bullish breakout.
A sustained move above 1.38, which connects lower highs from June and July, while the RSI holds below the 50 neutral line, could extend gains toward the 1.40 level.
From the downside, should the breakout above 1.38 fail, the pair may remain trapped within the consolidation range extending from June, with initial support seen at 1.3580.
Written by Razan Hilal, CMT
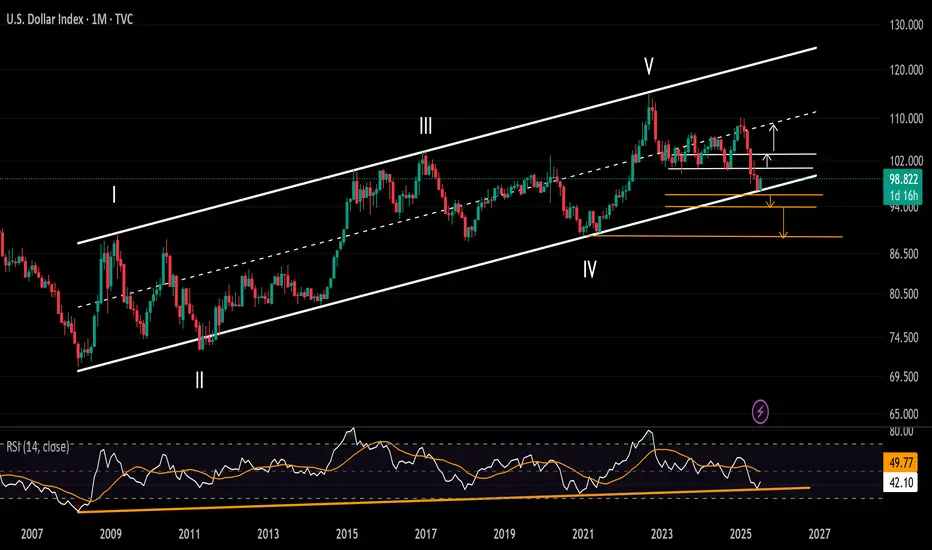
DXY Surge Pressures Currency Market in Volatile Market WeekThe US Dollar Index (DXY) has held its rebound off historical support zones on both the price chart and the RSI indicator throughout July. The monthly RSI is bouncing off a support line extending between the troughs of 2008 and 2020. Meanwhile, price action is rebounding from a support trendline that connects the lows of 2008, 2014, and 2021, within the 96–94 zone.
Bearish Scenario: A solid close below this support zone may confirm a long-term bearish signal, potentially pushing the index toward the 94 and 90 levels.
Bullish Scenario: A confident move above 100 and 103 could signal a reversal in the currency market, potentially leading the DXY back toward the mid-range of the long-standing channel between 105 and 107, originating from the 2008 lows.
Written by Razan Hilal, CMT
XAU/USD Intraday Plan | Support & Resistance to WatchGold remains in a bearish structure, consolidating in a narrow range after the sharp drop earlier this week. Price is trading around 3,330, testing the 3,334 resistance zone while still below the 200MA (3,362), which may act as dynamic resistance.
As long as price stays below 3,348–3,362, the bias remains to the downside, with a break below 3,309 likely exposing the 3,289–3,267 support zone.
A clean reclaim above 3,334- 3,348 would neutralize the immediate downside pressure and open the path back toward 3,373–3,387.
📌 Key Levels to Watch
Resistance:
‣ 3,334
‣ 3,348
‣ 3,362
‣ 3,373
‣ 3,387
Support:
‣ 3,309
‣ 3,289
‣ 3,267
‣ 3,241
🔎Fundamental Focus – FOMC
The FOMC rate decision and Powell’s press conference later today will be the key driver for gold. Expect sharp volatility and potential whipsaws around the release.
⚠️ Manage risk carefully, avoid chasing initial spikes, and wait for clear direction once the event dust settles.

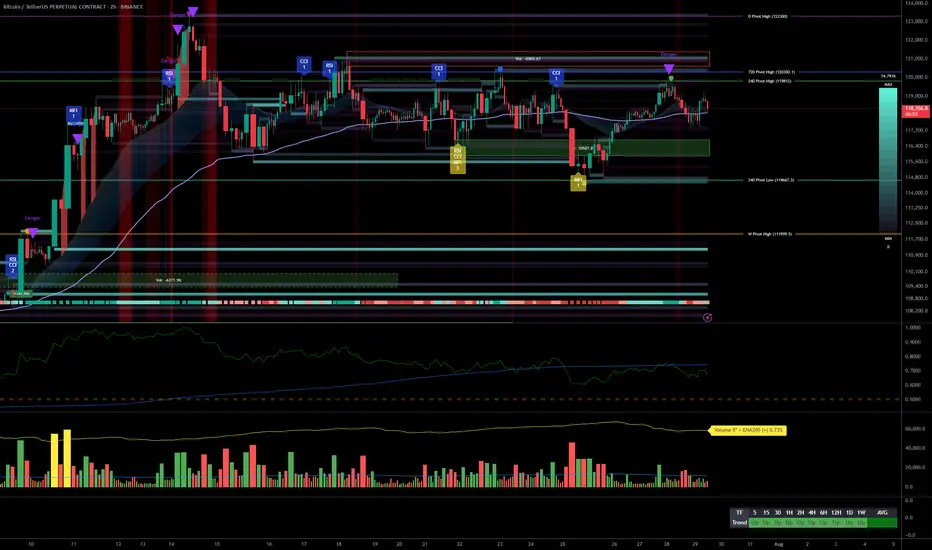
$BTC Daily OutlookDaily Chart
Today’s close printed a small bearish doji; visually bearish but still another inside-day that keeps BTC boxed between the High-Volume Node / v-Level cluster at $116 860-$123 300.
Holding $116 860 remains critical; lose it on a daily close and price can easily slide to the weekly breakout shelf near $111 960. We are now 16 days inside this balance. Per Auction-Market-Theory rule #5, the longer price churns at the edge, the more resting liquidity is absorbed, eventually a decisive push will follow. If buyers defend $116 860 again, the path opens toward range high $123 300 and the prior ATH; if they fail, expect a fast flush to the weekly V-Level.
Footprint Read
Value Area High and Low span the full candle, with the POC parked mid-range, classic two-sided trade. Delta finished negative and the heaviest prints sit at session lows: sellers hit the bid hard, yet could not follow through. That absorption leaves shorts vulnerable to a squeeze if new selling momentum doesn’t appear quickly.
Fundamental Pulse – Week Ahead
ETF Flows: Spot-Bitcoin ETFs booked three consecutive inflow days to close last week (+$180 M net). Sustained demand under the range supports the bullish case.
Macro Data: U.S. FOMC & Federal Fund Rates prints for this week; expect more volatility starting from tomorrow.
Game Plan
Primary bias stays long while daily candles close above $116 860; upside trigger is a clean for now or shorts squeeze toward $123 300.
If $116 860 breaks with volume, prepare for a quick liquidity hunt into the weekly shelf at $111 960, where we reassess for swing longs.
Intraday: I’ll monitor the Intraday Chart on tomorrow's High impact events and look for best opportunities across the board. Alt window: a fresh downtick in BTC Dominance could spark rotation; watch high-Open Interest majors if BTC ranges.

DXY FOMC FORECASTCristal Clear structure to me, dolar down today before FOMC and then up wild
Levels highlighted
Najors Gold and Cryptos will follow the same behavior
GG
Multi-timeframe analysis, strong momentum, FOMC risk/reward plan__________________________________________________________________________________
Technical Overview – Summary Points
__________________________________________________________________________________
Strong momentum and bullish consensus confirmed across all timeframes.
Key support/resistance : 114k–116k (critical support), 123k (major pivot).
Healthy organic volume , no extreme peaks except isolated moments (30min/15min).
Risk On / Risk Off Indicator : Dominant bullish signal, neutral only on 15min.
Multi-timeframe structure : Perfect alignment daily/4H/2H/1H, caution on 15/30min (slight inflection but no abnormal divergence).
__________________________________________________________________________________
Strategic Summary
__________________________________________________________________________________
Global bias : Structural bull market, intact dynamic.
Opportunities : Tactical buys on pullbacks (114–116k), swing on breakout 123k.
Risk areas : Below 114k = risk of invalidation, targets 111k–105k.
Macro catalysts : FOMC imminent (high volatility expected), watch geopolitical tensions.
Action plan : Favor swing/cautious trading ahead of FOMC, dynamic stops, act on first post-Powell trigger.
__________________________________________________________________________________
Multi-Timeframe Analysis
__________________________________________________________________________________
1D : Active range 114k–123k; strong supports, momentum maintained; Risk On / Risk Off Indicator strongly bullish.
12H/6H/4H : Clean bullish structure, no excesses or divergence; price sits within major horizontal clusters.
2H/1H : Healthy impulse/correction phases; key intermediate supports 114.6k, 117.5k to watch.
30min/15min : Slightly weaker momentum but constructive microstructure, no immediate sell threat; localized volume spikes on support reactions.
ISPD DIV : No behavioral stress observed throughout.
Cross-timeframe summary : Bullish confluence dominant; caution on short-term reversals tied to FOMC and on-chain volatility spikes.
__________________________________________________________________________________
Multi-timeframe Cross Analysis & Decisional Rationale
__________________________________________________________________________________
As long as BTC > 114k = bullish bias, buying pullbacks, swing target 123k.
Active management post-FOMC strongly advised (enter/reduce after first H4 close).
Increased volatility risk in case of Fed/geopolitical shock; mandatory stops.
Sector momentum (Risk On / Risk Off Indicator) and volume underpin the bullish case unless exogenous alert.
Invalidation below 114k = prudent, neutral, or tactical shorts towards 111k–105k.
__________________________________________________________________________________
Macro, On-chain & Economic Calendar
__________________________________________________________________________________
FOMC July 29th : pivotal event, any surprise = strong intraday move (BTC sensitive to Powell speech).
US Macro: strong fundamentals but caution on trade war, inflation "contained."
On-chain : realized cap BTC >$1T, high open interest in derivatives = leveraged risk, beware speculative altcoin excess.
Global risk : market remains buyer until bearish Fed/geopolitical shock; swing trading favored, tight stops recommended.
__________________________________________________________________________________
Action plan
__________________________________________________________________________________
Favor buying/reloading on pullbacks to 114.6k–116k (stop <114k).
Break above 123k = bull confirmation, further extension likely to 126–128k depending on FOMC outcome.
Prioritize strict risk management; monitor liquidity/supports on macro/on-chain volatility peaks.
__________________________________________________________________________________
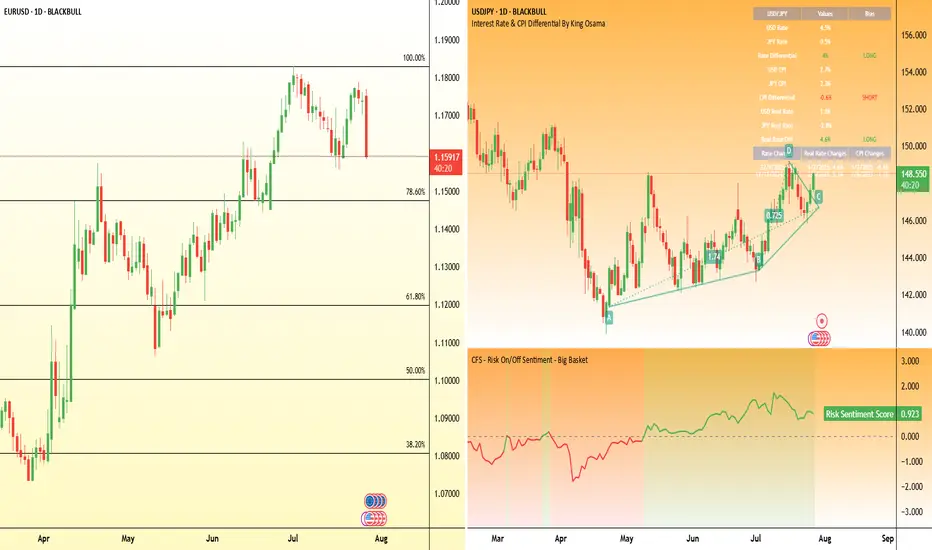
Countdown to Powell’s rate decision: What to watch WednesdayFederal Reserve Chair Jerome Powell is under mounting pressure from President Donald Trump to begin cutting interest rates.
Markets and analysts overwhelmingly expect the Fed to hold rates steady this Wednesday.
But what if the political heat is becoming too much to bear, and Powell and the Fed board advocate for a cut this week? Some Fed governors, Chris Waller and Michelle Bowman , have already signaled support for an early cut.
FX pairs to watch
USD/JPY:
This pair remains highly sensitive to yield differentials and broader risk sentiment. However, any hawkish resistance or emphasis on data dependency may keep the pair supported, especially if risk appetite holds.
EUR/USD:
The euro has shown relative strength in recent sessions, but the pair has been hit by the announcement of the trade deal struck between the EU and US. If the Fed clearly signals it's not ready to ease, the USD could regain even ground.
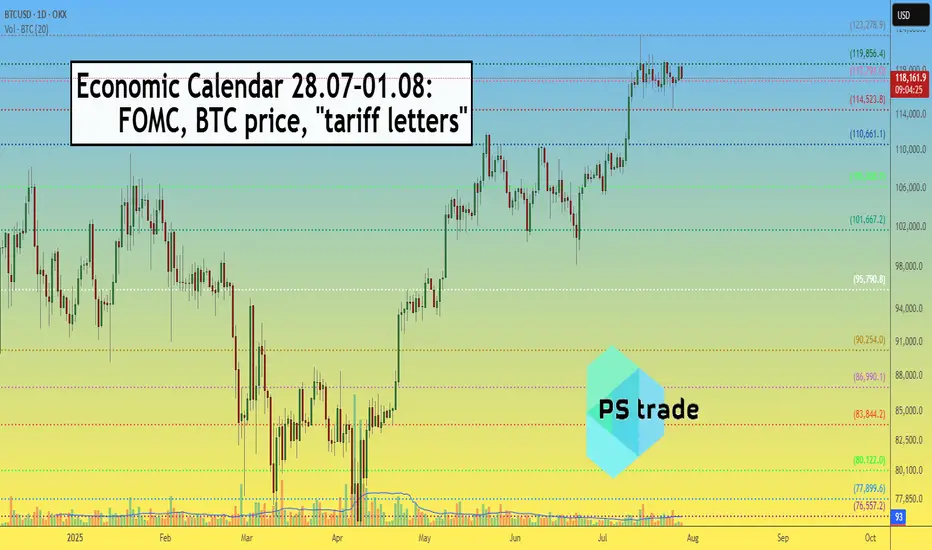
Very important Economic Calendar 28.07–01.08: FOMC, BTC, tariffsThis Week (July 28 – August 1) — the final week of the month is packed with key events.
Save this post and forward it to 3 friends 😉
📋 High volatility ahead — as the Fed’s key "threelemma" (inflation, labor market, tariffs) comes into focus.
Several important macro releases are scheduled — each one matters on its own, but combined, they can move markets sharply.
🗓 Monday (July 28)
▪️ 12:30 UTC – QRA (Part 1): upcoming US Treasury borrowing needs
▪️ 16:00 UTC – 2Y & 5Y bond auctions – key indicator of market expectations ahead of FOMC
🔗 Strong demand = stronger rate cut expectations
🗓 Tuesday (July 29)
▪️ 12:30 UTC – US GDP (Q2 estimate)
▪️ 16:00 UTC – 7Y bond auction
🗓 Wednesday (July 30)
▪️ 12:15 UTC – ADP employment report – early signal ahead of NFP
▪️ 12:30 UTC – QRA (Part 2): breakdown of Treasury borrowing
▪️ 18:00 UTC – FOMC rate decision (no change expected – 4.5%) + Powell’s press conference
🗓 Thursday (July 31)
▪️ 12:30 UTC – PCE inflation (June) – Fed’s favorite inflation gauge
🗓 Friday (August 1)
▪️ 12:30 UTC – Nonfarm Payrolls (employment)
▪️ 13:00 UTC – ISM Manufacturing Index (July)
▪️ 13:00 UTC – Univ. of Michigan Consumer Sentiment Index
▪️ All day – July auto sales data
🚨 LIBERATION DAY 2.0
Potentially the most impactful event of the week: the Trump administration will begin sending “tariff letters” to ~200 countries.
This marks the end of the temporary tariff relief (April 8 – August 1).
Markets expect a new wave of global trade tension — timing is still uncertain.
💡 Summary:
Every day brings a new potential driver.
Markets are nervous and highly reactive — sharp moves are likely...
CRYPTOCAP:BTC is currently being held above $117K, but Wednesday and Friday bring high risk of "news bombs".
Strategic Multi-Swing Analysis – Pivots and Post-FOMC Outlook__________________________________________________________________________________
Technical Overview – Summary Points
➤ Sustained bullish momentum on BTCUSDT across all swing timeframes.
➤ Key supports: 116400–117400 (likely rebound), major supports: 105047–114674.
➤ Main resistances: 119000–120000 (short term), major ceiling at 123240 (1D/12H).
➤ Risk On / Risk Off Indicator: "Strong Buy" signal – tech sector leadership confirmed.
➤ Volumes normal to moderately elevated, no excess or behavioral anomaly (ISPD "Neutral").
➤ No euphoria or capitulation flags; general wait-and-see attitude, FOMC event ahead.
__________________________________________________________________________________
Strategic Summary
➤ Strategic bullish bias remains as long as 116400/117400 supports hold.
➤ Opportunity window: buy pullbacks towards 117400–116400 with tight stops; clear invalidation below 115900.
➤ Risks: FOMC-induced volatility, increased leverage on alts, potential capitulation if key support breaks.
➤ Catalysts: FOMC communication, geopolitical context (no immediate threat), background risk-off climate not yet triggered.
➤ Action plan: Prioritize post-event reaction over anticipation; maintain strict technical protection.
__________________________________________________________________________________
Multi-Timeframe Analysis
1D: Uptrend confirmed. Price above all major supports. Strong resistance at 123240, key support at 105047, normal volumes, Risk On / Risk Off Indicator "Strong Buy", ISPD "Neutral".
12H: Bullish bias. Resistance cluster 120002–123240. Intermediate supports 114674/111949. Momentum/volume supported, no excesses.
6H: Bullish near range top, supports at 114674/111949, ceiling at 120002–123240. Solid Risk On / Risk Off Indicator.
4H–2H: Up momentum, resistance 119003–120002–123240, supports 116474/117800. Moderate/normal volumes.
1H: Strong uptrend, thick resistance at 119000–120000, immediate supports 117800/116474. Slight volume uptick ahead of FOMC.
30min–15min: Resistance 119003–120000 (~H4 pivot). Intraday support 117400–117800/118200. Both Risk On / Risk Off Indicator and ISPD neutral, normal volumes, bullish as long as 116474 holds.
SYNTHESIS: Broad bullish confluence on MTFTI from 1H to 1D/W.
Supports at 116474/117400 are key pivots for maintaining bullish swing view.
No behavioral alerts or extreme volumes.
Consolidation/waiting likely before FOMC release – monitor reactions at pivot zones.
__________________________________________________________________________________
Strategic decision & macro
Opportunities: Swing bullish scenario favored as long as key supports hold, buy strategic pullbacks, reverse on clear break.
Main risk: FOMC volatility, altcoin excesses, possible post-announcement fake moves. Active monitoring essential.
Macro/on-chain: No excess, BTC realized cap > $1T; aggressive rotation into alts, high open interest. No capitulation. Major on-chain & technical support aligned at 114500–118000.
Action plan: Favor reactivity (post-FOMC), tight stops, progressive take profits at 119500–123240 resistance. No aggressive pre-positioning.
__________________________________________________________________________________
Macro catalysts overview
FOMC expected: status quo, market sensitive to any Powell tone shift.
Global macro: latent risk-off, geopolitical drivers closely watched.
BTC stable, no technical disruptor in the immediate term.
__________________________________________________________________________________
Final Decision Summary
Robust technical setup with a clear bullish bias. Optimal entries on 117400-116400 pullbacks, stops below support, active management needed during FOMC. No on-chain excess; constructive background unless exogenous shock or resistance failure (119000–123240). Stay alert for breakout/reject pivot.
__________________________________________________________________________________
GBPUSD: Sellers Are Taking ControlWelcome back to the Weekly Forex Forecast for the week of July 28 - Aug 1st
In this video, we will analyze the following FX market:
GBPUSD
GBP is weak vs USD. GU is heading lower with a bit of steam.
The Monthly and the Weekly are still bullish, but the Daily and 4H indicate weakness. I would not entertain longs until I see a bullish BOS.
Look for the CISD on the 4H in the beginning of the week, confirming sells are the way to go.
Enjoy!
May profits be upon you.
Leave any questions or comments in the comment section.
I appreciate any feedback from my viewers!
Like and/or subscribe if you want more accurate analysis.
Thank you so much!
Disclaimer:
I do not provide personal investment advice and I am not a qualified licensed investment advisor.
All information found here, including any ideas, opinions, views, predictions, forecasts, commentaries, suggestions, expressed or implied herein, are for informational, entertainment or educational purposes only and should not be construed as personal investment advice. While the information provided is believed to be accurate, it may include errors or inaccuracies.
I will not and cannot be held liable for any actions you take as a result of anything you read here.
Conduct your own due diligence, or consult a licensed financial advisor or broker before making any and all investment decisions. Any investments, trades, speculations, or decisions made on the basis of any information found on this channel, expressed or implied herein, are committed at your own risk, financial or otherwise.
