FOMC FORWARD GUIDANCE SINCE 2018 w/FED SPEAKERS w/SPX The chart provided visually represents the forward guidance issued by the Federal Open Market Committee (FOMC) alongside the performance of various key economic indicators and market indices. The FOMC forward guidance serves as a crucial tool for signaling the Federal Reserve's monetary policy stance and future intentions, thereby influencing market expectations and economic behavior.
By examining the interplay between FOMC forward guidance and these key economic indicators, investors, policymakers, and analysts can gain insights into the likely direction of monetary policy and its potential impact on financial markets and the broader economy.
I have also included comments from various FOMC speakers to better form a picture of the past.
FOMC

Interest Rate Cuts 3 Times This Year May Not Happen - Here's WhyMany interpreted from the latest FOMC meeting that the Fed is going to have three rate cuts this year, but Jerome Powell did not say that.
Let me quote directly from his transcript:
“If the economy evolves as projected, the median participant projects that the appropriate level of the federal funds rate will be 4.6 percent at the end of this year”
And he added:
“These projections are not a committee decision or plan”
In today’s tutorial we will discover why so many of us got it wrong in what he is trying to tell us.
And who are these participants?
10-Year Yield Futures
Ticker: 10Y
Minimum fluctuation:
0.001 Index points (1/10th basis point per annum) = $1.00
Disclaimer:
• What presented here is not a recommendation, please consult your licensed broker.
• Our mission is to create lateral thinking skills for every investor and trader, knowing when to take a calculated risk with market uncertainty and a bolder risk when opportunity arises.
CME Real-time Market Data help identify trading set-ups in real-time and express my market views. If you have futures in your trading portfolio, you can check out on CME Group data plans available that suit your trading needs www.tradingview.com

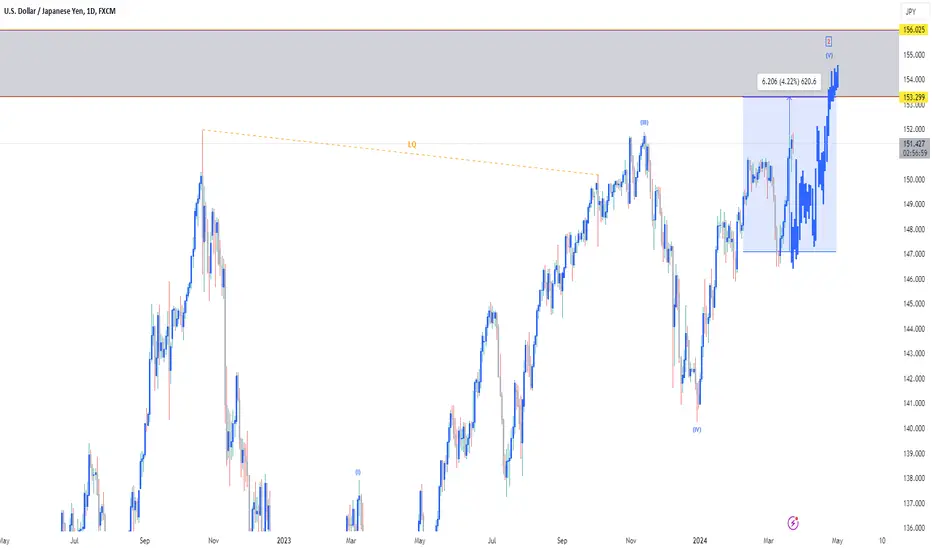
USDJPY LONG TO $153.300 (UPDATE)📈Similar to the DXY, FOMC made USDJPY push down when news came out, trapped in new sellers then went right back into our direction. Currently running 410 PIPS in profit.
Make your position risk free if you haven't already🤙🏽
SELL GOLDGOLD has taken out stops above the 2200 zone, huge drop incoming. Entry at 2204 stops above 2215. Targets below 2150 and lower. Use proper risk management.

The FOMC meeting, rising wedge, and VIX dropYesterday’s FOMC meeting ended as widely anticipated, with no change to monetary policy. During the press conference, the FED’s chairman reiterated the central bank’s commitment to bringing inflation under control and outlined a strong economy and tight labor market. Jerome Powell also described inflation as being on a downward trajectory and explained the need to stay attentive to inflation rates. In addition to that, he acknowledged the emergence of some negative effects of high interest rates on the economy.
Markets reacted positively to Jerome Powell’s statements and rallied across the board. The SPX broke above $5,200 and established a new all-time high at $5,226. Simultaneously, the VIX experienced a significant drop that led to the distortion of its broadening structure on the daily chart. While the SPX remains over-extended above the upward-sloping channel, this drop could foreshadow the SPX’s move slightly higher, in the area between $5,300 and $5,350.
Particular things to watch out for in the following days include the next developments with the VIX, the rejection/success of RSI breaking above 70 points (on the daily time frame), the support at $5,180, and the pattern resembling a rising wedge (on the 4-hour time frame).
Illustration 1.01
Illustration 1.01 displays the VIX’s daily graph. The yellow arrow indicates a breakout below the lower trendline, distorting the structure with higher peaks and higher troughs.
Illustration 1.02
The picture above shows the 4-hour chart of the SPX. Yellow dashed lines highlight the pattern resembling a rising wedge formation.
Here are some of the most important statements from Jerome Powell’s speech:
“Inflation has eased substantially while the labor market has remained strong, and that is very good news. But inflation is still too high, ongoing progress in bringing it down is not assured, and the path forward is uncertain. We are fully committed to returning inflation to our 2 percent goal.”
“Our restrictive stance of monetary policy has been putting downward pressure on economic activity and inflation. As labor market tightness has eased and progress on inflation has continued, the risks to achieving our employment and inflation goals are moving into better balance.”
“Activity in the housing sector was subdued over the past year, largely reflecting high mortgage rates. High interest rates also appear to have weighed on business fixed investment. In our Summary of Economic Projections, Committee participants generally expect GDP growth to slow from last year’s pace, with a median projection of 2.1 percent this year and 2 percent over the next two years.”
“Over the past three months, payroll job gains averaged 265 thousand jobs per month. The unemployment rate has edged up but remains low, at 3.9 percent. Strong job creation has been accompanied by an increase in the supply of workers, reflecting increases in participation among individuals aged 25 to 54 years and a continued strong pace of immigration”
“We believe that our policy rate is likely at its peak for this tightening cycle and that, if the economy evolves broadly as expected, it will likely be appropriate to begin dialing back policy restraint at some point this year. The economic outlook is uncertain, however, and we remain highly attentive to inflation risks. We are prepared to maintain the current target range for the federal funds rate for longer, if appropriate.”
“We know that reducing policy restraint too soon or too much could result in a reversal of the progress we have seen on inflation and ultimately require even tighter policy to get inflation back to 2 percent.”
“ If the economy evolves as projected, the median participant projects that the appropriate level of the federal funds rate will be 4.6 percent at the end of this year, 3.9 percent at the end of 2025, and 3.1 percent at the end of 2026—still above the median longer-term funds rate.”
“Turning to our balance sheet, our securities holdings have declined by nearly $1.5 trillion since the Committee began reducing our portfolio.”
Technical analysis gauge
Daily time frame = Bullish
Weekly time frame = Bullish
*The gauge does not necessarily indicate where the market will head. Instead, it reflects the constellation of RSI, MACD, Stochastic, DM+-, ADX, and moving averages.
Please feel free to express your ideas and thoughts in the comment section.
DISCLAIMER: This analysis is not intended to encourage any buying or selling of any particular securities. Furthermore, it should not be a basis for taking any trade action by an individual investor or any other entity. Therefore, your own due diligence is highly advised before entering a trade.

Levels discussed 21st March LivestreamMarch 21st
DXY: Consolidate along 103.25 (61.8%), could test 103 support, depending on BOE, could rebound to 103.60.
NZDUSD: Sell 0.6095 SL 20 TP 45
AUDUSD: Buy 0.6660 SL 20 TP 60
USDJPY: Sell 150.40 SL 50 TP 160
GBPUSD: Sell 1.2780 SL 25 TP 70 (Dovish BoE)
EURUSD: Sell 1.0920 SL 25 TP 80
USDCHF: Do nothing for now
USDCAD: Buy 1.3480 SL 20 TP 60
Gold: Stay above 2200 to maintain bullish, could retest 2223 and beyond that, 2238

BUY GOLDGold is looking ripe for a buy, entry at 2154, stops below 2148 our targets as high as 2176. Use proper risk management.
Expectation for todays fomc is a weak dollar.

Gold prices retreat amid strong US Dollar pre FOMC decisionGold prices fell late in the North American session on Tuesday amid a strong US Dollar but despite falling US Treasury bond yields. Market participants await the US Federal Reserve’s (Fed) monetary policy announcement on Wednesday, followed by a press conference by Fed Chair Jerome Powell. Meanwhile, XAU/USD prices are set to remain near $2,150 as traders remain uncommitted to posting fresh bets in favor or against the yellow metal.
The non-yielding metal remains subdued as traders await the Federal Open Market Committee (FOMC) decision. In addition to delivering its monetary policy statement, policymakers are expected to update their projections about the United States economy. Growing concerns that the Fed will reduce its estimates for the Federal Funds Rate (FFR) keep traders on edge.
Tuesday’s US economic docket featured the release of Building Permits in February, which rose by 1.9% MoM from 1.489 million to 1.496 million. Meanwhile, Housing Starts for the same period saw a significant increase of 10.7%, surpassing the expected 8.2%.
The US 10-year Treasury bond yield has fallen two-and-a-half basis points to 4.296%.
Recent inflation data in the US showed that inflation on the consumer and producer side surprised to the upside, suggesting that inflation is stickier than expected, failing to break below the 3% threshold.

THE KOG REPORT - FOMC The KOG REPORT – FOMC
This is our view for FOMC, please do your own research and analysis to make an informed decision on the markets. It is not recommended you try to trade the event if you have less than 6 months trading experience and have a trusted risk strategy in place. The markets are extremely volatile, and these events can cause aggressive swings in price.
Today’s FOMC may bring a curveball with it, so we’re going to use the extreme levels as usual, but, we’re going to say please play caution on the markets. The trade always comes after the event, patience will pay on this one!
We have the support level below 2150-55 as mentioned through the week, with resistance above 2175 which are both either side of range play at the moment. Our bias is still active, but, due to the volatility that may present itself, we’ll stick with the higher levels as potentials regions for a RIP. So, if price does carry up towards the 2175-85 region and we can see a clean set up, an opportunity to short the market back down initially into the 2155 levels and then on the break, below that 2148 and further down could be available.
Please note, that breaking above will invalidate this and we are likely to see higher pricing through the rest of the week. There was a level of 2210 in extension of the move, which is extreme volume enters is a possibility, so if you’re going to risk it, your risk model better be up to scratch!
On the flip. Rejection around this 2165 region, we can see price attempt the support 2145 and upon the break we will be looking for this to go lower, initially into the 2135 region and then below that potentially 2120! If we get that move to the downside, we will be looking to carry any open trades down into the given regions if we get a clean set up, and only long for the scalps and quick captures from the given levels.
In all honesty, right now thoughts are we would rather let this play out and let the take the price to where they want. We’ll still with the plan for now on the KOG Report which has worked well, but any trades should be protected and a majority taken.
Please do support us by hitting the like button, leaving a comment, and giving us a follow. We’ve been doing this for a long time now providing traders with in-depth free analysis on Gold, so your likes and comments are very much appreciated.
As always, trade safe.
KOG

USDJPY I FOMC analysis and forecast Welcome back! Let me know your thoughts in the comments!
** USDJPY Analysis - Listen to video!
We recommend that you keep this pair on your watchlist and enter when the entry criteria of your strategy is met.
Please support this idea with a LIKE and COMMENT if you find it useful and Click "Follow" on our profile if you'd like these trade ideas delivered straight to your email in the future.
Thanks for your continued support!

Plans for the US FOMC laterMarch 20th (FOMC in Mind)
DXY: Consolidate along 103.80, could break lower briefly, overall trade higher to 104.50 resistance.
NZDUSD: Buy 0.6060 SL 25 TP 65 (Counter Trend)
AUDUSD: Sell 0.6500 SL 20 TP 55
USDJPY: Sell 150.55 SL 40 TP 180
GBPUSD: Straddle Buy 1.2740 SL 25 TP 75 or Sell 1.2690 SL 30 TP 90
EURUSD: Test and reject 38.2%, Sell 1.0870 SL 20 TP 65
USDCHF: Buy 0.8905 SL 20 TP 55
USDCAD: Buy 1.3625 SL 20 TP 85
Gold: Below 2145 could trade down to 2125 (DXY strength dependent)

BoJ Hikes Rates, the first time in 17 years!Yesterday, the Bank of Japan (BoJ) released its decision to end eight years of negative interest rates, adjusting the short-term policy rate to around 0.00% to 0.10%.
Although an interest rate hike is supposed to lead to the currency strengthening, the Yen weakened following the release of the news, with the USDJPY climbing higher from 149.40 toward the resistance level of 151.
The BoJ also indicated that while it will scrap its YCC framework (upper bound of 1% on 10-year JGBs) it will continue to buy some Japanese Government Bonds (JGBs), maintaining a Quantitative Easing (QE) approach, hence keeping some aspect of the accommodative policy.
Markets anticipate that this could be a one off adjustment, and the BoJ is unlikely to follow yesterday's rate decision with a series of rate hikes. This could be considered as a Dovish rate hike.
The divergence in monetary policies between the BoJ and the FOMC (and other major central banks) continues, which is likely the cause of the continued weakness of the Yen.
Today, the Yen has continued to weaken, with the USDJPY breaking above the round number resistance of 151, and is likely to retest the historic high of 151.90, last reached in November 2023.
Attention now shifts toward the FOMC.

The end of the S&P uptrend?There has been a 12 week uptrend channel in the H4 timeframe starting from January 2024 through to today.
The S^P is now showing weakness as follows:
1) There is a triple top on H4 at 5190
2) Bearish Divergence
3) Resisted for 2 weeks in a row
4) Harmonic pattern to sell
Remember when a long bull run is broken, the bear run will be of a similar length.
Can you put up with 12 weeks of bearish moves? Time to take money off the table or if you are like me, go SHORT now.

Market Surprise? June Rate Cut Might Be Delayed Market Surprise? June Rate Cut Might Be Delayed
After today’s BOJ and RBA interest rate decisions, eyes will turn to the Fed’s decision on Wednesday.
Although the US central bank is expected to keep rates unchanged, it could change its outlook due to the upside surprise in the latest CPI and PPI reports.
For now, the first cut is still seen happening in June, but there is a possibility that this gets pushed back a month or two again. Maybe the market would be the only one surprised by this possibility.
But what USD pair could be interesting this week?
The Canadian Dollar is facing pressure in anticipation of the February inflation figures set to release on Tuesday. Analysts expect the annual headline inflation to have risen to 3.1% from January's 2.9%. This could postpone the Bank of Canada's intentions to lower interest rates, potentially leading to a clash with the Federal Reserve's monetary policy plans.
Depending on where market sentiment lay after we get the US and Canada data, the 100-day SMA could continue to support bulls. If sentiment turns, we have the 50- and 200-day SMA, which sits just above the ascending triangle trend, as a target for another support.

Analysis of RBA, BOJ, FOMC, SNB, BOE and the week aheadWeek of the 18th March (H4)
DXY: Stay below 50% (103.70) to maintain bearish view, could trade down to 102.40 support
NZDUSD: Buy 0.61 SL 30 TP 100
AUDUSD: Buy 0.6580 SL 40 TP 80 (Tuesday: RBA Decision)
USDJPY: Riskier: Sell 148.50 SL 80 TP 200 (Tuesday: BOJ Policy Decision)
GBPUSD: Buy 1.2760 SL 50 TP 100 (Thursday:BOE Voting)
EURUSD: Sell 1.0860 SL 30 TP 60 (If DXY strengthens)
USDCHF: Sell 0.8860 SL 35 TP 105 (Thursday: SNB decision)
USDCAD: Buy 1.3455 SL 30 TP 13 (Tuesday: CPI data)
Gold: Bounce off 2150 to retest high of 2200

USDCAD: ContinuationI'm expecting to see a continuation of this local uptrend, fully breaking through my descending dynamic channel.
USD has improving data, with CAD declining, and quite a lot of data this week that I believe will confirm my assumptions.

USDCHF Breakout and Potential RetraceHey Traders, in today's trading session we are monitoring USDCHF for a buying opportunity around 0.88100 zone, USDCHF was trading in a downtrend and successfully managed to break it out. Currently is in a correction phase in which it is approaching the retrace area at 0.88100 support and resistance area.
Adding a fundamental layer there is a contradictory between the inflation in the US and in Switzerland, Fed is concerned about the inflationary pressure and heading towards a rate hike meanwhile it's easing in Switzerland.
Trade safe, Joe.

EURUSD: Looking to resume downtrendThis current bullish move looks to be running its course, resembling a bull flag.
Will be waiting for a confirmation on LTF's to get in short, hopefully before the big news on Friday, which I expect to confirm interest rates staying as they are for longer, and a hawkish fed.

GBPUSD: Expecting a drop from hereEven though sterling has found recent resilience, we are in a long-term down trend.
I believe the recent rally must end, fundamentally the pound is much weaker than the dollar, the UK is in recession and the US looks likely to avoid one.
The FED will start cutting rates, but I believe the BoE will act sooner (or at the same time) because it doesn't have the grace of a strong economy.
On the LTF's we're at the top of this current dynamic rising range, but I think we may see a break of the lower boundary, and if we do this will be the resumption of the downtrend.

FOMC FORWARD GUIDANCE SINCE 2018 w/SPXThe chart provided visually represents the forward guidance issued by the Federal Open Market Committee (FOMC) alongside the performance of various key economic indicators and market indices. The FOMC forward guidance serves as a crucial tool for signaling the Federal Reserve's monetary policy stance and future intentions, thereby influencing market expectations and economic behavior.
By examining the interplay between FOMC forward guidance and these key economic indicators, investors, policymakers, and analysts can gain insights into the likely direction of monetary policy and its potential impact on financial markets and the broader economy.

EUR/USD : Expect a Fall ? Let's See ! (READ THE CAPTION)With a new review of the Euro/Dollar chart, we can see that the price has been corrected by entering the old FVG range and is currently trading in the range of 1.08 ! The first scenario is the fall from this range and the second scenario is the first rise to 1.087 and then the start of the fall again! Considering today's important meeting of the Federal Reserve, we cannot consider one scenario with more certainty, so we will follow the chart step by step!
Please support me with your likes and comments to motivate me to share more analysis with you and share your opinion about the possible trend of this chart with me !
Best Regards , Arman Shaban

CADUSD: Looking very bearish to meI'm expecting to see USD strength through March with a Hawkish Fed that has strength ibn their economy, compared to all other crosses.
Looking at the 4hr chart I'm seeing a couple of bearish engulfing candles and therefor looking for a short in an LTF.
There is very choppy water between 0.735 and 0.7366 so we may see a lot of indecision here but I'm overall bearish and expect the drop down to major support.

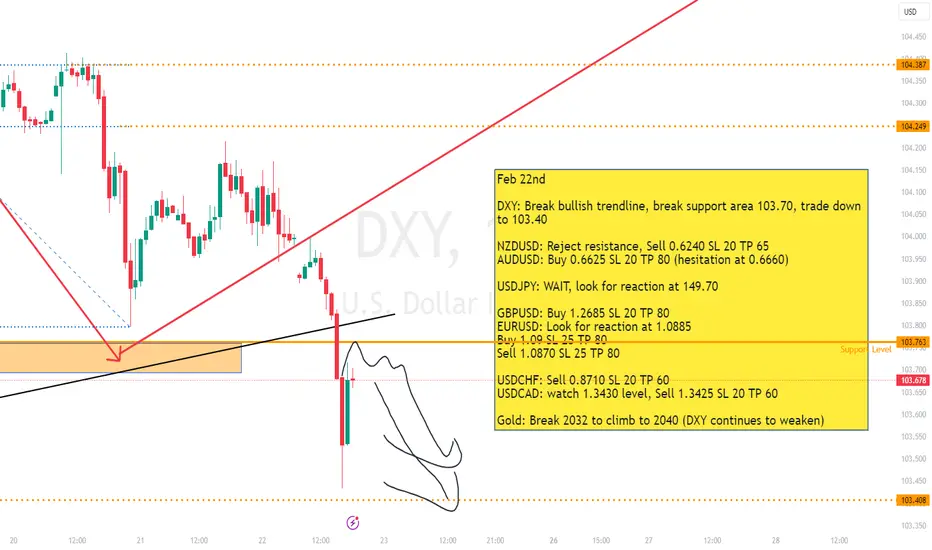
Levels discussed on Livestream 22nd FebFeb 22nd
DXY: Break bullish trendline, break support area 103.70, trade down to 103.40
NZDUSD: Reject resistance, Sell 0.6240 SL 20 TP 65
AUDUSD: Buy 0.6625 SL 20 TP 80 (hesitation at 0.6660)
USDJPY: WAIT, look for reaction at 149.70
GBPUSD: Buy 1.2685 SL 20 TP 80
EURUSD: Look for reaction at 1.0885
Buy 1.09 SL 25 TP 80
Sell 1.0870 SL 25 TP 80
USDCHF: Sell 0.8710 SL 20 TP 60
USDCAD: watch 1.3430 level, Sell 1.3425 SL 20 TP 60
Gold: Break 2032 to climb to 2040 (DXY continues to weaken)