TLT - is now the time to start accumulating?Long duration treasury ETF's have long been touted as hedges against risk and inflation. However, treasury prices and rates have an inverse relationship. When the US Treasury issues new bonds during a rate hiking cycle, it depresses the prices of the long duration treasuries within these ETFs. Conversely, when rates reach their peak and subsequently start to decline, these ETFs will hold treasuries with higher rates than the newly issued ones. This explains why we see TLT price increasing in a low rate environment and decreasing in a rising rate environment.
If we are near the conclusion of this rate hiking cycle we should see a little more consolidation in TLT, followed by price increase. I have been and will continue to add to my position anytime we are close to $100 during this consolidation. I'll begin to take profit $112-114 and then re-evaluation market conditions.
FOMC

🔥 Bitcoin In Danger 🚨 Bearish Divergence Playing Out!Last week I made an analysis on BTC's bearish divergence on the 3-day chart. Seeing the bearish price action we got recently, it seems that this bearish divergence is playing out well.
In my eyes, it's very likely that BTC will go down from here onwards. Next target is the dotted purple support line.
Seeing there's another FOMC interest announcement tomorrow, Bitcoin is in danger of breaking through said support in case the market doesn't like tomorrow's meeting. In that case, my expectation would be that the top for 2023 is in.
All eyes on tomorrow.

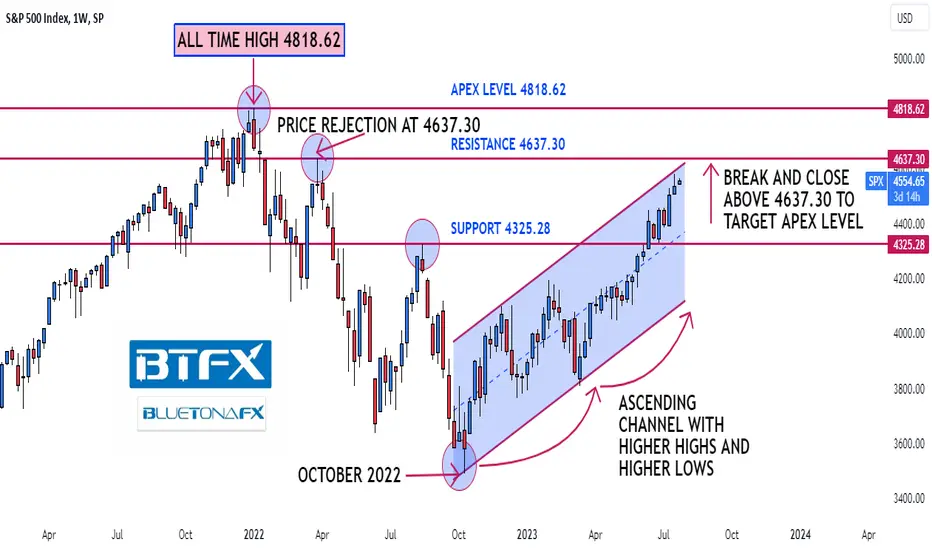
BluetonaFX - SPX Approaching All-Time HighHi Traders!
We are approaching the all-time high on the S&P 500, and traders are eagerly anticipating tomorrow's Federal Reserve interest rate decision along with the FOMC minutes meeting announcement.
Looking at the technical price action on the 1W chart, the market has been in a steady bull market since October 2022. We have drawn the ascending price channel on the chart for you to see.
Before the all-time high at 4818.62 (the apex level), there is a resistance level at 4637.30. This level is key because there was a price rejection at this level 16 months ago, and we have not been above it since then.
If we get a break and close above 4637.30, then the apex level at 4818.62 is the next target, and if that breaks, then we will be trading in record-breaking territory.
On the other side, if 4637.30 holds and there is not a break and close above this level, then the bull market we have had for the past 16 months may be coming to an end, and we may get a pullback to the long-term support level at 4325.28.
Please do not forget to like, comment, and follow, as your support greatly helps.
We appreciate your continued support!
BluetonaFX
AUDUSD will buyer momentum continue?Today's focus: AUDUSD
Pattern – HL
Possible targets – 68.11 – 68.85
Support – 67.17
Resistance – 67.75
Could we see further upside from the AUDUSD? Currently price is bouncing off short-term support. This could continue if some of this week's key news goes in favour of risk markets. The USD has had a solid run recently but could any hints at future rant holds set off a new pullback? If so this could be fuel for the AUD to continue its push.
Australian CPI is also due out on Thursday, its forecast to come in slightly lower Could a miss also help drive buying?
For now, we will continue to watch price as it holds off short-term support with a new HL and see if it can continue to push higher reclaiming some of last week's lost ground.
Have a great day and good trading.

🔥 Bitcoin Indecision Ahead Of FOMC MeetingComing Wednesday there's another FOMC meeting by the FED. Here they will announce what the new interest rates are going to be. While the FED paused last meeting, the expectation is that they will announce another rate hike.
My expectation is that BTC will continue to consolidate around the current area, while traders are patiently waiting for the FED's decision. Furthermore, BTC's volatility is extremely low, which indicates that it's preparing for a big move, either up or down. See below for the volatility analysis, currently 3 days in a row extreme low volatility:
As seen on the chart, BTC is trading at a very strong area of resistance. The top resistance is an exact copy of the bottom support, creating a parallel channel. With the stock market severely overbought, the market risk is likely to the downside.
As long as BTC stays above the yellow support line, the intermediate trend is bullish. A break below this trend line could signal that ~31.8k was the 2023 top.
Are you bullish or bearish ahead of the FOMC? Share your thoughts 🙏

Harmonically, US Interest Rates are Headed Toward 35%The US Interest Rate chart has been trading within a Descending Broadening Wedge and has recently broken out of the wedge. The target for a pattern like this is typically back to the inception of the pattern, which in this case would be 20%; but we also have an additional variable here, and that's the Potential Logscale Harmonic Formation we've made here. If we are to treat the action of this chart as we'd treat any other chart, then we'd expect that once B gets broken, we'd get an accelerated move all the way up to the Harmonic Completion of a Bearish Shark, which would land us at the 1.13/1.618 Harmonic Confluence Zone up at around 34-35%
There have been previous instances where Harmonics have had a predictive quality over data like this, such as the accelerated liquidity exit out of the reverse repo facility, the bond yield charts on multiple occasions, and the US Inflation Rate Charts. Which can all be seen in the related ideas tab if you are skeptical of my use of Harmonic Patterns in this context.

UJ Double bottom neckline 139.422 After breaking strong resistance at 139.422, market trying to accept UJ new support price at 139.422.
Next resistance level would be 140.906. Would UJ uptrend lasts before FOMC meeting next week at JULY 26?

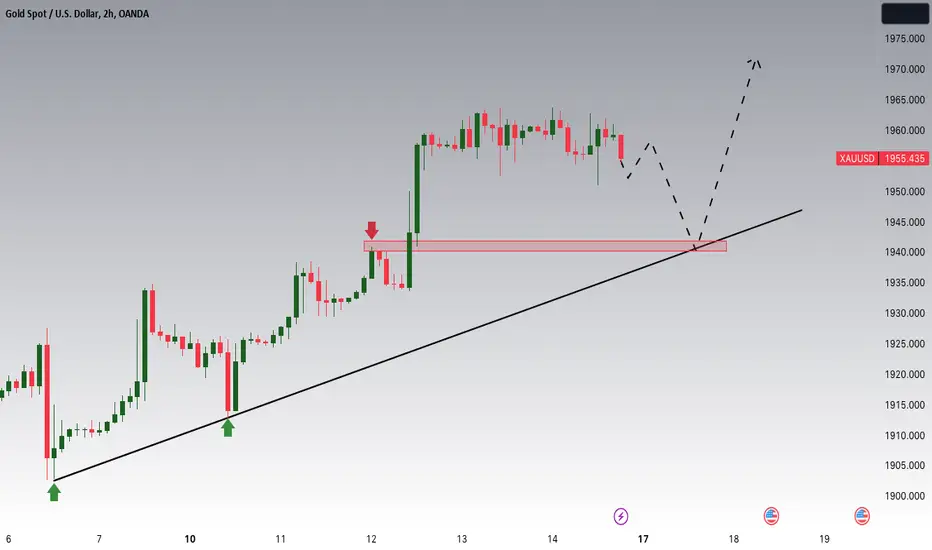
Gold Outlook: Vulnerable Dollar and Promising Upside PotentialHey Traders, In tomorrow's upcoming trading session, our keen focus will be on XAUUSD, the trading pair of gold against the US dollar. We are closely monitoring this market for a potential buying opportunity within the price range of approximately 1940. From a technical standpoint, XAUUSD is currently engaged in an upward trend and undergoing a consolidation phase, gradually approaching the key level of support and resistance at 1940.
Furthermore, it is important to consider the fundamental factors influencing this market. The latest Consumer Price Index (CPI) data indicated a softer performance, implying that future monetary policies are likely to adopt a more dovish stance. Additionally, the Producer Price Index (PPI) also displayed a similar softness. These factors combined have generated an increased appeal for gold and cryptocurrencies among investors.
Given this context, the convergence of favorable technical indicators and supportive fundamental factors enhances the attractiveness of gold and cryptocurrencies as investment options. Thus, we anticipate a heightened interest from investors in exploring opportunities within the XAUUSD market, particularly around the 1940 zone.
UJ in pre-FOMC meeting mode (26JUL).-Reached Daily chart MA200 support line
-Reached 2nd support level at 137.923
-2 more weeks to FOMC meeting
USD time to revenge against JPY?

DXY D1 - Long Signal (relief rally)The US Inflation data came in with another surprise lower, declining faster than expected. The Core CPI YoY slowed down to 4.8% in June, down from 5.3% in May. This is the lowest core inflation print since October 2021. This is also the biggest drop since January 2021. On the other hand, the US CPI YoY dropped to 3.0% down from 4% during the same period, posting the lowest reading since March 2021 and the biggest drop since May 2020. The data was enough to shift market expectations significantly. Prior to the data, markets were pricing in the possibility of 3 more rate hikes before the end of the year, now markets are pricing in only one more rate hike in July’s meeting.
The US dollar index declined sharply right after the inflation data announcement, breaking multiple key support areas, reaching as low as 100.40 by NYSE closing bell, which is the lowest daily close since April 2022. In addition, the index posted the biggest daily decline since November 2022. With this daily close, it’s safe to say that the downside trend has resumed. Since expectations shifted significantly, the index is now pricing in one more rate hike before the next easing cycle. The next support area stands at 100.0 psychological support, which should be watched carefully, as buyers are likely to appear.

ES1 AnalysisES1! 6WK: Update from April 14, 2023:
Long term target: 4634.50
Please refer to study posted on April 14, 2023 and updates as listed from June 16, 2023. Key level of 4500 breached, warranting new targets for continuation.
Bias: Neutral to risk on into EOY for Q3 and Q4
Price at time of publish: 4517.00

BTC update 7/7/23Important level here.
Local lows have been run through both the Asia and London session leading into the US session which has been lately running the cadence of the market.
Should we close and stay above the orange line ~$30,500 = bullish imo

GOLD Possible scenarios."Bullish Scenario" will be activated after breaking 1939.50. 1st tp is around 1948.
"Bearish Scenario" will be activated in case of price crossing the bullish-trend-line under.
In that case a reaction to the 1917.400 could provide a long opportunity there.
If Hawks seems to be more powerful in FOMC meeting, you should wait for the "2nd bearish scenario"

03/07/23 Weekly outlookLast weeks high: $31291.8
Last weeks low: $29420.6
Midpoint: $30356.2
The week starting on Monday 19th of June was the latest rally for bitcoin, a strong move up leaving some large FVG inefficiencies left behind that price will look to fill in the future. The upside capped off at just under 31.5k, a high that the bulls couldn't top last week while chopping sideways in a much tighter range than previous, and consolidating under the all important 32-32.5k region where a lot of traders will look to do business.
This week for me will go one of two ways in my opinion:
A slow and steady drop from current price down into those FVG areas, the main one being 27.2-27.75k.
OR
We wick up above recent highs, tag liquidity in the supply zone around 32.5k before a sharp sell off back into those FVG zones before anymore progress can be made above this range.
FOMC minutes event on Wednesday may provide the volatility required for this liquidity grabbing wick.

GBPUSD: 4HR Death Cross, LH and LL formation downtrendMaintaining my shorts on this pair with validation coming from the 50EMA (turquoise) crossing the 100EMA (white) which forms a death cross in the 4hr time frame.
GBPUSD has failed to make a new higher high and so I'm expecting a push down to the recent low, we may break this immediately, or retrace back to the descending trendline that's now formed. We're making lower highs and lower lows which indicates a down-trend.
Ultimately I'm expecting this pair to fall to below 1.22 in the coming weeks.
Big FOMC release tomorrow, if the notes support Powell's recent hawkish stance then this will be bad for cable, then there is NFP on Friday which is a bit unknown.
Fundamentally for GBP, recent data suggests inflation may be coming down, which suggests that the BoE may become less hawkish.
Powell suggested a couple more hikes, which could mean Fed interest rates remain higher for longer.
I'm also expecting a push up for DXY based on it's chart patterns.
I'm staying short.

NZDJPY BREAKER BLOCK ENTRY M15 On NZDJPY, we have a bearish setup following yesterday's rally. As the price rose, it created a breaker block around the 0.8913 area. This will be our entry point for a long position with a target at 0.8966. The breaker block was formed on the M15 timeframe when the price broke out of the previous supply zone. It would be fantastic if you could share your opinion and leave a like to support our work. Greetings and have a great day of trading from Nicola, CEO of Forex48 Trading Academy.

Euro trading quietly around 1.09, FOMC minutes nextEUR/USD is showing limited movement on Wednesday. In the European session, the euro is almost unchanged at 1.0882.
The eurozone services sector continues to show growth, but the June numbers showed a deceleration. Eurozone PMI slowed to 52.0, shy of the consensus of 52.4 and down from 55.1 in May. This marked a five-month low. Germany's services sector stalled, dropping from 53.9 to 50.6 and missing the consensus of 50.8 points. The 50.0 level separates contraction from expansion.
The eurozone economy has been recovering slowly, with services driving economic activity as manufacturing continues to decline. The ECB, which showed up late to the rate-hiking party but has been quite hawkish, will need to tread carefully in order to guide the economy to a soft landing. The central bank meets next on July 27th and is expected to raise rates. Inflation has been falling but core CPI remains persistently high.
The ECB has signalled more rate hikes are coming and Joachim Nagel, head of the German central bank, reiterated the ECB's stance, saying this week that inflation risks are tilted to the upside and the ECB's rate-hike cycle has "some way to go".
Wednesday's highlight is the FOMC minutes of the June meeting, when the Fed raised rates by 0.25%, bringing the benchmark cash rate to a range of 5.00%-5.25%. The markets are widely expecting the Fed to hike at the July meeting but aren't sure about another rate hike this year. Fed Chair Powell has signalled that the Fed plans two hikes in the second half of the year and the minutes could change the market's tune if the Fed's tone is hawkish.
EUR/USD is testing resistance at 1.0908. The next resistance line is 110.50
1.0838 and 1.0766 are providing support

USDCAD LONG SETUP BEFORE FOMC + OPECOn USDCAD, we have a bullish setup with the price retracing to the 1.3226 area, touching a minor demand within the main demand zone. I have used this level as a possible entry zone with a target at 1.33. With the upcoming OPEC and FOMC events, the dollar could potentially have a bullish push this morning, considering also the DXI, which appears to have a bullish trend. It would be fantastic if you could share your opinion and give a like to support our work. Greetings and have a good day of trading from Nicola, CEO of Forex48 Trading Academy.

Gold Break The 1900's?With golds fall over the recent days, its clear to see its in a bearish channel. Im looking to sell now and target 1900, 1885 in the mid term.
Price below 1910 will cause an impulse to 1900, Sell entered at 1912, let the melt begin...

Price Waiting for News Releases | Tech/Fundamental Analysis Traders, today we have those news releases for Wed, 28 Jun 2023..
Buyside liquidity then sellside liquidity..
Use these news as your trigger and most importantly, confirm your entry..
This view is linked to my previous view, please review it..
Price may reprice higher than H2 FVG and into my "sell area" marked in my previous idea..
Those are areas of "possible" reversal points, and entry should be confirmed in the proper time..
I'll keep you updated ✅

QQQ Outlook 0626-30/2023Technical Analysis: Last week’s price action put NASDAQ:QQQ back inside the bullish channel we’ve been watching since March. We should see come corrective price action this week before tech runs higher.
Bulls will look to see if we can stay above last week’s lows at 360. It is crucial bulls hold this level or we could see the daily fair value gap that could be filled below at 357.66.
Bears will want to see a breakdown under the daily fair value gap, where we could test the strong monthly level at 354.43. If we lose the levels above, we can look for a test of the lower trendline in the upcoming weeks, and possibly a large gap to fill to the downside from 336.67-332.91. Inside this gap is the 50SMA and the 61.8% retrace at 334.00.
Upside Targets: 364.57 → 370.10 → 373.83 → 380.76 → 386.28
Downside Targets: 360.00 → 358.97 → 357.66 → 354.43 → 352.46

SPY Outlook 06/26-30/2023Last week’s newsletter, we leaned bearish and the market made lower lows 4 out of the 4 trading sessions. With more fed speakers this week, PCE and Consumer Confidence data releases, and political turmoil in Russia, uncertainty can cause volatility in the market bringing down equities.
Technical Analysis:
AMEX:SPY is still due for a retest of the bull flag and daily channel breakout around 429.57. Should this area not hold, a .618 retrace would suggest we pullback to the gap below at 424-423. I do think we revisit that, and possibly test the daily fair value gap below 419.
Bulls will want price action to stay above the weekly 432.03 level. If this holds, we can target the gap above at 437.45-438.97.
Bears will want to try and and break below the red uptrend trendline. If we cannot hold 432.03, we can target the previous bull flag breakout at 429.61. If that doesn’t hold, we could target the 50% retracement where we bullflagged in the beginning of the month around 426.70. An even deeper target is the the daily gap below at 423.95-422.92. Should this gap fill, I would flip long.
Upside Targets: 436.00 → 437.45→ 438.97 → 441.21 → 443.90
Downside Targets: 432.03 → 429.61 → 428.78 → 426.70 → 425.14

DXY: Will the rising dynamic trendline hold?Tough times for the USD; the market didn't buy Powell's hawkish attempt, ECB went as expected and Dixie has plummeted today.
I do think the USD crosses will get a breather retracement tomorrow, so we could see a bounce off the rising trendline on HTF's. If we break the wedge to the upside then this could lead to a higher low and could signal a reversal with a higher high.
If the trendline is broken, and we then go on to make a new low then I think the USD will continue to struggle, what with the ECB and BOE continuing to hike, and showing some good data.
Watching and waiting...
