Sp500 QQQ|TSLA NVDA AAPL AMZN GOOGL MSFT Price level Trend Guide- PPI and FOMC meeting tomorrow
- SPY & QQQ hourly time tightening range, will break tomorrow
-TSLA still full bull control 4h 12 EMA
- NVDA falling wedge bull break
- AAPL likely testing ATH again, 2D ema 12 full bull control
- AMZN daily bull break lacking some follow through
- GOOGL weakest of the big techs still only retrace 50% of last weeks pull back
- MSFT likely re-test of 52 high double top
FOMC

GBPUSD Approaching the weekly trend ahead of CPI data.Dear Traders,
I'd like to bring your attention to the current market conditions of GBPUSD. It is currently experiencing a downtrend but is undergoing a correction phase. The price is approaching a significant resistance zone at 1.26100, which coincides with the major trend. This area is worth monitoring closely.
In addition, it's crucial to take into account the upcoming Consumer Price Index (CPI) release this week. This economic indicator is expected to have a substantial impact on the strength of the US dollar and may provide insights into the future actions of Fed Chair Powell. If the CPI figures are higher than anticipated, it suggests that the Fed may need to continue raising interest rates, which could strengthen the dollar further. On the other hand, if the CPI falls below expectations, it is more likely that the Fed will postpone any rate hikes in their next monetary policy decision.
Remember to prioritize risk management and trade with caution.
Best regards,
Joe

The Quiet before the Storm 🪁 : Eurusd With the close of the Daily candle in the next 1.5 Hours, Longs would prefer a candle closure above 1.0782. This would confirm another Higher High in market structure. In an uptrend price creates Higher Highs and Higher Lows. If this occurs then we can anticipate a bottom wick ( Higher Low) and then a consequential new bullish candle push to the upside back towards 1.0813 daily resistance zone. At this current time price is Bullish on the weekly timeframe and has broken the previously week's candles high. The Daily timeframe will print the second bullish candle of the week which was expected in my previous analysis. FOMC tomorrow will cause quite the stir. FOMC could cause Eurusd to easily dip back to retest 1.0746 Daily support level before continuing it's ascent or going into a volatile range. Price has reached my bullish target for the week which was 1.0813 ( a 65 pip increase ). CPI data has resulted in Higher High on the 1Hr timeframe. Price ended up pulling back and correcting the increase made during London session. We currently sit above our Daily S/R level 1.0782, late NY session Tuesday.
New Bullish target for this week with fomc : 1.087 Daily resistance zone
The way CPI data distributed at 1.0813 makes me think. We reached my weekly target 1.0813 before schedule. We had an initial increase in price and I'm sure some players bought the high and are now holding drawdown as we move into FOMC tomorrow. If I was a buyer I would consider getting out for B.E. because the Daily candle is closing in 1.5 hours with a significant top wick. Larger than the body of the bullish candle at least.
New Bearish target for this week with fomc : 1.06915

Charts Show Market Expects Fed to Pause but Big Resistance AheadTraders,
Over 90% of the market is currently pricing in a FED rate pause tomorrow, but beware, the market often moves towards the point of maximum pain. My charts are showing we are at a critical point of resistance as I type this post. The bulls are going to have to conquer 4,370 and confirm it on the daily to convince me that the they are not out of steam just yet. From my perspective and the way I am reading this chart, is that the market may be in for a bit of a surprise pullback here. The blow-off top that I predicted well over a year ago is still currently underway and, IMO, will continue. But the market never goes to any future price point in a straight line. We are due for a pullback. I am not saying this will occur. I am only suggesting that a bit of caution is still very much warranted for the remainder of this week.
Here's a look at a schedule of significant events that have or will yet occur and may cause volatility:
Tuesday:
• US CPI Data
• Hinman Docs Become Public
• SEC's Coinbase Rulemaking Response
• Binance US Hearing
Wednesday:
• US PPI Data
• FOMC Meeting
Thursday:
• US Jobless Claims
• US Retail Sales Data
Take care,
Stew

DXY: It won't happen, but if it does... 😱More than 97% of analysts say the FOMC won't raise interest rates tomorrow, but what will happen to Dollar Index, FX:EURUSD , TVC:GOLD and FRED:SP500 if Powell decides to hike interest rates by 25bp instead?
Most likely, tomorrow's announcement will be our driver at least for the whole summer, because this event will have a strong impact on the market. So we just have to wait 24 hours, and we will have the verdict!
...And you? what do you think?

JPY RAISING OR DOLLAR HAVENJPY is in a technical correction and is reaching local support at 139.9.
I think this FOMC meeting officials will skip the rate hike and project hawkish sentiment for the next meeting. Some other reasons for dollar strength have also subsided.
A lot of this trade is dependent on the idea, that US inflation is going to be flat or lower then expected. This will be revealed when CPI reports.
Nothing much has changed for the JPY, except for higher inflation than usual. BOJ probably will continue its fiscal policy as is.
What do you think? Let me know in the comments below.

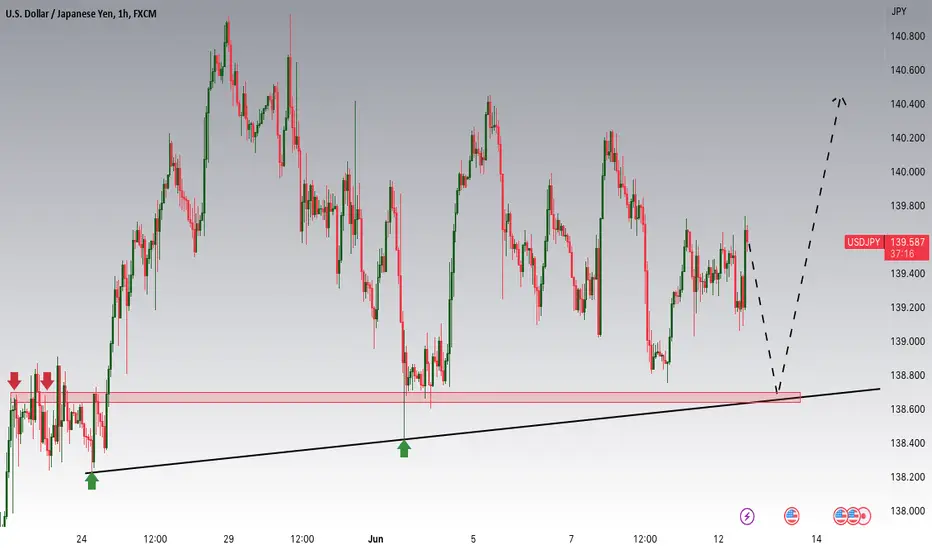
USDJPY: CPI and FOMC weekHey traders!
Today, our focus is on USDJPY, where we are observing a potential buying opportunity around the 138.700 zone. USDJPY is currently in an uptrend and appears to be approaching a significant support and resistance area at 138.700.
This week, we have two key events that could impact the market. First, on Wednesday, we have the Federal Open Market Committee (FOMC) meeting, where the Federal Reserve's monetary policy decisions will be announced. However, the day before the FOMC meeting, we have the release of the Consumer Price Index (CPI) data, which is important to gauge the Fed's next move and intentions.
If the CPI data shows high numbers, it may indicate the possibility of further rate hikes, signaling a bullish sentiment for the USD. However, if the CPI data comes in lower than expected, it could suggest that the Fed might delay rate hikes, potentially altering the previously anticipated long-term plan for the USD.
Therefore, keeping an eye on the CPI data before the FOMC meeting is crucial to understand the potential impact on USDJPY and adjust our trading strategy accordingly.
Trade safe, Joe.
XAUUSD - KOG REPORT!KOG Report:
In last week’s KOG Report, we said we would be expecting to adapt our plan over the week as we were expecting the range and choppy price action to continue. We suggested sticking with the same plan and levels from the week prior which worked very well to give us the trades within the range. The short-term swing we were expecting for the move to the downside came in the later part of the week after we managed to take the long trade back up into range high giving us a short opportunity we wanted. So, we wanted to short down, then long up before shorting down, instead, we got the long up, short down and long up. A decent week on the markets again but a very frustrating range to have to deal with.
So, what can we expect in the week ahead?
For this week we can expect some more choppy and whipsawing price action during the first half due to FOMC being on Wednesday. We’re expecting them to want to clear the voids and grab liquidity from the highs and the lows, so for that reason we’re going to start by suggesting we continue to scalp the range for the first initial sessions while we assess the price action. We’re then going to be looking for the two key levels to hold price, either from above to go short, or, from below to go long.
Key levels are the order region 50-55 with the break below taking us into 30-35 previous order region which are levels we would expect to see a reaction in price. Resistance levels now stand at 80-85 key level and above the institutional level 90-95 which price needs to remain below for this to continue with another decline.
So, in summary, we have a potential range now forming between 40-45 support and the resistance levels of 80-85 with extension into 90-95 for the spike. Scalps in-between with KOG’s bias of the day and the levels with the view to take the longer position from the levels illustrated on the chart.
Its going to be another difficult and frustrating week to navigate so please exercise patience in your trading, wait for the price to come to your levels, don’t force the trades just to be in the market. Always remember, cash is also a position in the market. We’re going to take it easy until FOMC, smaller lots and smaller captures before we hunt for the trade of the week.
Please do support us by hitting the like button, leaving a comment, and giving us a follow. We’ve been doing this for a long time now providing traders with in-depth free analysis on Gold, so your likes and comments are very much appreciated.
As always, trade safe.
KOG

EURUSD Technical Analysis: Preparing for CPI and FOMC Impact.Hello Traders, In tomorrow's trading session, our focus will be on the EURUSD pair as we seek a selling opportunity around the 1.08 zone. Previously, EURUSD was experiencing an uptrend and successfully broke out of it. However, it is currently undergoing a correction phase and approaching the retrace area at the 1.08 resistance zone. It is important to also keep an eye on the CPI data scheduled for release next week, specifically on Tuesday. This data will serve as confirmation for the trade. If the CPI comes in above expectations, it suggests that the Federal Reserve still needs to work on increasing interest rates in their upcoming monetary policy by Wednesday, which could trigger further strength in the US dollar. On the other hand, if the CPI numbers are within expectations, this may lead to USD weakness as Federal Reserve Chair Powell may lean towards postponing a rate hike. Let's monitor the situation closely and trade wisely.
Trade safe, Joe.

SPY OUTLOOK 06/05 - 06/09Last week, the debt ceiling lift was signed into law which saved the US from defaulting. All of our upside targets hit last week, and the market reacted favorably with a green week up +3.2%. With not much on the economic calendar, I doubt we move much this week, but expectations of a soft landing can keep bulls in control.
Technical Analysis:
This week AMEX:SPY broke out to the upside of the megaphone we were watching since April. We are at a critical point in the market as we tested the top of a macro trendline dating back from September 2022.
Although I can see the market moving higher in the short term, I’d expect some corrective action in the coming weeks. Even if we head higher, we will need to build some levels of support and resistance if we do head higher.
Bulls will want to hold price above the megaphone breakout. If price can continue above last week’s high 428.74, our next level above is 429.57, with not much resistance until 433. What is more likely this week is some sort of healthy pullback before we head higher. I can see SPY coming down to test the daily gap made on Friday (422.92-423.95). If this doesn’t hold, we have a golden pocket from 420-421 where we can look for buyers to step in.
Bears will want to invalidate the golden pocket and control price action under last week’s point of control at 419.
Upside Targets: 428.74 → 429.57→ 433.07 → 436.10 → 438.08 Extended: 441.21
Downside Targets: 425.14 → 423.95 → 422.92 → 421.02 → 419.00 Extended: 416.22

SILVER - Where to next? BIRD EYE VIEW!SILVER - Where to next?
An important few weeks ahead: FOMC minutes Wednesday, PMI's and on Nov 30th - Fed Chair Jay Powell is set to speak on the economic outlook and the U.S. labor market at Brookings.
With all of this we are at key support areas of DXY - I see a lot of individuals very bullish precious metals, I am too. Although, keep in mind trade what you see, not what you think.
Where will silver lead next? We are within the ranges of Lows: 18.100-18.500 & Highs: 22.
A break to either direction...

$QQQ Outlook 05/30 - 06/02The tech sector is on a tear. NASDAQ:NVDA earnings set the tone last week and the AI craze is on. NASDAQ:QQQ had a bullish week, closing up +3.53%, bringing it up +8.76% on the month. Strong earnings, job cuts, and developments in AI technology has sent the sector higher.
Technical Analysis: The last two weeks saw NASDAQ:QQQ break out of the rising wedge we were watching. Last week’s high signaled a test of a bullish channel. This channel uses the same uptrend support line we’ve been watching since the beginning of March. We are looking to see if this continues higher, or if the channel resistance is respected.
My general lean for this week is bullish, although after last week’s incredible run, I do expect a bit of a retrace before we head higher. A healthy pullback is due so we can continue to move up this channel. I would be bullish if price action can continue to hold above last week’s close of 348.40.
Bear case if we can break below last week’s open at 336.25. I’d expect a bounce here as it is in the golden pocket (0.618 retrace would be 337.08), but if we cannot hold this level, we could target the gap to fill below down to 332.91 which would invalidate the golden pocket.
Upside Targets: 348.40 → 349.25 → 350.72 → 352.46 → 354.43 Extended: 356.78
Downside Targets: 346.38 → 344.57 → 341.31 → 338.19 → 336.25 Extended: 334.35

$SPY Outlook 05/30 - 06/02With a tentative agreement to raise the debt ceiling reached over the weekend, we now look to see how the markets react when it is voted on later this week.
Technical Analysis: The megaphone pattern we’ve been watching all month is still in play. We also have the macro uptrend line that we have not tested since March.
My general lean for this week is bullish. Bulls will want AMEX:SPY to hold above last week’s open at 418.64. Barring any additional news, I’m expecting us to fill the gap above to 420.77 - 421.22 when markets open on Tuesday. I do see a 15 minute Fair Value Gap around last week’s open at 418.64 where we could potentially form a support base before we head higher into the 423-425 range.
Although I can see the market moving higher in the short term, I’d expect some corrective action in the coming weeks.
Bear case if we fail to hold the 418.64 level, we could potentially retrace to the 0.618 fib at 414.04. Should we invalidate a golden pocket bounce, our next support zone would be the daily gap under the 50 SMA from 409.87- 407.27.
Under this… megaphone plays out and we test the macro support trendline.
Upside Targets: 420.77 → 421.22 → 421.97 → 422.82 → 423.54 Extended: 425.26
Downside Targets: 418.64 → 417.30 → 416.25 → 414.94 → 414.15 Extended: 408.87

Does "News" Impact Price Behavior? 🐒We can Observe that After the 1st Quarter of the Year, January-March the price of Eurusd has increased. Now As we near the middle of the second quarter, I can't help but visualize a Breakout.
Price is currently sitting at 1.102. So far price has respected the Weekly Level at 1.106. The High for the first quarter was 1.103. We have now spent quite a bit of time at these extreme prices. I can often observe price using News//Data Releases on Lower time frames as a boost. A Boost of momentum in the preceding direction.
I can observe 3 Potential News//Data Releases causing and becoming a Catalyst to leave a Large Trading Range.
1. NFP
2. CPI
3. FOMC Interest Rates.
Will FOMC provide the Volume?
Do we have enough Liquidity?
Or may price dip from here back to our 1.086 Weekly S/R Zone before increasing any further?
My Bias is Bullish moving into FOMC. Safe Trading Everyone.
Not Financial Advice. Educational Purposes Only.

NQ - W Set upNQ - W Set up
Double bottom set up, as long as it stays above 11400/500 areas as support. We are at current resistance that has been tested multiple times break above 12 1/2 I expect 13 1/2 and perhaps 14200/300 areas.
We did have FOMC and nothing new has been changed imo rate hikes continue..
Key tip: Higher time frame, less emotional attachment
Enjoy,
Trade Journal

Upcoming FOMC meeting as catalyst!BTC needs some catalyst to take a move, as usual FOMC will shake up the markets. J.Pow sent some signals in his latest speech, DXY is hovering right below resistance. Overall slightly bullish to neutral, looks like BTC will range between 25k <-> 27k for a while.

XAUUSD Weekly Forecast | 29th May 2023Fundamental Backdrop
The key takeaways of last week's FOMC meeting show that the FEDs agreed on the need for more rate hikes after May's meeting was 'less certain'. We will likely be seeing strength in the USD.
We could see investors shift their money from GOLD to USD instead, weakening it.
Technical Confluences
Near-term resistance level at 1948
Next support at 1904
Idea
Price could head towards the next major key support level at 1904.
NOT FINANCIAL ADVICE DISCLAIMER
The trading related ideas posted by OlympusLabs are for educational and informational purposes only and should not be considered as financial advice. Trading in financial markets involves a high degree of risk, and individuals should carefully consider their investment objectives, financial situation, and risk tolerance before making any trading decisions based on our ideas.
We are not a licensed financial advisor or professional, and the information we are providing is based on our personal experience and research. We make no guarantees or promises regarding the accuracy, completeness, or reliability of the information provided, and users should do their own research and analysis before making any trades.
Users should be aware that trading involves significant risk, and there is no guarantee of profit. Any trading strategy may result in losses, and individuals should be prepared to accept those risks.
OlympusLabs and its affiliates are not responsible for any losses or damages that may result from the use of our trading related ideas or the information provided on our platform. Users should seek the advice of a licensed financial advisor or professional if they have any doubts or concerns about their investment strategies.

Downside moment has come for US indexes?Hello Traders,
In our previous posts,linked in the description, we've been tracking the last zig-zag of this primary wave (B) as it ascends. Our calculated completion targets fall within the yellow area, coinciding with the bullish descending broadening wedge targets, as well as the point where Y equals Z. This symmetry between the two most recent zig-zags in this corrective wave has informed our decision to set our longs at 13800 and initiate short positions at 13863, anticipating the advent of wave (C) and a potential move towards lower lows.
But the price action and chart patterns integral to our proposed count are just pieces of the larger picture. Several other indicators also support the potential scenario we've described.
Interestingly, over recent months, we've observed an unusual market behavior. The market has been ascending, despite a dominant narrative of impending recession and rate hikes—factors that typically instill bearish sentiment in retail traders. This resilience of the market is even more noteworthy when we consider its divergence from the Money Supply M2. Historically, the stock market has acted as an oscillator of the Money Supply M2.
It's crucial that we view this resilience of the market as a potential strategy to mislead retail traders. When the narrative was bearish, the market not only held its ground but thrived, possibly catching many retail traders off-guard.
Adding another layer to our analysis, let's consider the US 10-Year Treasury yield (US10Y). It's currently forming a bullish flag pattern, a positive signal that could potentially lead to higher yields. If this pattern confirms, it would be consistent with lower lows on indexes
In our upcoming posts, we'll explore these dynamics and their potential impact on market trends in the short to medium term. We'll also discuss what they mean for our trading positions. We keep in mind that FOMC today can be a good trigger for accelleration to the downside, but another wave up towards 14200 is still a concrete possibility.
Stay tuned for more updates, and trade safely in this volatile environment.
Bests
GMR

Decoding the Structure of the Federal Reserve System 🏦
If you've ever wondered how the U.S. monetary system functions and who runs the show, keep reading. In this article, we will break down the structure of the Federal Reserve System and help you understand how it operates.
🏦 The Federal Reserve System, often referred to as the Fed, is the central banking system of the United States. It was created in 1913 by the Federal Reserve Act and is an independent entity within the government. The Fed has a three-part structure, including the Board of Governors, the Federal Reserve Banks, and the Federal Open Market Committee (FOMC).
1️⃣ Board of Governors:
The Board of Governors is the governing body of the Federal Reserve System. It consists of seven members appointed by the President and confirmed by the Senate for 14-year non-renewable terms. One person is designated by the President as Chair and another as Vice-Chair. The Board's main function is to set monetary policy, supervise and regulate banking institutions, and maintain the stability of the financial system.
2️⃣Federal Reserve Banks:
There are 12 Federal Reserve Banks located throughout the United States. Each Federal Reserve Bank serves a specific geographic district and is responsible for carrying out the policies set forth by the Board of Governors. The Federal Reserve Banks are overseen by a board of nine directors, six of whom are appointed by banks in the district, and three by the Board of Governors.
In addition to overseeing the banking system, the Federal Reserve Banks also provide services to financial institutions and the U.S. Treasury. These services include processing and clearing checks, storing currency, and distributing new currency.
3️⃣Federal Open Market Committee:
The FOMC is the most powerful body within the Federal Reserve System. It is responsible for setting monetary policy, specifically the target for the federal funds rate, which is the interest rate that banks charge each other for overnight loans. The FOMC is made up of the seven members of the Board of Governors and five of the 12 Federal Reserve Bank presidents.
The FOMC meets eight times a year to analyze economic data and determine appropriate policy decisions. Their decisions impact not only the banking system but also the overall economy. For example, if the FOMC decides to raise interest rates, it will become more expensive to borrow money, affecting everything from mortgages to credit card payments.
Conclusion:
The Federal Reserve System is a complex organization that plays a critical role in the U.S. economy. Its structure is designed to ensure checks and balances across its three branches so that no one entity has too much power. While the Board of Governors sets policy and oversees the entire system, the Federal Reserve Banks carry out those policies and provide essential services to the financial system. The FOMC, on the other hand, is responsible for setting monetary policy, affecting the interest rates that impact our daily lives.
Understanding the Federal Reserve System is essential for anyone wanting to understand the U.S. economy. Knowing how the Fed operates can help individuals and businesses make informed decisions about their finances. With this knowledge, you can better navigate the ups and downs of the economy and protect your hard-earned money.
❤️Please, support my work with like, thank you!❤️

GBPUSD mark this level.. Gbpusd will make some reaction on this keylevel.. still neutal till price make some move to that level

XAUUSD Weekly Forecast | 22nd May 2023Fundamental Backdrop
The USD is expected to pause interest rates, causing investors to shift their money to Gold.
Technical Confluences
Resistance at 2001
Current support at 1981
Major support at 1960
Idea
We could possibly see price retrace back up to retest the resistance at 2001.
NOT FINANCIAL ADVICE DISCLAIMER
The trading related ideas posted by OlympusLabs are for educational and informational purposes only and should not be considered as financial advice. Trading in financial markets involves a high degree of risk, and individuals should carefully consider their investment objectives, financial situation, and risk tolerance before making any trading decisions based on our ideas.
We are not a licensed financial advisor or professional, and the information we are providing is based on our personal experience and research. We make no guarantees or promises regarding the accuracy, completeness, or reliability of the information provided, and users should do their own research and analysis before making any trades.
Users should be aware that trading involves significant risk, and there is no guarantee of profit. Any trading strategy may result in losses, and individuals should be prepared to accept those risks.
OlympusLabs and its affiliates are not responsible for any losses or damages that may result from the use of our trading related ideas or the information provided on our platform. Users should seek the advice of a licensed financial advisor or professional if they have any doubts or concerns about their investment strategies.

DXY Weekly Forecast | 22nd May 2023Fundamental Backdrop
The Flash Manufacturing PMI is expected to decrease from 50.2 to 50.0 which shows contraction in economic health.
The Flash Services PMI is also expected to drop from 53.6 to 52.6.
The FOMC Meeting Minutes on Thursday. The FED will talk about future interest rates which was previously indicated to be on pause.
Technical Confluences
Near-term resistance at 103.500
Next resistance at 105.000
Minor support at 102.765
Major support at 102.200
Idea
With the Flash Manufacturing PMI and Flash Services PMI expected to drop, it could cause the DXY to drop further towards the 102.700 minor support.
If the FED chooses to pause or indicate pausing of interest rates, it can cause the DXY to drop even further towards the 102.200 major support level.
NOT FINANCIAL ADVICE DISCLAIMER
The trading related ideas posted by OlympusLabs are for educational and informational purposes only and should not be considered as financial advice. Trading in financial markets involves a high degree of risk, and individuals should carefully consider their investment objectives, financial situation, and risk tolerance before making any trading decisions based on our ideas.
We are not a licensed financial advisor or professional, and the information we are providing is based on our personal experience and research. We make no guarantees or promises regarding the accuracy, completeness, or reliability of the information provided, and users should do their own research and analysis before making any trades.
Users should be aware that trading involves significant risk, and there is no guarantee of profit. Any trading strategy may result in losses, and individuals should be prepared to accept those risks.
OlympusLabs and its affiliates are not responsible for any losses or damages that may result from the use of our trading related ideas or the information provided on our platform. Users should seek the advice of a licensed financial advisor or professional if they have any doubts or concerns about their investment strategies.

EURUSD - Gamble paid offOANDA:EURUSD
Took my 2nd trade on the EU short based on DXY heading higher.
A real huge gamble before JP speaks, rollercoaster range.
But finally got filled at 10 pips
Now i wipe the sweat off my forehead.....
