DXY Outlook 24th March 2023The US FOMC decision to hike rates by 25bps, taking the US interest rates to 5% saw the DXY spike downward from the 103 price area down to the 102 round number support level.
This was partly due to the decision being priced in and also the likelihood that markets were considering the possibility of a slowdown of rate hikes from the FOMC due to the banking crisis.
However, the DXY failed to break below the 102 level and has since bounced to retest 102.65 which aligns with the 61.8% Fibonacci retracement level.
With the current price action, if the price remains below 102.70, it is likely that the DXY could continue with the downward trend, trading lower to retest the immediate support and round number level of 102.
FOMC

KEY TOP WATCH $QQQ Equilibrium Pattern Tomorrow - QQQ equilibrium pattern is going to be key break for which direction market is going the next couple days,
- XLF KRE bear break to new lows will break QQQ equilibrium bear and then drag SPY down even more.
- Yellen flip flop - no deposit guarantee yesterday to today it will be. (the more they flip flop back and forth the more we see them as less confident)
- SOXX / SMH semi sector also helping QQQ with such a strong move up, QQQ bear break will likely mark a temporary top on this sector. need to see NVDA drop too.

📉Gold prediction during FOMC meeting📈FOREXCOM:XAUUSD
OANDA:XAUUSD
Gold analytical series, Episode 06
Hello Traders, First take a look at my previous episodes.
2 scenarios for xauusd
Fomc meeting --> 5.25%
Fomc meeting --> 5.5%
Don't forget to risk-free your positions.
Please share ideas and leave a comment,
Let me know what's your idea.
CrazyS✌

🔥 Bitcoin On Fire After FOMC: Bottom Is In!Recently I've been talking a lot about Bitcoin and my expectation it's following some kind of Elliot Wave pattern since January. In my most recent analysis I said that I expected the 4th wave to bottom between $26,5k - $25k. BTC bottomed around $26,6k, close enough!
In my eyes, the bottom is in and we're likely going to continue our way up. Remember that the day after the FOMC meeting is generally the day of the "real" reaction to the meeting, as opposed to the immediate reaction after the new interest rates get announced.
In the short-term, I'm looking at $28,5k and $29k as my targets. In the longer-term, there's an argument to be made that we can reach well over $35k, as per my Elliot Wave analysis above.

GOLD SHORT TO 1912📉Is it possible we could see a 3 sub-wave correction towards the $1900 zone again? As long as price remains below this order block & rejects the $2,000 barrier, I believe we can see another move down, which will form an A,B,C correction. Buying momentum also seems to be drying up as FOMC yesterday couldn't provide enough volume to buyers.

S&P 500Hello & welcome to this analysis
S&P on the eve of FOMC meet is at the slanting trendline with a diagonal ripe for a pullback/reversal
4017 needs to be breached on the upside
3950 if broken then more downside coming

🔥 LTC Extremely Strong After FOMCWith nearly all cryptos losing significant value during the yesterday's FOMC meeting, Litecoin didn't want any of it.
After a minor drop, LTC has seen a 15%+ move over the last half day or so.
With Bitcoin and stocks regaining a large part of yesterday's losses, I'm seeing more bullish price action for LTC in the near future.
Blue lines as my near term targets.

DXY Post FOMC Potential Forecast | 24th March 2023Fundamental Backdrop
1. Plenty of instability in the market due to the SVB crisis and other banks being heavily affected by it.
2. The Fed hiked rates by 25 bps
3. The Fed also cautioned about the recent banking crisis and indicated that hikes are nearing an end.
4. The Fed's move may indicate that the economy could be stronger and that the currency could weaken soon.
Technical Confluences
1. Price is currently in a bearish trend.
2. Well below the Ichimoku cloud, signifying bearish intent.
3. Next support at 101.800
Idea
Looking for the price to head towards the support at 101.800
NOT FINANCIAL ADVICE DISCLAIMER
The trading related ideas posted by OlympusLabs are for educational and informational purposes only and should not be considered as financial advice. Trading in financial markets involves a high degree of risk, and individuals should carefully consider their investment objectives, financial situation, and risk tolerance before making any trading decisions based on our ideas.
We are not a licensed financial advisor or professional, and the information we are providing is based on our personal experience and research. We make no guarantees or promises regarding the accuracy, completeness, or reliability of the information provided, and users should do their own research and analysis before making any trades.
Users should be aware that trading involves significant risk, and there is no guarantee of profit. Any trading strategy may result in losses, and individuals should be prepared to accept those risks.
OlympusLabs and its affiliates are not responsible for any losses or damages that may result from the use of our trading related ideas or the information provided on our platform. Users should seek the advice of a licensed financial advisor or professional if they have any doubts or concerns about their investment strategies.

3/23 Watchlist + NotesSPY - wicked day with FOMC. I was slightly bullish for the 3rd day in a row going into today. We saw some upside before the news was released. SPY ended up tanking with the news results and closed as a super bearish engulfing day. Because of this wild movement, we had 0 inside days show up on the scanner, so for tomorrow I will mainly just be watching SPY, GME, and my scanner intraday for some hourly/15 min setups.
My prediction for SPY tomorrow:
SPY is incredibly bearish for tomorrow. I am expecting us to test the 390 level and eventually break lower at some point during tomorrow's session
Best play from my previous watchlist:
MRNA - we had a 3-1 daily and I was hoping for some upside on this one, but we got downside instead. Not surprising given that we had tested a FVG 2 days ago and rejected it, and also just the fact that the markets tanked so much in the afternoon. MRNA still played out beautifully though if you entered when we broke yesterday's low. Cons ran roughly 30% from entry to where my personal TP would have realistically been just looking back at the candles and today's movement. Ended up running 57% at peak from entry, which actually happened to be where the cons closed at for the day.
Additional notes:
I find that days following FOMC tend to have decent price action, and I tend to be green most days following FOMC news. With this in mind, I am looking forward to trading tomorrow. As always, best of luck

FOMC news release, preparing for short positions BTC ended up printing a swing pattern failure. So I am now preparing for shorts positions and this chart shows when I am anticipating to find my best entries on those. This chart also shows that I am not looking to take any long positions unless we see a strong move higher form the buyers.
So I am preparing for short positions now but waiting for the right signal from BTC. And when it’s time to enter, we need to have positions ready. This may happy overnight or when I’m not able to post so wanted to share some setups that I am watching. The idea here is NOT to enter all of them, but to choose the ones that look the best when BTC is in it’s rejection area or sell pressure is showing up. The best way to manage these is to set alerts on each one on TradingView so you are alerted when each is near our target zone.
I won’t be providing much detail on each of these setups as they are all very similar. Really just wanting to see price action come back and bearishly retest the recent resistance.

FOMC Price Reaction Analysis, Support & Resistance, $SPY/$QQQ- Looking for a hourly Bear flag on SPY and QQQ after this huge move down.
- XLF and KRE top watch to see if we break fear lows/52 week low. Fear would likely come back in if we do break the lows
- looking for SOXX/SMH to go from lead bull turning into lead bear
- Rate hikes is a head wind more for QQQ then SPY, so after Powell saying no rate cuts this year, we would likely see QQQ lead to the down side as well just like it lead to the upside.
- FOMC reaction day after is always the real move, so tomorrow we need to see if bears can follow through or todays just a small reaction move.

Key Levels and US Market Review for the Asian session open 23/03US Share markets indexes move lower after the US Fed raised interest rates by 0.25% as expected. There are a number of concerns that the market sees and is reacting to as risk assets take a hit. The US Fed showed concern for the banking crisis and expect credit conditions to tighten which does not bode well for growth in an interest rate raising environment. I expect that we will see more risk off trading in the coming days and will see Europe play catchup with a move lower on open in the coming session. UK CPI showed inflation is moving up which I expect will cap any rally into the FTSE100 (UK100 Index).
Asian markets will open weaker to follow on from the US session.
A review of the price action from the European session and the US session where I look at some key levels to watch and the price action setups I expect to see play out on the major markets below.
Markets covered :-
DOW
Nasdaq
DAX
FTSE
ASX200
Hang Seng
USD Index
Gold
Oil
Copper

USD/JPY - Nice Dump Chair JPOANDA:USDJPY
I sat out today for good reason, not going to go up against JP
But if you did, nice trigger to the short side.
After the initial flush, look how price respected and ranged in between Previous Days Low and Previous Weeks Low.
Trade smart

🔥 Bitcoin Short-Term Bullish Triangle Before FOMC MeetingBTC has been trading inside a bullish triangle pattern over the last couple of days. With the FOMC meeting around the corner, I'm expecting some volatile price action today and tomorrow.
In my view, it's likely that we're going to hit $28,600 today. Whether it's a fake pump before the FOMC meeting (and a dump after), or we get a bullish reaction and move up significantly.
The $28,400 area is proving to be a strong resistance at this point. Wait for a clear break out, ideally with high volume.

EUR/USD - Dollar DXY Get's it RightOANDA:EURUSD
The dollar index DXY gets it right on the heels of Fed Chair JP
DXY continues the bearish sentiment while the EU pairs screams higher.
If you wanted to gamble today, perfect long entry trigger, to enjoy the ride.
Trade well
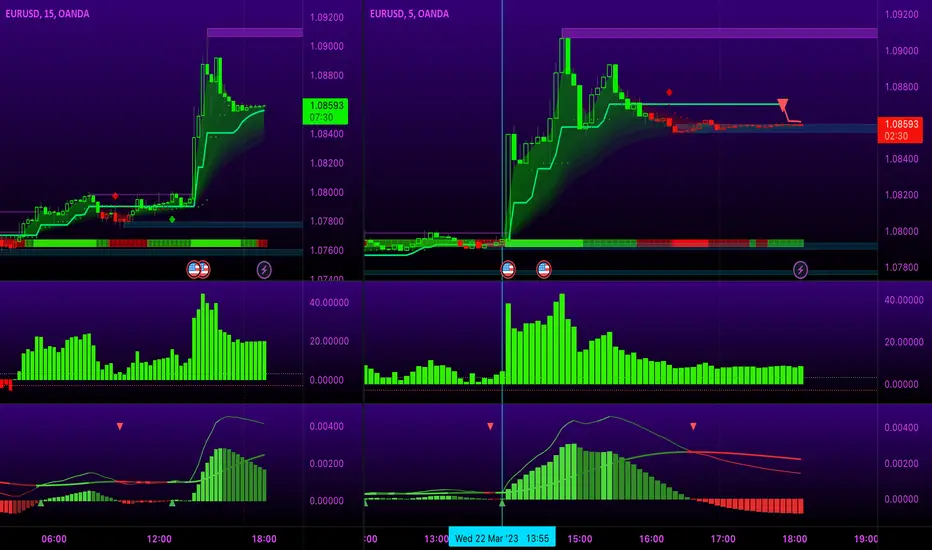
EURUSD FOMCThis is my FOMC prediction for EURUSD. I will take the buyside liquidity first and than go lower for the sellside liquidity.

DXY Potential Forecast| Pre FOMC | 23rd March 2023Fundamental Backdrop
1. Plenty of instability in the market due to the SVB crisis and other banks being heavily affected by it.
2. The Fed is incentivised to either pause rates or maintain at 25bps due to the current instability in the market.
Technical Confluences
1. Price is currently in a bearish trend.
2. Price is near the H4 support area at 102.65.
3. Well below the ichimoku cloud, signifying bearish intent.
Idea
Looking for price to form a new lower low at 100.821.
NOT FINANCIAL ADVICE DISCLAIMER
The trading related ideas posted by OlympusLabs are for educational and informational purposes only and should not be considered as financial advice. Trading in financial markets involves a high degree of risk, and individuals should carefully consider their investment objectives, financial situation, and risk tolerance before making any trading decisions based on our ideas.
We are not a licensed financial advisor or professional, and the information we are providing is based on our personal experience and research. We make no guarantees or promises regarding the accuracy, completeness, or reliability of the information provided, and users should do their own research and analysis before making any trades.
Users should be aware that trading involves significant risk, and there is no guarantee of profit. Any trading strategy may result in losses, and individuals should be prepared to accept those risks.
OlympusLabs and its affiliates are not responsible for any losses or damages that may result from the use of our trading related ideas or the information provided on our platform. Users should seek the advice of a licensed financial advisor or professional if they have any doubts or concerns about their investment strategies.

BTC - Why 30,000 Is A Strong Rejection ⁉️Hello TradingView Family / Fellow Traders. This is Richard, also known as theSignalyst.
As per my last analysis, we know that BTC broke above the big inverse head and shoulders neckline.
📈 Thus, the momentum has been shifted from bearish to bullish.
BTC is currently bullish trading inside the red rising broadening wedge pattern.
📌 Here is why the 30,000 is a strong rejection:
1- Round number => 30,000
2- Classic Support Zone Turned Resistance from Weekly timeframe
3- Supply zone marked on the chart
4- Intersecting with the upper red trendline acting as a non-horizontal resistance
📉 Hence, as BTC approaches the 30k - 32k zone, we will be expecting the bears to take over for a medium-term correction.
📌 For the bulls to take over from a MACRO perspective , we need a weekly candle close above 32,000
📚 Always follow your trading plan regarding entry, risk management, and trade management.
Good luck!
All Strategies Are Good; If Managed Properly!
~Rich

BTC Before FOMC 03/23Bitcoin Analysis: 4H Chart
According to recent events on a macroeconomic perspective and TA on the weekly chart I conclude on the path Bitcoin could take.
- Major bearish divergence building (Higher highs price action, lower highs in the RSI)
- BTC about to face strong resistance (confluence area)
- Major possibility of rejection
Bitcoin is approaching what many in the field are calling the possibility of having another Bull run. However I remain bearish (but who knows I can be wrong). DXY is showing a clear H&S pattern so this can invalidate my theory. I wanted to share this before the FOMC decision is taken, I expect a big ugly set of candles during the time of the press conference and right after the decision is determined.
This is what I see, hence I wanted to share.
Happy Wednesday and trade safe.

STX DOUBLE PLAY - Preparing for anythingcurrent entry is at 1.0977
took profit already so now letting the rest ride. if it breaks and retests then ill add more.
if it breaks, false brekout, ill open up a small margin short and then see what happens
playing both sides
what is your plan?

Market Bias & Top Stock Watches - 3/22/2023 - ChoppYBias: Quiet, choppy morning. FOMC released @2 ET so will most likely be narrow ranged until then
Top Watches: Long - ETNB, OLLI, CVNA. Short - WOOF, LAZR, NKE.
Tune in to my stream at 9:25 EST for my full list of top stock watches and to watch me trade them Live!
Follow @JLaing for a timely morning bias of the market like this, top stock watches, and live day trading every morning!

US30 Bull to Bear Trade on FOMC dayEIGHTCAP:US30
With today's highly volatile FOMC meeting around the corner, I'm expecting price to reach the 33000 level and take out all liquidity in this area before making an extremely sharp and aggressive downturn to new swing lows.
Stay safe out there,
The Meditrader

Currency State of Play before FOMCHi Traders, this is my take on the Major indexes before the Feds rate news this evening.
Trade safe and stay blessed.
Enjoy
