Can Dow Jones Rise Above Falling Trend Line?It's FOMC day! The markets have already priced in the 25bps rate hike so Powell's speech will be the most important thing today. A dovish Fed can help Dow Jones break the falling trend line and finally see acceptance above the resistance level of 34000. While I'm expecting a dovish speech from Powell today, the inflation fears are slowly fading away and recession fears are taking over, so in this environment, it's best to trade with minimized risk on stocks.
FOMC

GOLD XAUUSD - LONG (BULLISH) TARGET 1960GOLD SPOT - XAUUSD: Bearish Trendline Breakout confirmed.
Bull Flag Pattern occurs on the 1-H timeframe, Breakout indicates a bull run towards $1960.

USDJPY H4 - Short Signal USDJPY H4 - Depending on the way the FED sways later on this evening, will no doubt impact this pair, whilst the dollar has whipsawed somewhat, the YEN is holding it's own against the dollar, a typical scenario where we are seeing a firefight between two relatively bullish pairs for the moment, ideally we want to sell something knowingly weak against something knowingly strong. However, it's worth keeping an eye on this pair from this key trading zone around the time of the FOMC

DXY H4 - Long SignalDXY H4 - Breakout seen last night, which saw us follow gold from $1900 to $1920/30 respectively. Exhaustion seen and that's where we posted the short signal from. $1930, hopefully down towards $1900 support and possibly beyond, depending on the outcome and projections from the FED later on this evening. Not entirely sure how much the USD will want to move ahead of this economic event, as you all know by now, we often see stagnated markets before big news releases.

uvxy short volume uptickweve slightly gained in vix, and the ftz from top of short leads out to where uvxy should make its low sub $4...
if we examine the capitalcom vs finra we see that contango in vix is still coagulating around a major demand zone low into its decay. i still think split will be bullish for vix, but perhaps we clear the pop in fomc, and the loose steam is actually bullish in the long run i would still expect vix to lose weekly, as well as lose by the end of ftz.

USDJPY TO 139"Based on a thorough technical analysis, I have identified an ascending triangle pattern on the 4-hour chart of the US Dollar Index (DXY) and a bearish flag formation on the daily chart. Additionally, a doji pattern has been observed on the monthly chart, indicating potential market indecision. On Wednesday, it is expected that the DXY will experience a rise due to the Federal Open Market Committee (FOMC) meeting. Furthermore, Governor Kuroda's recent statement refusing to tighten monetary policy is likely to result in a weaker Japanese Yen, thereby contributing to the expected rise in the DXY. I wish all traders a profitable and successful trading week ahead."

Market Bias & Top Stock Watches - 1/31/2023Bias: Choppy Neutral
Top Watches: Tune in to my Live Stream @9:50 EST for my full list of top stock watches
Follow @JLaing for a timely morning bias of the market, top stock watches, and live day trading every morning!

BTC updateMy BIAS also has changed on BTC. Bitcoin is weak, parallel with DXY who is broken out, heading towards supply zone. Reverse my setups after new target is hit.
Looking for a "clean" short setup...
The FOMC meeting will disrupt the market again. Will increase my positions after volatility clears up.
Be alert!

DXY update...BIAS changed. The market is weak and DXY is broken out, heading towards supply zone. Reversed my setups...
The FOMC meeting will disrupt the market again. Will increase positions after volatility clears up.
Stay safe...
US30 SHORT BIAS (UPDATED)!Hello all!
Quick recap on US30 from my recent analysis videos..
I did explain previously why i am bearish on Dow, beside US30 being in high curve on HTF. The pair moved the way projected in my recent analysis, mitigating the refined weekly Supply you see in the photo, and selling to the Demand zone where the usual price cycle appeared..
Now i will be waiting for Dow to touch 34170 zone and monitor LTF. If the pair mitigates during FED speech i will sell aggressively. If not i will wait for confirmation.
This sell will be a swing down to 30k.
Take care, trade safe!

ARHS - Arhaus, Inc.Very nice reaction off of the 9ema this morning. Largest 30-min volume since the gap up on raised revenue guidance.
Started a small position; couldn't justify a full position with the overall market being slightly extended on a short-term basis and showing negative action on the day.
Will look to add over the debut price high of $14 only if the broad market continues its bullish phase. The all-time-high of 14.95 looms overhead, but with the volume & growth on this name, I'd expect it to clear that level as long as the market environment remains favorable.
The FOMC decision and statement on Wednesday will have a major impact on the market environment. Even if I am shaken out of this starter position, I'm keeping this one on my focus list for as long as the environment remains healthy. This has the potential to be a true market leader.

SPY weekly Review 01/30/2023 - All timeframes, & AM routineIn this Video I do a quick analysis of the current condition of markets based on the SP500 proxy index the SPY. I also go through a few weekly data points as I am hoping to publish this every Monday to summarize the week head, and behind. This video is a bit long as I go through all my tools and routines, plus we have a very hectic week this week with FOMC, Earnings, Jobs, PMI, and much more. Inflation data on the horizon also (PCE Index which the FOMC cares most about, not PCI).

Intraday Analysis - ( 31 Jan 2023 )Intraday Analysis - ( 31 Jan 2023 )
GOLD has been ranging due to lack of fundamental catalyst and anticipating FOMC and other Fundamental data release this week.
HRHR buys at 1923 key level
MRMR buys at 1935 key level
Safest buys at 1939.5 key level
However i will only look for sells below the daily zone whereby a new low will be created and there will be a potential shift in structure only below 1912.

$CL_F: Oil futures longLow risk trade here, check out how the hourly, daily and weekly time-frames interact, giving a lot of upside room with very limited downside risk here.
Best of luck!
Cheers,
Ivan Labrie.

XAUUSD RECAP AND ANALYSIS A few key fundamental data
across the board next week to kick start Feburary
1) FOMC
- 25 bps
All risk assets moon , DXY continues its
bearish momentum
- 50bps ( very likely )
- Talks about extended rate hikes to continue its fight for inflation,
DXY to gain short term strength and risk assets to continue its decline
- 75bps
Definite crash
2) ADP / JOLTS / USD

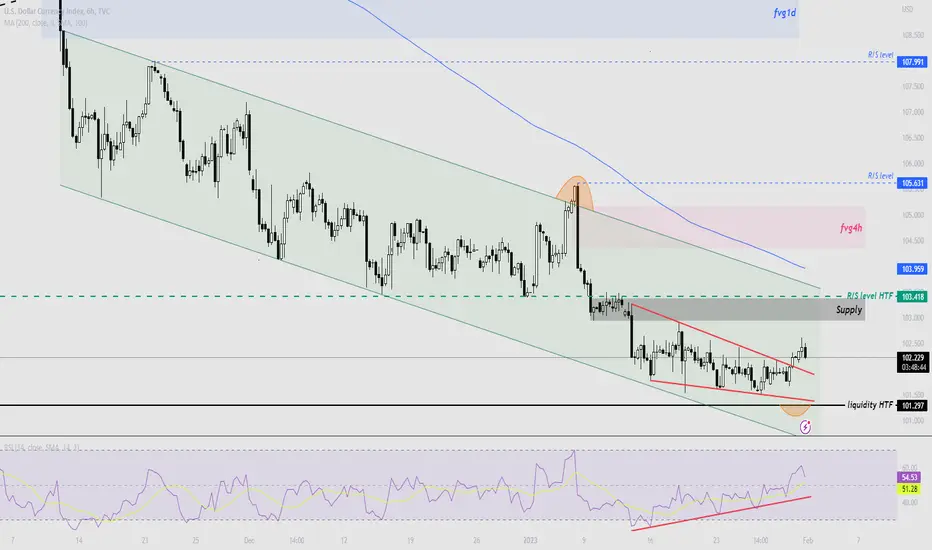
DXY update; Approuching upcoming FOMC meetingAs we approach the upcoming FOMC meeting, where we can expect smaller rate hikes as inflation begins to slow, the gap in the liquidity zone could be filled right after.
Enjoy the bullish trend atm. But remember, there comes a time of manipulation...
Be alert

BTC: $25K BEFORE FOMC AND THEN NUKE!!Hello everyone, if you like the idea, do not forget to support it with a like and follow.
Welcome to this quick BTC update.
BTC is going well and is currently trading above the $23.5k level. Let's discuss the next possible scenario from here.
BTC breaks above the crucial resistance of $23.3k after two days and as of now holds above it very well. As long as BTC holds above this $23k-$23.3k level we have a high chance that we see another leg up.
We have another important FED meeting (FOMC) on Wednesday so I'm expecting a last push up to the $25k level before FOMC and after that, we might see a huge correction.
Overall this week will be very crucial for us so trade very carefully. Do not get REKT by doing Fomo or some silly mistakes. Remember market always gives opportunities no matter what.
Invalidation of $25k is if we break below $22.5
What do you think about this?
Share your thoughts in the comment section.
If you like this idea then do support it with like and follow.
Thank You!

The (Jan) FOMC meeting playbook – assessing the risk to the USDTime – The FOMC statement comes out on 2 Feb at 06:00 AEDT/ 1 Feb 19:30 GMT. Chair Powell’s press conference comes out at 06:30 AEDT / 19:30 GMT
Trading considerations:
Positioning – Investment banks who manage flow across spot FX, swaps, and FX forwards report that clients are net short USDs, notably by real money and leveraged, although the position is not at extremes. In the weekly TFF (Traders for Financial Futures) futures report we see that leveraged funds (hedge funds etc) have flipped to a long USD position, notably vs the AUD, EUR, and CAD. Real money accounts (asset managers, pension funds) are also net long USDs, but that position is mostly held vs the EUR.
The notional position in futures is far smaller than those held in spot or forwards market, but the data is more transparent and easier to source. So as we head into the FOMC meeting, there are risks of a USD short squeeze, notably vs the JPY.
If I look at 1-week implied volatility across the USD pairs the expected moves (higher or lower) over the week are hardly explosive and many sits around the 30th percentile of the 12-month range – this suggests the market is not expecting any major surprises and refrain from paying up for options volatility – I see this as an important consideration in our risk management, as it is often prudent to reduce exposures over an event where the market is expecting significant movement and the range of outcomes are varied.
What to watch for?
I expect a hawkish statement from the Fed this week, but so do most market participants and it is a strong consensus view.
On the point of rate hikes, a 25bp hike is fully discounted, and while a 50bp hike can’t be ruled out, it would be a huge surprise. We look out the interest rate curve and after this week’s hike, see two more 25bp hikes pencilled in by mid-2023 - traders will need to marry the tone of the statement and Powell’s press conference with this pricing structure. In the less likely outcome that the Fed give the impression that they could pause after this week’s hike, then the USD could easily sell off and risky assets rally.
I suspect Powell will want to be non-committal either way and allow the Fed maximum optionality to react to unfolding economic data.
One big consideration is that financial conditions (as measured by moves in equity, bonds, credit, USD, and the VIX index) have loosened to a point where Chair Powell may detail the extent of easing is “unwarranted” – this pushback could be a key focal point, especially given we’ve seen a rise in commodity prices that is starting to lift inflation expectations.
Would the market buy this pushback?
I’m not sure the market de-risks too intently should we hear a push-back on easier financial conditions, as the market is seeing a Fed that is largely in control – at least at this stage. Wages are growing at a slower clip, while core PCE inflation is running at a 2.9% 3-month annualised pace - the slowest since Jan 2021. We see growth is still positive but below trend, and that should mitigate the need to really hit demand by taking the fed funds rate to say 6%.
Somewhat more concerning is that soft data is thematic of recessionary readings, leading indicators are negative, and the consumer is pulling back on spending – it’s no surprise then that then the market anticipates a near-term pause in the hiking cycle. Then there’s the lag effect, where some 425bp of hikes still need to fully feed through to the economy.
In a world of nuance, the Fed could portray that we’re closer to an end in the cycle – here, we could see a tweak to the line in the FOMC statement, where “the Committee anticipates that ongoing increases in the target range will be appropriate” – where the word ‘ongoing’ is either removed or altered to “further increases”.
Where do the risks sit?
There doesn’t seem much reasoning for the Fed to alter its course here and should continue to highlight a commitment to reducing inflation. At this juncture, it seems unlikely the Fed would want to appear dovish, so with the risk are for a hawkish Fed – albeit this is expected - and in a market where leverage funds are short USD (in the spot market), the risks are small skewed to USD upside, which by extension this means a lower NAS100 and XAU price.
Whether that plays out is another thing and perhaps the best way to trade this tactically is to stand aside and let the market react accordingly, with a view to selling rallies in the USD for a resumption of the bearish trend.

USDJPY Continues to FallLast week, USDJPY failed to grow above the Ichimoku cloud as it worked as a resistance. Naturally with the FOMC meeting this week, volatile movements can be expected and prices may grow but this instrument is looking weak in the weekly timeframe so rising prices can be seen as entry points for shorts.

BCH long riding this through the bull market After the FOMC meeting we should get a clearer direction. I will be watching this pair for the duration so stick around!!!

BTC Futures Rising Wedge Forming, confluence with newsI frequently chart the BTC CME Futures chart alongside a normal BTC Exchange chart. The difference between them is that CME is closed for the weekend and operated by a regulated group. This means the CME chart can frequently show different trends/patterns as it removed a lot of the noise, unnecessary wicks, etc that can come from exchanges trading over the weekend.
I'm watching the early stages of this rising wedge forming. It's a bit early to call it a confirmed pattern still but worth putting on the radar. I often like to find confluence in charts aligning with news; I don't trade news but news is often a perfect catalyst for patterns to breakout. So what I have shown in the chart is a pattern that comes to an apex in about a week's time. And we have February right around the corner with a lot of news coming out, specifically the FOMC meeting minutes releasing on February 1st. This would be the perfect catalyst to create some volatility, quickly eliminate overleveraged longs and shorts, and then push for a pattern break of the rising wedge.
Marking this idea as short as I am bearish overall and ready for a market reset, but note that this chart displays an idea where BTC gets one more push higher at the beginning of this week.
Happy to answer any questions people have on this idea!

AUDUSDAUDUSD - Interesting look
It is very interesting range forming, we got pattern, we are at key resistance on higher time frame, within in a channel + TL but it's a waiting game on this and I think many take time it may break next week FOMC, I think that's when all FX majors will break out to either direction further. You can't predict what the FOMC are going to state, you can look at CME FedWatch Tool, which is useful but Powells commentary you can't predict that unfortunately...
So what's the plan In-between now and then I trade within the ranges that would be lower time frames until this breaks either direction and then you got think to yourself 1. Is this a false break out either direction? 2. What made it break out was it more DXY move etc There are many other factors to take into consideration. That's where your OWN plan comes into execution. It's really important to not follow these marketing signal providers, trading gurus that try sell you expensive courses, they not worth it and various fancy indicators etc. There are many out there, but that's not what's going to make you successful in trading that's the reality but a trading plan of your own, that's when you're set for life!
If it breaks below technically the 200 EMA is your target area and break above that psych level .7200 areas is target areas.
A great trader once told me, "Don't make your PnL on a Friday".
Have a great weekend,
Trade Journal

S&P 500 Looking For ConfirmationOn Monday, S&P 500 broke above the falling trendline and is currently looking for confirmation. On the weekly timeframe, we can see it nearing the Kaufmann Moving Average and the Ichimoku Cloud. Acceptance above this falling trendline on the daily chart and rising above the resistance level of 4014 can result in a move toward the next resistance level of the 4160 zone. If the index falls from here, the support level near the 3900 zone can be seen as an entry point for longs. Finally, with the FOMC meeting closing in, no major move should be expected this week and fluctuations can happen.
