TLT ShortTLT is approaching a technical double top area as the Feb. 1st FOMC meeting looms. Fed futures are currently pricing in a 475-500 bps terminal rate, however some fed speakers over the days have indicated a desire to exceed 500 bps this year. Market thus far hasn't bought that narrative and expects the Fed will be forced to pivot later this year due to recessionary headwinds. This pivot hopium has resulted in a rally in TLT. However, if the Fed raises rates to 50bps in February with 2 more rate hikes to go after that, Fed futures should spike above 5%. This will bring TLT crashing down to the 90-100 level. Even if the Fed only raises 25bps with 2 more rate hikes to go, a hawkish stance consistent with their recent comments about continuing rate increases should eat away at the Fed pivot hopium rally and still result in a drop of TLT to the 100 level. EIther way I don't see TLT continuing past 110 in the near term and this opens up a good short oppotunity.
FOMC

EUR/USD -19/01/2023-• Daily EURO/DOLLAR chart, zooming out back to 2021, where the 1.5 year downtrend started
• Short term, trend is bullish, higher highs higher lows
• Rising wedge forming, a bearish reversal pattern
• Resistance levels becoming support levels, a clear sign of an uptrend
• However, looking at the big picture changes the outlook a little bit
• Drew Fibonacci retracement levels 50% and 61.8% of the long term downtrend
• 50% level is around 1.09 and 61.8% is around 1.1225
• Bulls are now fighting to break the 50% level, without success till now
• Last area of defense for the bears is the 61.8% critical correction level
• If 1.1225 level stays intact, the pair will resume the long term downtrend
• Only if bulls manage to break the above level, we can safely say that the long term trend reversed and we are in a bullish market

MMM A good opportunity to long position and get a good profit from the attractive American stock market
Stay with me to get more analysis after following me by sharing with friends and leaving a comment.
According to my risk and capital management system, the risk of each trade is one percent per position.
What do you think about this analysis and other analyses?
What symbol would you like me to analyze for you?

GBPUSD SHORT Resault: 365 pips✅GBPUSD is preparing for a very good sell position and I am entering within the specified range
Stay with me to get more analysis after following me by sharing with friends and leaving a comment.
According to my risk and capital management system, the risk of each trade is one percent per position.
What do you think about this analysis and other analyses?
What symbol would you like me to analyze for you?

gbpusd, shortGBPUSD is preparing for a very good sell position and I am entering within the specified range
Stay with me to get more analysis after following me by sharing with friends and leaving a comment.
According to my risk and capital management system, the risk of each trade is one percent per position.
What do you think about this analysis and other analyses?
What symbol would you like me to analyze for you?

Are the 2 and 10 year bond markets calling JPOW's bluff?In this video I cover the divergence between the 2 and 10 year treasuries and the recent FOMC press conference language. Jerome Powell is promising one thing (continued rate increases), while the bond market seems to be claiming otherwise (Fed pause incoming). Who's right? Let's take a closer look.

gold biastaking off partials ahead of news impact driver FOMC and scaling stop lose and managing my risk.

Recession on the Horizon - FOMC and LayoffsYesterday, the FOMC confirmed the backing of higher interest rates for longer. The market reacted negatively signaling negative sentiment on rate expectations for the following quarters. Federal Reserve official, Neel Kashkari, who often has the most dovish views on market anticipation stated that inflation may have peaked but sees interest rates rising higher for the next few meetings. He sees the FED raising rates by a whole percentage point from the current level of 4.25%-4.5% to 5.4% (MarketWatch, Jan. 5). The inflation fight is not over yet, and it remains sticky despite all the economic weakening observed.
In a previous thesis where I challenged the US economy about a year ago, I warn of massive layoffs in 2023 despite most analysts and the Fed saying otherwise. Meta and Tesla have already laid off thousands of employees just months ago. Today, large layoffs in tech are happening with Salesforce: “layoff about 10% of its employees, the company also says it will close some offices as part of its recruiting plan, but it is still unclear if any of the bay area offices will be impacted, undertaking major cost cuts in a challenging economy.” (CNBC, Jan. 5). Amazon Chief Executive Andy informed his employees that the number of layoffs in the company has now been increased to more than 18000 roles (ArabianBusiness, Jan. 5). Other firms are cost cutting, most cutting employee benefits. It is just a matter of when or not we are going to see higher unemployment rates in 2023. The most obvious fundamental reason for these layoffs and cost cuts is the fact that all these companies responded to the “bubble” fueled by stimulus and extensive quantitative easing. As a response, the Fed is raising interest higher, and tightening the monetary policy and we see the equity evaluation of these companies dropping significantly. Eventually, that demand is gone, and these companies are left with thousands of employees hired in response to a "fake" demand, over-hired. As equity evaluation is going down, they have to improve the margins by laying off employees and reducing expenses since revenue is going down.
I see another reason for large layoffs, perhaps, a more IMPORTANT and IMMEDIATE aspect. Salesforce admitted business activities going down, demand slowing, and growth staggering, however, their stock went higher because they laid off employees, reducing their expenses. On paper, it shows higher margins, and thus, the stock reacted positively. What can become a norm during this economic environment is that we see more companies, especially in the tech industry which saw major lows, employing this technic by raising their stock prices with restructuring and engaging in mass layoffs.
My plan of limiting my exposure to risks has not changed. I am holding a majority in cash and short-term government bonds.
Looking to increase exposure to my trading in gold when the US 10-Year Real Rates falls from the inverse correlation between the two. Reminder: Higher real yields = expensive to hold gold when compared to other yielding investments such as fixed income, thus the inverse correlation on the charts.
This is for personal recording but feel free to comment and argue.

Will the dollar continue to plummet in 2023? Plus, a look at...Traders,
Happy New Year! It's been a terrible year for crypto, the markets, and the global macroeconomic environment. But the good news is that I believe we have left most of the negative declines behind us ...at least for a bit.
So, in this video, I'm going to look at what I see in 2023 for the U.S. dollar, the housing market, Bitcoin dominance, the stock markets (DJI, SPY, Nasdaq), and more.
Stew

Bitcoin~$15k or even lower soon!Hello Traders,
Happy New Year, I hope we can see some positive movements in 2023, but the market disagrees.
As you know already, FOMC minutes was just released today, and the result wasn't good, and Bitcoin rejected right at the resistance again. I expect to see new lows in the upcoming days/weeks. The fed still insists on the rate hikes policy in 2023, and we won't see cut rates this year.
Please hit the boost button if you agree.
Thanks, and don't forget to follow me for more updates.
Trade safe.

GOLD BUYS TILL 1860Hello guys ,i bring you good news here is an opportunity to buy gold at it been breaking new highs earlier today price went straight to hit a new high through till newyork session today there was a new higher low formed so we looking to cruise with gold to a new high aroul 1662 area, like and follow me for daily free signals and and live streams

DXY Outlook 4th Jan 2023What a start to the year!
The DXY woke from its Christmas/New Year slumber with significant volatility.
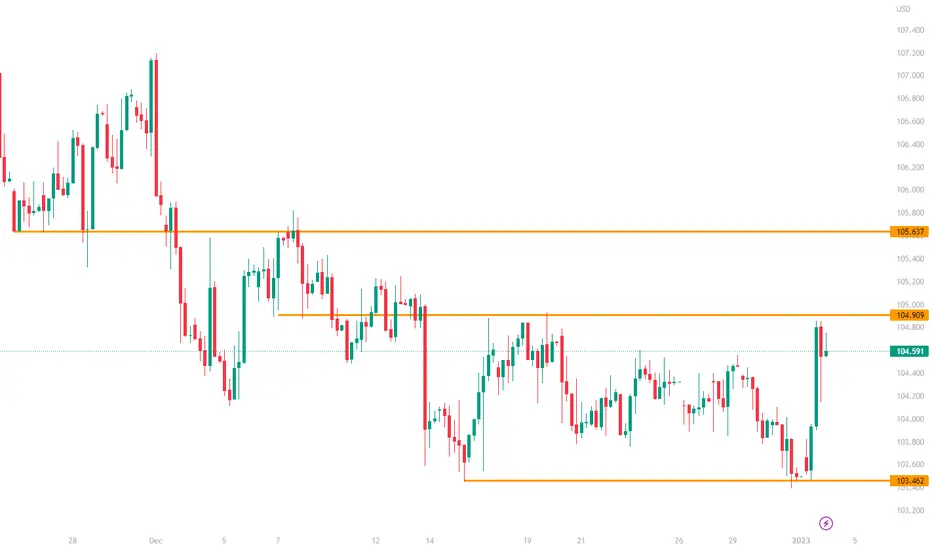
With the price finding strong support at the 103.50 price area (failing to break lower) the DXY rebound strongly to the upside, to test the 105 price area.
This strong climb was despite there being no major news event today. Hence could only be attributed to the "reopening" of markets and price action of the other major currencies as they broke out of the respective consolidations.
The focus is now on the Fed Minutes (due on Thursday). Will the Feds slow down, as expected by the majority of the market? Or will the Feds continue along the current path?
The DXY could continue to trade between the range of 103.50 and 105 in the lead-up to the release of the meeting minutes. However, if the price breaks above the 105 price level, the next immediate key resistance level is at 105.60.
No doom, gloom or pivot. Just one aliens TA.An alien trader landed on earth and was given a chart of the combined** US indices (futures). Luckily, and not coincidentally, he knew TA.
He had never heard of people like J.Powell and J.Cramer, or places like China, Ukraine and Russia.
this is what he saw:
Bullish:
- Broke out 'above' the main diagonal trend (bullish)
- Made a Higher High (bullish)
- Note that, on a VERY high TF, the Bull market rides on and up (see "Higher Range Frame" box)
Neutral
- Has arrived at the key POC (neutral) and is sandwiched between zones of lower past volume (LVN's)
- The 100MA/400MA was moving towards a "neutral cross" (the midpoint between the MA's is flat and not changing)
Bearish
In higher time/range frames the index has not made a new swing high. (see "Higher Range Frame" box)
NOTES
**There are multiple ways to merge ES, NQ and YM, as well as alternative indices like $NYA and Wilshire 5000. The *best* option depends on what it is used for (ex. a sphere is a good model of the earth for the astronomer, but not for the mountain climber). A simple average (ES + NQ + YM)/3 is ruled out because one point has a different value for each index. To address this, each index is weighted so that a 1 point change will imply the same change in $ terms (For weights see www.barchart.com
Alternative criterion for weighting include capitalization, number of stocks and beta weighting.
[i Epilogue - After watching a TA channel on You Tube for 5 min. he departed abruptly pausing only to grab a clean towel. He is believed to be following in the dolphins footsteps.

EURGBP: I will look for Buys if a Reversal set-up comes.EURGBP Tech. Analysis: Elliott Wave & Harmonics.
* Harmonics Pattern: Bullish Cypher
* Elliott Wave Pattern: Running/Expanded Flat in (B) (red)
* Supply Zone
* Fibonacci Extension & Fibonacci Retracement: Confluence
EURGBP Long: My Trade on the FED Press Conference (FOMC/FRED)
* Entry @ 0.85100
* SL @ 0.81500
* TP @ 0.91985
This is a trial trade for a potential swing and add longs thing.
Many pips ahead,
Richard, the Wave Jedi.

Weekly / Intraday Analysis - (19 - 23 Dec 2022)At FOMC monetary policy last Thursday, Santa Powell threw a flash grenade at the market leaving everyone stunned and paralyzed.
Fundamental wise, although the FED's minor shift in monetary policy reducing rate hikes to 50 BPS from 75 BPS, it is still considerably a stronger rate hike as compared to 25 BPS in terms of rate hikes as a whole. Accompanied with Santa Powell's firm speech on fighting inflation and reducing rate hikes to 2% which is floating at 4.5% as we speak, the FED still have a long and tough road ahead.
KIV: Russia's rumor on selling OIL against GOLD WILL result in a rally on gold and demise of the dollar. If this news is to be proven true, GOLD may break ATH and double in value to USD 3600/ ounce even.
On the technical standpoint, after every major rally/ dive in markets, we will have a pull back on gold and the dollar, as per seen gold has broken its bullish market structure from 1616 KL. Its highs printing at 1824 KL and LL at 1777 KL. What we want to be looking at will be gold forming LH and LL instead of breaking previous highs to signify a reversal towards 1616 KL taking price level by level.
Will be giving a few scalps and intraday plays:
Scalp
Buys:
- 1795 - 1808 KL
- 1815 - 1824 KL
Sells:
- 1775 - 1768 KL
Intra-day
Sells:
HRHR : 1822 KL
MRMR: 1811 KL
Safer: 1765 KL
Buys:
HRHR: 1795 KL
MRMR: 1815 KL
Safer: 1825 KL
Range plays:
HRHR sells: 1804 KL
MRMR sells: 1795 KL

Using FOMC as trade confluence!TECHNICAL REASON:
Price was within the zone of interest and the 4H candle has no lower wick which means everyone is priced one way; could see some profit taking ahead of FOMC
FUNDAMENTAL REASON:
It is worth noting that to the Fed, to gage inflation and how sticky it is or isn't, they are looking at jobs (more than CPI, PPI etc). Since the job market isn't cracking, it's a little premature to think that tomorrow they're going to come in as dovish as the market is expecting. Powell doesn't even have to necessarily come in Hawkish tomorrow for these moves to reverse. As long as he is less dovish than the average joe on Wall Street is expecting, USD is likely to have a strong reversal upward.
Short idea proved to be valid on the back of inflation print, which I believe is not that relevant. The Fed is focused on Jobs more than CPI, PPI etc. If price stabilizes today (likely will), expecting the market to offer 1825 again as a wick hunt and then for XAU to roll over.
HOW TO TRADE FOMC
I've taken partial profits in anticipation of getting "wicked out" and if this occurs, I will re-enter short around 1825
CROSS ASSET:
Everyone seems to be booking profits right now (see chart). The question is whether they will add once they're doing taking profits, open shorts or wait for tomorrow to make up their mind. The next 2.5 hrs are very important.
1. USD is stabilizing within lower boundary of wedge pattern
2. Bond yields haven't broken the low and are holding
3. NASDAQ (most forward looking index) is pulling back from the highs

SPX - Will we close above or below this trendline today?SPX - Will we close above or below this trendline today?
Lets go through yesterday CPI came out lower so US equities headed higher, DXY headed lower but now look where we are.
Today we have FOMC - In my opinion we can't even close above it do we today we took back all move of CPI if we close below it I think we back within these ranges and perhaps bears gain further control.
Will Powell be dovish or Hawkish - The way I see it we get coin flip - Santa or the grinch.
Trade Journal

XAUUSD Short this coming weekHi traders,
We had an awesome week with the volatily FOMC created on the markets, #XAUUSD/#Gold Closed below our daily trendline on thursday and failed to beat it on the retest on Friday. We now anticipate gold to plummet for the next few weeks to retest the neckline of the tripple bottom that was created a few months ago. We will wait for a confirmation then before we go long.
For now we're selling.
Discalimer
NASDAQ Guru offers general trading signals that does not take into consideration your own trading experiences, personal objectives and goals, financial means, or risk tolerance.

Hard to be bullish... SP500 🥶📉Taking a look at the Daily chart for the SP500.
We can see a near perfect downward channel filled with dumps and scam pumps.
Last week we saw a big rejection off of the 4100 resistance that we pumped up to back in September (yellow line).
Then the subsequent FOMC rate hikes and CPI numbers pushed us lower.
We'd expect to see a bit of a relief rally back up to the top of the channel, but at this point the move down looks basically locked in.
A bottom of around 3200 would put us right in line with the 2020 crash levels.
This remains our "bottom", at least in for now barring any crazy black swan event. Which is quite likely with the current geopolitical climate.
We'll see how the rest of 2022 plays out.
Eyes peeled.
-TucciNomics
Chief Overlord, AlgoBuddy

FOMC Rates Decision and the Effect on Gold**Repost from Dec 13th 2022 since the original post disappeared**
Economic indicators from the past month indicate that the price of services is the key factor that helps prevent a rapid decline in inflation , although the price of goods had already dropped considerably and the labor market remained strong, showing no signs of slowing down the inflation rate.
ECONOMICS:USCPMI
In the graph above, one of the key economic indicators, the ISM Service Sector Index for the month of November, accelerated to 56.5, above the forecasted rate of 53.5 and the previous month's level of 54.4. Despite the rise in interest rates from the FED, the ISM indicated that the services sector is still going strong, correlating with the positive outcome in labor market data.
FOMC Rates Decision 15 December 2022
Previous = 3.75-4.00% - Prediction from Bloomberg, OE, Forex Factory, Trading Economics = 4.25-4.50%
Bloomberg, Oxford Economics, the Forex Factory, and Trading Economics predict that the Federal Reserve's interest rate will rise by 0.50%. The market forecast for the highest interest rate as of December 9, 2022 is 4.75-5.00% in May 2023, with a gradual decrease beginning in the third quarter of 2023.
However, because the services sector has been performing well, the FED's interest rate cut may come later than expected by the market. Thus, from a fundamental standpoint, the USD is expected to continue appreciating, albeit not as strongly as in recent months. On the other hand, the gold price is expected to fall.

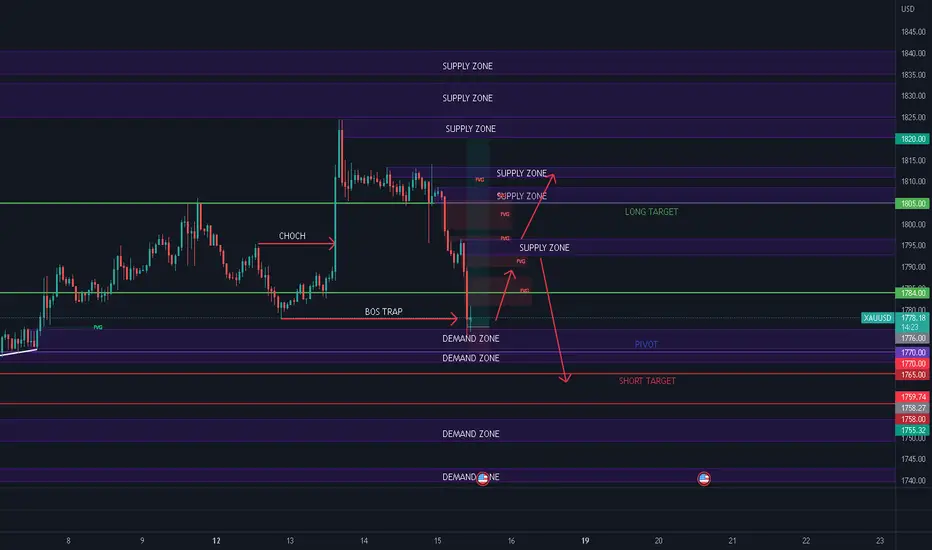
XAUUSD INTRADAY ANALYSIS 15.12XAUUSD ANALYSIS PREFERENCE LONG
Long Target 1784/1805
Pivot 1770
Short Target 1765/1758
DXY, SHORT Resault: 420 pips✅Based on the structure of the chart, the US dollar index is pulling back towards the middle line of the ascending channel and will move towards the bottom of the channel after the pullback.
According to my risk and capital management system, the risk of each trade is one percent per position.
What do you think about this analysis and other analyses?
What symbol would you like me to analyze for you?

USDJPY - Finally its on the WayHello Dear fellows , i hope you are doing great . i will look into it closely in todays session to add more position as this pair was my Week's setup you can see in my previous published idea for Week's setup. yesterday Closing was great for usdjpy as it gave more confidence to stick with Buy.
I will keep updating here for Trade updates like volume adding , Stop , Trade in or not Etc.
