BTCUSDT Analysis – Pivot 103k/106k, strategy and key zones__________________________________________________________________________________
Technical Overview – Summary Points
__________________________________________________________________________________
Momentum : Bullish structure on 1D/12H (MTFTI “Up”), but short-term consolidation (1H-2H “Down”). Momentum exhaustion observed.
Key Supports/Resistances : Resistances: 105287.8 / 106743.9 / 109952.8 / 111949. Supports: 103033.3 / 100333.3 / 93337.4. Repeated rejections below 105-106k, active testing of 103-100k supports.
Volume : Normal or slightly elevated on all timeframes. No capitulation or euphoric extremes detected.
Multi-TF Behaviour : Strong sector leadership (Risk On / Risk Off Indicator = “Strong Buy” across all frames; growth stocks > market). No behavioural anomalies on ISPD DIV. High-cycle consolidation below resistance.
__________________________________________________________________________________
Strategic Summary
__________________________________________________________________________________
Overall Bias : Neutral/bullish as long as 103k/100k holds. Bullish momentum intact, but short-term caution warranted.
Opportunities : Defensive buys/technical pullbacks above 103k; scalp/range trading 103-106k.
Risk Zones : Confirmed breakdown below 100k or acceleration in LTH distribution.
Macro Catalysts : Next FOMC June 17-18; no major short-term events identified (recent neutral macro, FOMC is key for swings).
Action Plan : Prioritize strict stops (≥3%) near pivots, consistent monitoring of behaviour/volume. Avoid overexposure pre-FOMC.
__________________________________________________________________________________
Multi-Timeframe Analysis
__________________________________________________________________________________
1D : Structuring range below 109952.8-111949 resistances. Bullish HTF trend, but momentum pausing. Average volume. Risk On / Risk Off Indicator “Strong Buy”. No extreme ISPD signals (neutral).
12H – 6H : Consolidation; supports holding, no euphoric confirmation (normal volumes, ISPD DIV neutral). Sector leadership unchanged.
4H : Compression below 105287.8. Moderate volume. Defensive resumption on supports. MTFTI bullish. Dynamic risk: monitor for sell-side capitulation.
2H – 1H : Technical correction, active retest of 105k (range 103-105k). Absorption volume. MTFTI “Down”.
30min – 15min : Short-term positive bias above 103k. Risk of false break if volume remains low. Risk On / Risk Off Indicator “Buy”/“Strong Buy”.
Cross-Indicators : Market leadership confirmed: Risk On / Risk Off Indicator = Strong Buy on all frames >15min. No excess behaviour or significant divergences detected. Key ranges: 103k-105k. On-chain: heavy LTH profit-taking but no panic.
Summary : BTC market in post-cycle-high congestion phase, structurally robust, but momentum recalibrating with fewer “easy trades.”
__________________________________________________________________________________
Cross insights & on-chain summary
__________________________________________________________________________________
On-chain (Glassnode) : Top at $111.8k, correction to $103.2k by LTH profit-taking. Spot accumulation on $103.7k/$95.6k. Upside limited unless fresh buying flows return.
Macro events : Awaiting FOMC; no recent surprises. Price action and levels dominate short-term strategy.
Stops/invalidation : Swing long defended at 103k/100k (stop <100k H4). Partial short/sell below 106743.9/109952.8. Dynamic targets: 106-109.9k; extension: 111.8k if breakout on volume.
__________________________________________________________________________________
Conclusion & Actionable Plan
__________________________________________________________________________________
Market condition:
- High consolidation, ranging below major resistances.
- Long-term bullish, short-term momentum fading.
- Neutral/bullish if 100-103k holds.
- “No macro — only levels” until FOMC or volatility catalyst.
Tactical decision:
- Trade technically, stops ≥3% under supports.
- Defended buys at 103k (stop <100k), partial profit 106-109k.
- Continuous monitoring of volume/on-chain zone reaction.
- Aggressive exit/hedge below support, target 96k/83k.
__________________________________________________________________________________
100% analysis based on TradingView multi-TF, Glassnode on-chain, macro calendar and risk management.
__________________________________________________________________________________
FOMC

Coffee Pullback or Opportunity?The COT report dated May 20, 2025, reveals a gradual cooling of speculative sentiment in the coffee market. Non-commercials (speculative funds and money managers), who had largely fueled the strong rally towards the 420 USX/lb highs, are now closing long positions (–2,599 contracts), though they still maintain a significantly positive net exposure (+43,300 net contracts).
At the same time, commercials (industry operators such as roasters, exporters, and processors) have reduced both their long and short positions. However, the drop in short hedges (–4,103 contracts) is an important signal—it may suggest less need for downside protection at current prices, often an early sign of a potential market bottom.
Total open interest has decreased by 4,406 contracts, signaling a phase of liquidation and consolidation, where traders are reducing exposure rather than initiating new positions.
📌 Fundamental conclusion: The market is undergoing a healthy reset following the Q1 2025 boom, with speculators stepping back and commercials cautiously optimistic.
📈 Seasonal Analysis
Seasonal tendencies align well with the current technical outlook. May is historically a weak month, with negative average returns across most time frames (10y, 15y, 20y).
However, from June—especially July onward, data shows a strong seasonal rebound, with July–August being statistically the best-performing period of the year for coffee. This is partly due to climate-related risks (Brazilian winter, frost risk) and harvest/logistics cycles in key producing regions.
📌 Seasonal conclusion: June may offer a strategic accumulation window ahead of the traditional summer coffee rally.
🧭 Technical Analysis (Daily)
The KC1! daily chart clearly reflects a distribution and correction phase following the early March peak at 420 USX/lb.
Price has broken below the 355–360 demand zone and is currently testing a key support area between 340 and 325, previously established as a demand base during January–February 2025.
The medium-term trend remains bullish, but the market is now in a downward corrective channel, with lower highs and lower lows.
The weekly RSI sits in a low-neutral range—not yet fully oversold, suggesting there may still be room for further downside, though the bulk of the correction may already be priced in.
📌 Technical conclusion: The market is undergoing a deep pullback within a broader uptrend and is approaching potential reversal zones.
🔎 Strategic Outlook
The coffee market is in the midst of a cyclical and technical correction following its sharp Q1 2025 rally. The COT report reflects a rebalancing of speculative positioning, while commercials appear less aggressive on the short side. Seasonality favors a rebound starting June, and the technicals point to a potential long-entry zone around 340–325, attractive for medium-term positioning.
✅ Recommended Trading Setup
Base scenario (medium-term long):
Entry: Between 340 and 325 USX/lb (gradual accumulation)
Stop Loss: Weekly close below 320 (bearish confirmation)
Target 1: 390 (intermediate supply zone)
Target 2: 410–420 (return to highs)
Confluence: RSI support, COT shift, seasonal upside, technical demand zone
Alternative scenario (bearish breakdown):
Only if weekly closes below 320
This would open room toward 300–285 USX/lb
📌 Final Conclusion
While short-term caution is warranted, current conditions offer attractive long re-entry opportunities for those who await confirmation around the 325–340 support area.
The ideal setup would include:
Weekly stabilization with higher lows
Renewed speculative long positioning in COT
Seasonal momentum kicking in from mid-June

SHORT ON SPY (SPX/USD)Spy has given us bearish divergence at a major supply zone.
I will be selling spy to the next support level.
Today is FOMC and I expecting it to influence spy move to the downside.

USDCHF – Awaiting Breakout Ahead of FOMC: Key Levels in Focus USDCHF – Awaiting Breakout Ahead of FOMC: Key Levels in Focus
📌 MARKET OVERVIEW
USDCHF is currently consolidating within a tight range after a technical rebound from the 0.8226 support zone. The price is testing a confluence area at the descending trendline and the 200 EMA on the H2 chart, indicating indecision between bulls and bears as we head into the high-impact FOMC event.
🔍 TECHNICAL ANALYSIS – H2 CHART
Overall Trend: Sideways corrective move within a broader downtrend channel. Price is approaching critical resistance at the EMA200 and the channel’s upper boundary.
EMAs in focus: EMA13 (black), EMA34 (orange), EMA89 (red).
Fibonacci Retracement: Price is hovering around the 0.5 fib zone (0.8298), a neutral level for potential reaction.
🎯 Key Levels & Trade Scenarios:
Major Resistance Zone: 0.8330 – 0.8368 → aligned with the 0.618 Fibonacci retracement and previous structural high.
Key Support Zone: 0.8226 → strong demand area. A break below this could expose deeper downside or set up a false break trap.
📌 Most Likely Path:
Price could dip back to 0.8226 before launching a bullish recovery targeting 0.8330 – 0.8368.
A clean breakout above 0.8368 with momentum and volume could invalidate the bearish bias and shift the trend mid-term.
🌍 MACRO & FUNDAMENTAL CONTEXT
FOMC IN FOCUS: The Federal Reserve is expected to hold rates steady at the upcoming meeting. However, market attention will be on Powell’s tone. A hawkish stance could fuel further USD strength, propelling USDCHF toward resistance zones.
SNB (Swiss National Bank) maintains a neutral tone with slight disinflationary concerns, offering limited support for the CHF and strengthening the USDCHF upside case.
US Treasury Yields are showing signs of recovery, adding bullish pressure to USD pairs.
📌 TRADING STRATEGY:
Watch for bullish reaction at 0.8226 – potential long setup if RSI divergence appears.
Short-term targets: 0.8330 → 0.8368.
Breakout Strategy: If price clears 0.8368 with conviction, shift bias to bullish continuation and monitor for FVG or trendline breakout alignment.
📣 Stay sharp for increased volatility around FOMC. Position sizing and discipline are key in macro-heavy weeks like this.

Gold Weekly AnalysisThe FOMC meeting could make cold rise up dramatically.
The indicated levels are determined based on the most reaction points and the assumption of approximately equal distance between the zones.
Some of these points can also be confirmed by the mathematical intervals of Murray.
You can enter with/without confirmation. IF you want to take confirmation you can use LTF analysis, Spike move confirmation, Trend Strength confrimation and ETC.
SL could be placed below the zone or regarding the LTF swings.
TP is the next zone or the nearest moving S&R, which are median and borders of the drawn channels.
*******************************************************************
Role of different zones:
GREEN: Just long trades allowed on them.
RED: Just Short trades allowed on them.
BLUE: both long and short trades allowed on them.
WHITE: No trades allowed on them! just use them as TP points

SPY/SPX: FOMC. Do we get rate cuts or do we even get a hike?!TA on SPY but I also like playing SPX.
Was seeing this as either a rising wedge, and if play (with FOMC etc.) can touch and retest
551.41 then back move back up to test 562.81 and to out at 567.85 IF market reacts well to FOMC, maybe ATH?
If not, we actually fulfill that rising wedge to 543.54 with a small gap to touch/retest at 534.54
I may sit sidelines until FOMC to catch the move and waves. Always wait for the set up to come to you! One of the rules I try to keep following but I break.
Let me know what you think. Will continue to update as it the week progresses.
Again, do your own DD. Not financial advice.

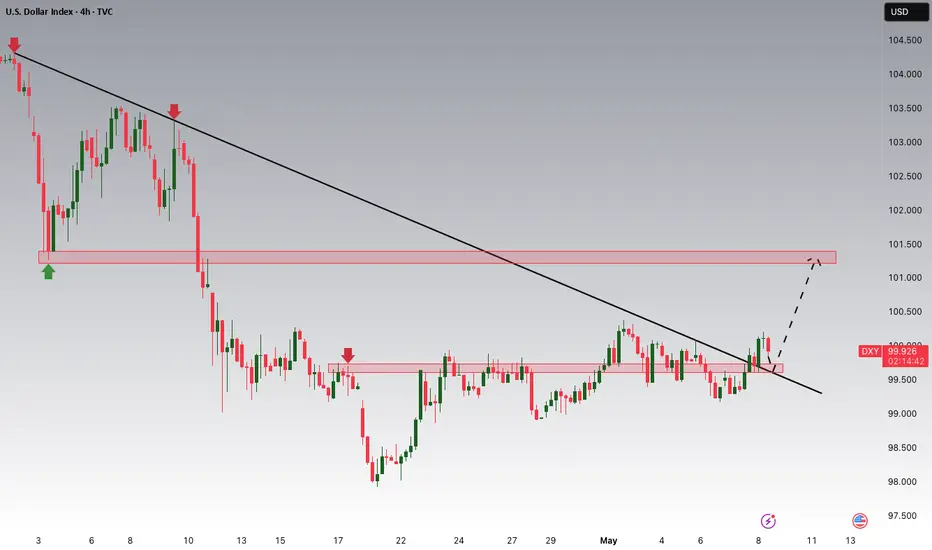
Why I'm Bullish on the DXY: A Fundamental Approach!Powell continues to take a cautious tone, emphasizing a wait-and-see approach while acknowledging rising inflation risks, which suggests there's no urgency to cut rates. This leans slightly hawkish, especially compared to the market’s more dovish expectations, and could support some near-term Dollar strength. However, a more sustained move in the USD likely hinges on progress in upcoming trade discussions—particularly with China. Today's FOMC outcome is just one part of the broader picture; the next key signal may come with developments in the coming days. For now, the bias remains USD bullish heading into the London session.
Technically, the DXY has broken its downtrend, signaling a potential shift in momentum. I’ll be watching for a possible retracement toward the 99.700 area, which could serve as a key support level before any further upside continuation.
THE KOG REPORT - FOMCTHE KOG REPORT – FOMC
This is our view for FOMC, please do your own research and analysis to make an informed decision on the markets. It is not recommended you try to trade the event if you have less than 6 months trading experience and have a trusted risk strategy in place. The markets are extremely volatile, and these events can cause aggressive swings in price.
Our NFP KOG Report worked pretty well apart from it being a Friday and us closing out positions for the weekend only for the move to complete on Monday. For this FOMC we’ll share the levels and potential reaction points on the red boxes as well as the red box target levels. Due to the range, it’s best to wait for the break and also for them to move the price to where they want, then hunt the trade once price has settled.
We have the immediate support level below 3360-55 which if held can push this upside to break the recent high and that 3480-90 level again. Break of that level we have red box region 3330-20 which is where we could get a RIP but that will give us the flip with potential for the order region 3350-55 to turn into resistance unless broken. For that reason, a down move for now could only give scalps for decent captures on tap and bounces.
3320 is the line in the sand, if broken below we’ll get the long from the 3290-95 region which will come next week.
Note, these days it’s only Trump that manages to move the markets aggressively, so this FOMC is most likely already priced in. Not worth attempting the immediate levels so we’ll rather wait for the extreme levels.
RED BOXES INDI LEVELS:
Break above 3395 for 3406, 3410, 3420, 3430 and 3435 in extension of the move
Break below 3375 for 3370, 3366, 3356, 3351 and 3345 in extension of the move
Please do support us by hitting the like button, leaving a comment, and giving us a follow. We’ve been doing this for a long time now providing traders with in-depth free analysis on Gold, so your likes and comments are very much appreciated.
As always, trade safe.
KOG

XAUUSD - Gold trend after FOMC!Gold is trading above EMA200 and EMA50 on the 4-hour timeframe and is trading in its descending channel. A downward correction in gold will lead to buying opportunities from demand zone.
Barclays Bank has issued a warning that the likelihood of an economic recession in the United States is increasing. According to the bank, ongoing uncertainty in U.S. trade negotiations has weakened business confidence and reduced investment activity, which could potentially steer the economy toward contraction.
In a note to its clients, Barclays stated: “The longer this uncertainty drags on without tangible progress in negotiations, the greater the risk of a recession becomes.” While the bank still considers a mild recession to be the most likely scenario, it emphasized that this outcome could be avoided if trade tensions ease.
Barclays also pointed to challenges facing the U.S. stock market, warning that further gains in equity prices will be difficult. The bank cited downgraded corporate earnings forecasts and President Trump’s unpredictable policy decisions as major obstacles to continued market growth.
Meanwhile, investment bank Goldman Sachs reaffirmed its bullish stance on gold, forecasting that the price per ounce could reach $3,700 by the end of 2025 and rise to $4,000 by mid-2026. In the event of a U.S. recession, increased capital inflows into exchange-traded funds (ETFs) could push gold as high as $3,880. Additionally, in risk-heavy scenarios—such as shifts in U.S. reserve policy or concerns about the Federal Reserve’s independence—gold could surge to $4,500 by year-end 2025.
Analysts at CPM Group noted in their assessment that the U.S. government has recently pulled back from some of its tariff threats while also facing legal resistance and declining public support. They added that the release of weaker-than-expected economic data in recent days has raised speculation that the White House may backtrack on some of its more costly economic and political initiatives.
Nevertheless, the firm cautioned that this reduction in perceived risk is likely temporary. “The recent price drop may prove short-lived, as it seems unlikely the government will completely abandon its plans. Rather, those policies may be restructured and pursued with a new approach. As such, the latest dip in gold prices—or any near-term decline—could present a strategic buying opportunity,” they said.
CPM Group bases this outlook on the assumption that the geopolitical and economic forces that have supported gold and silver demand in recent months remain largely intact. Although some recent signals point to easing tensions, there are also indications that conditions could become more volatile later this year.
Finally, the analysts added a seasonal perspective, stating: “We expect gold prices to peak between March and May, followed by a corrective phase through August—a pattern that could pave the way for new highs later in the year. Therefore, another rally in May is plausible, and purchasing during pullbacks—or even at current levels—could be a rational decision in the very short term.”

US500 - Which way will the stock market go?!The index is trading above the EMA200 and EMA50 on the four-hour timeframe and is trading in its ascending channel. If the index moves down towards the specified demand zone, one can look for further S&P buy positions with a good risk-reward ratio.
In its meeting last night, the U.S. Federal Reserve decided to keep the federal funds rate steady within the 4.25% to 4.50% range. This decision comes amid growing concerns about simultaneous rises in inflation and unemployment, particularly driven by the tariff policies of the Trump administration.
This marks the third consecutive time this year that the Fed has held rates unchanged, reflecting mounting economic uncertainty and fears of stagflation.Fed Chair Jerome Powell warned that the combination of high inflation, slow economic growth, and rising unemployment could lead the economy into stagflation. He noted that newly imposed tariffs could delay the disinflation process for up to a year or more.
The Trump administration has introduced steep tariffs, including a 145% levy on imports from China. These measures have contributed to rising prices and slower economic growth, placing additional strain on monetary policymakers.
Following the Fed’s announcement, stock markets exhibited volatility. The S&P 500 initially fell but ended the day higher. Bond yields declined, while the U.S. dollar strengthened.
Powell emphasized that future monetary policy decisions will be heavily data-dependent, and the central bank stands ready to act swiftly if necessary. He acknowledged that the economic outlook remains uncertain, requiring cautious and adaptive policy management.
Faced with escalating uncertainty and inflationary pressures stemming from new trade measures, the Fed has adopted a cautious stance. Given the current mixed economic indicators, the central bank is expected to maintain its interest rate policy until the economic picture becomes clearer.
Economists at Goldman Sachs have issued a warning that U.S. inflation is on the rise and may reach 3.8% by the end of 2025. According to their analysis, the weakening of the U.S. dollar and the implementation of tariff policies are the main drivers of increased inflationary pressure. Additionally, changes in import demand could elevate production costs and further intensify price increases.
The Wall Street Journal reported that new tariffs may raise the prices of smartphones and laptops by up to 30%. Contrary to popular belief, this inflationary impact may not be temporary and could result in sustained upward pressure on prices.
Meanwhile, ahead of the FOMC meeting, Alphabet (Google’s parent company) saw its stock plunge over 8%, falling to $149.50. Eddy Cue, a senior executive at Apple, disclosed that for the first time in April, user activity on browsers and search engines had declined. In response, Apple is exploring the integration of AI-powered search into its browsers—a move that could pose a serious threat to Google’s advertising revenue.
Simultaneously, President Trump announced he would not enforce the AI content restriction law, initially introduced during the Biden administration and scheduled to take effect on May 15. This decision comes just before his trip to the Middle East, where countries like Saudi Arabia and the UAE have voiced frustration over chip access restrictions.
Trump administration officials are currently drafting new legislation aimed at tightening control over the export of advanced chips. This initiative may form part of a broader agreement, as the UAE has pledged to invest up to $1.4 trillion in U.S. technology and infrastructure over the next decade.

Will GBP/USD head lower from THIS major resistance zone?Sterling finds itself walking a financial tightrope this week. The GBP/USD is delicately poised between transatlantic central bank decisions and murky trade headlines. As the Federal Reserve holds court across the pond and the Bank of England gets ready to show its hand, traders are bracing for a possible divergence in tone—and in policy. The dollar has taken a softer step into the week, retreating after two weeks of modest gains. But don't be fooled: that weakness could easily reverse if the Trump administration’s trade negotiations result in new agreements. Officials suggest deals with partners beyond China might be inked by week's end. Until then, the markets remain unimpressed. Friday’s US nonfarm payrolls came and went with little fanfare, and Monday’s ISM services PMI barely registered. So far, the macroeconomic data has taken a backseat to geopolitical posturing.
Trade Truce Could Revive the Dollar’s Fortunes
The dollar index has wobbled a little after a brief two-week recovery, helped by an unwind of previous “Sell America” trade. But the big question remains: will Washington and Beijing finally bury the hatchet? Equity markets are behaving as if they expect some form of resolution—however vague—but the greenback hasn't followed suit. Fed independence is also under the microscope, with President Trump’s persistent rate-cut rhetoric raising eyebrows. The political fog isn't helping matters. Yet, a trade breakthrough—particularly with China—could lend support to the dollar, shifting sentiment swiftly.
Sterling's Fate Hinges on Central Bank Theatre
Two heavyweight monetary policy announcements are set to dominate fate for the GBP/USD currency pair over the next 24 hours or so.
• FOMC Rate Decision – Wednesday, 7 May, 19:00 BST
No surprises expected here. The Fed is widely tipped to hold rates steady at 4.25–4.50%. The real drama lies in the messaging. With political noise in the background, Powell may aim to exude calm and control. Markets will scour the statement for hints of June’s outlook.
• Bank of England Rate Decision – Thursday, 8 May, 12:00 BST
Here’s where the action really lies for sterling. A 25bp cut is largely priced in, and a dovish 9-0 vote wouldn’t shock anyone. But traders will pay close attention to the inflation outlook—especially with energy prices softening. A slightly more optimistic growth revision could temper the dovishness. Any hint of hawkish resistance may offer the pound a temporary reprieve, perhaps even lifting GBP/USD to flirt with 1.3500.
Technical Outlook: Cable Bumps Up Against Familiar Ceiling
Technically speaking, GBP/USD is looking a bit overextended, though bears haven’t been vindicated just yet. Last week’s weekly chart printed an inverted hammer—a warning shot, perhaps, but without any firm follow-through so far.
The pair recently tested September’s high at 1.3434 before retreating. But more formidable resistance lurks between 1.35 and 1.40—a zone that’s proved impenetrable since the Brexit saga began. So, the path upward may be limited from here on.
On the downside, keep an eye on 1.3250 for initial support, followed by the psychological barrier at 1.3000.
Final Word
It’s shaping up to be a pivotal week for cable. Trade chatter has failed to energise the dollar, while sterling stands on the edge, waiting for the Bank of England’s cue. With Powell and Bailey both stepping into the spotlight, and global trade deals waiting in the wings, this week could deliver the jolt that the GBP/USD has been waiting for. For now, a cautious stance on sterling feels justified—but everything’s in play, and sentiment may turn quickly.
By Fawad Razaqzada, market analyst with FOREX.com

SPX Update: broken out of rising wedge. What Im seeing for now. Looking for a gap fill into tomorrow. My puts though are red, planning to swing my SPX puts. FOMC tomorrow, de-risk SP:SPX

Supply and Demand Zones 5/6/25 and 5/7/25 $NQChart link: www.tradingview.com
On the 4HR chart, price is setting up for a head and shoulders pattern, but there has been solid break and retests of past levels to allow price to move up into the Daily supply above. Given the previous news released today from Trump that there is 'talks' to get settled with Canada and China tariff prior to FOMC, I expect a large move to take place between tomorrow and Thursday.
If we have a continued strong bounce off the 30MIN demand and 1/4HR imbalance zones and break over 20273, then I will consider a long into the 20390 4HR imbalance above (50%) and the daily supply above of 20440 (50%).
If we have bearish order flow where we break through the demand zone (break and retest) to go lower, then I will consider shorts towards 19600/19100/18700 demand and previous breakout levels.

USDJPY Forecast: Haven Appetite Back in SightUSDJPY remains above the 0.618 Fibonacci retracement zone at 139, stemming from the uptrend between January 2023 (127.20) and July 2024 (162.00).
However, the pair is currently trading below resistance at 146, steering the trend back toward key support levels at 142 and 139.
A decisive break below 139 could expose new 2025 lows near 138.30 and 134.60, both key Fibonacci levels.
On the upside, a rebound above 146 may open the way to 149 and 151, testing the grounds for a more sustainable uptrend.
Written by Razan Hilal, CMT

SPX Running Into Important Resistance At 5780Last week we saw a weaker-than-expected Advance GDP in the first release, which led some to believe Powell might consider cutting rates. But Friday’s NFP came in better than expected. Expectations are no change for the Fed, and I honestly don’t believe they’ll move either.
Despite Trump putting pressure on them, inflation is still not at their 2% target, and the job market remains solid—so there may be no real reason to cut yet.
They’re watching markets too, and we've seen a pretty strong rebound, so there’s likely no urgency to act now.
Also, if they were to cut, it could appear politically motivated due to Trump, and that could seriously damage investor trust in the Fed’s independence.
So with that being said, we are wondering if the SPX can find some resistance if FED does not deliver a dovish view at this moment. Well, looking at the price action, it certainly looks overlaping recovery from April low, that can face limited upside near 5780, at April 2nd high.
If by Friday, we close above the 78.6% Fib then we may look at wave 3, alt sceario.
Grega

GBPUSD Forecast: Double Top or Flat?In contrast to EURUSD, the GBPUSD chart reflects a double top or flat rather than a head-and-shoulders pattern. However, unlike DXY and EURUSD, GBPUSD hasn’t broken below its neckline, maintaining a bullish bias as RSI continues to show positive momentum.
• Upside Scenario : If the pair breaks above the 1.3345 high, the next targets are 1.3380, 1.3400, 1.3440, and 1.3500, in the direction of the duplicated channel confirming the possible consolidation as a flat.
• Downside Scenario : A break below the neckline and 1.3200 support could trigger a decline toward 1.3080, confirming a double top formation on the pair.
Volatility catalysts for this week range between the FOMC Outlook and BOE Meeting, between Wednesday and Thursday, following their respective rate decisions
Written by Razan Hilal, CMT

NAS100 - Stock Market, Waiting for FOMC?!The index is above the EMA200 and EMA50 on the 4-hour timeframe and is trading in its ascending channel. I expect corrective moves from the specified range, but if the index continues to move upwards towards 21,000 points, we can look for the next Nasdaq short positions with a risk-reward ratio.
Last week, U.S. equity markets experienced $8.9 billion in capital outflows, while equity markets in Japan and the European Union saw net inflows. Additionally, U.S. Treasury bonds recorded an outflow of $4.5 billion—the largest since December 2023. Meanwhile, the gold market witnessed its first weekly investment decline since January.
Looking ahead, financial markets are focused on the upcoming earnings reports from major companies across sectors such as technology, healthcare, automotive, energy, and financial services. These reports are expected to significantly influence equity trends, investment strategies, and corporate outlooks. Below is a daily breakdown of key companies set to release earnings this week:
Monday, May 5, 2025
The week starts with a focus on the healthcare and biotech sectors:
• Before market open: Companies such as Palantir, Ford, Onsemi, and Tyson Foods will report earnings. Palantir and Ford are particularly noteworthy for investors in the tech and auto sectors.
• After market close: Healthcare firms like Hims & Hers Health, Axsome Therapeutics, and financial company CNA Financial will report.
Tuesday, May 6, 2025
Tuesday highlights several key tech earnings:
• Before market open: Celsius, Datadog, Rivian, and Tempus will publish their results. Rivian’s report is especially anticipated due to the intense competition in the electric vehicle space.
• After market close: Tech giants like AMD and Arista Networks will release earnings, along with Marriott from the hospitality sector.
Wednesday, May 7, 2025
A packed day for earnings reports:
• Before market open: Reports from Uber and Teva are expected, along with ARM Holdings, a key player in semiconductors.
• After market close: AppLovin, Unity, and Robinhood will release their reports—representing digital gaming, software, and fintech respectively.
Thursday, May 8, 2025
This day centers on digital health, cryptocurrency, and e-commerce:
• Before market open: Peloton and Shopify will report. Shopify’s performance is particularly critical in the online retail sector.
• After market close: Crypto firm Coinbase and online sports betting platform DraftKings are in focus.
Friday, May 9, 2025
Fewer companies will report, but some are of strategic interest:
• Firms like 1stdibs, Ani Pharmaceuticals, and Embecta are scheduled, as well as Telos and Algonquin—key names in energy and cybersecurity investing.
This week, markets are closely monitoring Wednesday’s FOMC meeting. At the March session, the Fed left rates unchanged and signaled only two potential cuts totaling 50 basis points for the year, based on its dot plot—suggesting a cautious approach to monetary easing.
Simultaneously, April’s U.S. Services PMI is set to be released today, providing clearer insights into post-tariff business activity.
Amazon’s CEO stated that, so far, there is no indication of reduced demand due to tariff concerns. Some inventory spikes were noted in specific categories, likely driven by stockpiling ahead of tariff implementation. Retail prices, on average, have not significantly increased, and most sellers have yet to raise prices—though that could change depending on how tariff policies evolve. Notably, essential goods have grown at twice the rate of other categories and now account for a third of all unit sales in the U.S.
Following April’s jobs report, the likelihood of a Fed rate cut in June dropped from 75% to 42%. With only one more employment report due before the June 18 meeting, hopes for an early policy shift have faded. Some analysts argue that without the tariff conflict, the Fed might already be cutting rates, given the downward trend in inflation, steady growth, and Congressional focus on fiscal measures.
The April jobs data showed that the U.S. labor market remains resilient—neither too strong to spark inflation fears nor too weak to trigger panic. After the release, with market confidence rebounding, Goldman Sachs forecasted the Fed’s first rate cut to come at the July 30 meeting.
The consensus expectation is for the Fed funds rate to remain in the current 4.25%-4.5% range, unchanged since January. The CME FedWatch tool currently assigns just a 1.8% chance of a rate cut at the upcoming meeting.
Economists warn that Trump’s newly imposed tariffs—active since April—could drive up prices and hurt employment, challenging the Fed’s dual mandate of controlling both inflation and joblessness. However, recent data shows inflation remained mild in March and the labor market held steady in April.
Nancy Vanden Houten, Chief U.S. Economist at Oxford Economics, wrote: “The data is strong enough for the Fed to stay on the sidelines and monitor how tariffs influence inflation and expectations.” While hard data remains stable, forecasts and sentiment surveys signal looming challenges. Business leaders and individuals express concern that rising costs may burden consumers and businesses in the coming months or years, possibly even tipping the economy into recession.

GOLD MARKET UPDATE – Trend Breakouts and Market Structure Shift🟡 GOLD MARKET UPDATE – Trend Breakouts and Market Structure Shift
Gold has broken through both the parallel ascending channel and a narrow triangle pattern at the edges, resulting in a strong buying momentum (FOMO BUY). This move can be attributed to a mild positive shift in the US stock market yesterday, along with some upward momentum in the Asian and European markets today.
📉 Current Situation: It’s still unclear whether this movement is tied to positive news about tariffs, but an important level to watch is 3075 – 3077. If this level is breached, it may be time to reassess the outlook and consider shifting towards a BUY.
💡 Currently, there’s strong buying activity during the European session. It’s recommended to avoid jumping into BUY positions at these levels and to refrain from selling too aggressively.
📌 Scenario for Today: Look for potential BUY opportunities at the important levels 3030 – 3018 during the European session, and stay tuned for updates regarding FOMC tonight.
🔮 Be Cautious: The FOMC meeting will take place later today, which could lead to significant market movements. Be prepared for potential volatility and liquidity sweeps in less liquid areas.
🧭 Key Technical Levels:
🔺 Resistance: 3075 – 3090 – 3110
🔻 Support: 3030 – 3018 – 3000 – 2988 – 2974
🎯 Trade Setup:
🔴 SELL ZONE: 3074 – 3076
SL: 3080
TP: 3070 – 3066 – 3062 – 3058 – 3054 – 3050 – 3040
🟢 BUY ZONE: 2976 – 2974
SL: 2970
TP: 2980 – 2984 – 2988 – 2992 – 2996 – 3000
📌 Reminder: The market is currently very sensitive, so stick to risk management rules, ensure full TP/SL implementation, and avoid making hasty decisions.
Be cautious and watch the market movements closely!
— AD | Money Market Flow

EURUSD TO BUY (Wednesday-FOMC Meeting Minutes and Thursday-CPI)As EURUSD as been dropping the past couple of days, it has been on the support levels of 1.0900 lately. On Wednesday and Thursday, there are news about FOMC Meeting Minutes and CPI of the US Dollar. Therefore, we could possibly see price of the EURUSD going up based on news, support pattern of the triangle.
TP: 1.1050-1.110

EUR/USD - Waiting for a long Hi,
FX:EURUSD ascending triangle
I will wait for a pullback towards 1.075 or the major support at 1.6129 before entering in a long position as previously mentioned.
I'm expecting the 1.10 area of resistance to be tested before we see any real downwards momentum.
Wait for the Blue area circled to give way to confirm heavy selling pressure.

Gold Bulls in Control, But a Trap Might Be Coming ahead of FOMCGold remains in a strong uptrend with minimal pullbacks, and we are now approaching all-time highs. With the FOMC interest rate decision later today, volatility is expected. Historically, in similar scenarios, gold tends to break its ATH before experiencing a sharp reversal due to increased liquidity.
If this pattern plays out again, I will be looking for potential short opportunities once liquidity is trapped at higher levels. However, the trend remains bullish, so proper risk management is essential. If you are considering shorts, ensure you use a well-placed stop loss and follow your own strategy.
📌 Stay updated with new ideas, and feel free to share your insights in the comments!
📢 If you found this analysis helpful, a boost is always appreciated! 🚀

BTC Update 4 Hour/ FOMC Day March 19, 2025, GAME PLAN!🚨 FOMC Day Update – March 19, 2025 🚨
BTC at ~$83,244 (+0.28%–1%) as markets stay cautious. Fear & Greed at 23, RSI at 44.05 = neutral momentum.
While BTC is trading below all significant EMs, 50 100 and 200, It has broken above the 21EMA which is bullish for the short term.
Fed likely to hold rates at 4.25%–4.50% (99% odds) – a surprise cut could ignite a BTC rally. Whale accumulation signals potential upside.
Sentiment data and whale accumulation hint towards a possible upside but only if FED surprises with a rate cut.
The current pump in the market will be short-lived if there's no change in the rates which is very likely.
So be careful with your longs and shorts.
Volatility will kill both bears and bulls.
You need to keep an eye on Powell’s 2:30 PM EST speech.
Inflation & liquidity outlook will shape BTC’s next move. Stay sharp!
I'll keep you updated.
Let me know what you think in the comments and do hit that like button if you like this post.
Thank you
#PEACE

THE KOG REPORT - FOMCTHE KOG REPORT – FOMC
This is our view for FOMC, please do your own research and analysis to make an informed decision on the markets. It is not recommended you try to trade the event if you have less than 6 months trading experience and have a trusted risk strategy in place. The markets are extremely volatile, and these events can cause aggressive swings in price.
While gold is relatively new to this range we have to entail some caution if we’re even going to consider trading this FOMC. Markets are a little fragile, we’re at ATH’s and the moves are extremely aggressive. So, we’ll highlight the red box levels and the potential move we’ll be looking for, sticking to the extreme and key levels, ignoring the intermediate levels.
Looking at the chart we have a support region below 3010-15 which if spiked into and held can push this back up this time to break above 3030 and attempt to attack that 3050 region. That in our opinion would be the first point to start looking for price to exhaust, but it will only give us the flip so longer scalps are likely to be all we’ll get.
If we break above the 3055 region we’re likely to go higher giving us a red box resistance level of 3065-75. It’s this level we would ideally like to target from a lot lower down if we can get that entry. For that reason, we have given the level below on the break of 3010 sitting around 2990-80, we’ll have to wait and see, but if we can get down there a nice swing could present itself.
RED BOX INDICATOR:
Break above 3030 for 3050, 3055, 3063 and 3070 in extension of the move
Break below 3020 for 3912, 3006, 2996 and 2990 in extension of the move
Please do support us by hitting the like button, leaving a comment, and giving us a follow. We’ve been doing this for a long time now providing traders with in-depth free analysis on Gold, so your likes and comments are very much appreciated.
As always, trade safe.
KOG
