Is the USD selloff too aggressive? Bond yields suggest soTraders continue to sell the US dollar in anticipation of a dovish speech from Jerome Powell on Friday. To the point where we wonder if this could be a case off "sell the rumour, buy the fact". Matt Simpson takes a quick look at the USD dollar index and bond yields.
FOMC

BITCOIN NEXT MOVEMENTRelief pump to $60K++ (before CPI Reports on Aug 14), may continue until next FOMC in SEPTEMBERRRRR
BTC Is in the consolidation zone for 5-6 months!!!! maybe next FOMC will be a BIG trigger for a breakout in the consolidation zone !!!
one more.. this is not a regular sellof and very rare to have a structure like this weird ahh candle.
huh.

Fed Signals Possible Rate Cuts, but Crypto Markets Rattled
Federal Reserve officials signaled the possibility of a September rate cut during their July meeting: But crypto prices pulled back after Iran pledged it would retaliate against Israel for assassinating Hamas leader Ismail Haniyeh on Iranian soil.
Donald Trump expressed strong support for cryptocurrency at the Bitcoin Conference in Nashville: Trump pledged to set up a strategic bitcoin reserve, stop the US from selling its bitcoin, and fire SEC chair Gary Gensler if he gets re-elected.
Cantor Fitzgerald CEO Howard Lutnick announced the firm's plan to establish a Bitcoin financing business with an initial $2 billion investment: The initiative aims to provide leverage to bitcoin investors and strengthen the cryptocurrency ecosystem.
The nine US spot Ethereum ETFs saw $98.29 million in outflows on Monday, extending their negative flow streak: BlackRock’s ETHA and Fidelity FETH led the inflows, while Grayscale Ethereum Trust faced significant outflows.
The SEC is looking to amend its complaint against Binance, which could delay a court ruling on the security status of specific tokens: This move involves third-party crypto asset securities and adheres to a court directive for further proceedings.
Fed Signals Possible Rate Cuts, but Middle East Tensions Rattle Crypto Markets
Federal Reserve officials at their July meeting on Wednesday opted to keep interest rates unchanged at 5.25%-5%, after the personal consumption expenditures (PCE) price index, a key inflation measure, increased by only 0.1% in June. This brought the year-over-year rise to 2.5%, down from 2.6% in May, moving closer to the Fed’s 2% inflation target.
Federal Reserve chair Jerome Powell for the first time hinted at the possibility of cutting rates in September, saying the move is “on the table” if the US continues to make progress on inflation. That would mark the first time the Fed has cut rates in four years.
The announcement did not appear to have much impact on cryptocurrency prices. On Wednesday, hitcoin dropped about 2%, below $65,000, while ether dropped more than 1%, hovering above $3,200. The negative price action came after a New York Times report indicated that Iran will take retaliatory action against Israel after Israel assassinated Hamas leader Ismail Haniyeh in Tehran.
🪙 Topic of the Week: What Are Stablecoins?
➡️ Read more here

THE KOG REPORT - FOMC THE KOG REPORT – FOMC
This is our view for FOMC, please do your own research and analysis to make an informed decision on the markets. It is not recommended you try to trade the event if you have less than 6 months trading experience and have a trusted risk strategy in place. The markets are extremely volatile, and these events can cause aggressive swings in price.
A great week so far on Gold with our targets completing and the path working out how we hoped. We’re now just above that order region we wanted attempting to break above, so for this report we’ll keep it simple.
Price rejects above in the 2435-40 region, potential for this to pullback all the way into the 2400 region, unless broken. That lower region is where we would potentially be looking to buy in again.
Price pushes down, we’ll be looking in that region for a move upside. We have immediate support below 2415 which could be tapped but needs to cross below, otherwise, we’re likely going to hover up here, spike and then make the move.
Wouldn’t recommend trading the event, we’ve done our trading for the day. Best to wait for the move to finish and then look for the entry from a decent level.
Please do support us by hitting the like button, leaving a comment, and giving us a follow. We’ve been doing this for a long time now providing traders with in-depth free analysis on Gold, so your likes and comments are very much appreciated.
As always, trade safe.
KOG

Pre-FOMC Rates Decision Analysis31st July (FOMC Decision Pending)
DXY: Ranging between 104.20 and 104.55. If Fed makes no comment on rate cut, DXY could push up to 105.20. If Fed makes comment on rate cuts in Sept, DXY could push down to 103.65.
NZDUSD: Buy 0.5930 SL 20 TP 50 (DXY weakness)
AUDUSD: Sell 0.6450 SL 25 TP 90 (DXY strength)
USDJPY: Sell 151.50 SL 70 TP 245 (DXY weakness)
GBPUSD: Sell 1.28 SL 20 TP 65 (DXY strength & BoE decision tomorrow)
EURUSD: Sell 1.08 SL 20 TP 55 (DXY strength)
USDCHF: Sell 0.8820 SL 20 TP 70 (DXY weakness)
USDCAD: Buy 1.3850 SL 20 TP 45
Gold: Needs to break 2425 to trade up to 2450 (DXY weakness)

EUR/USD Key Levels: 1.075 - 1.081 - 1.066 General Overview:
The EUR/USD pair has recently lost ground in a short-term bullish recovery, testing new two-week lows near the 1.0800 level, as the movement's momentum has drained out ahead of updates on EU GDP data. The latest Federal Reserve interest rate decision is expected on Wednesday, with a new round of US Nonfarm Payrolls (NFP) scheduled for Friday.
Fundamental Analysis:
The US Dollar (USD) started the week on a positive note, reversing consecutive daily gains in EUR/USD and testing three-day lows near the 1.0800 region. Expectations of interest rate cuts by the Federal Reserve (Fed) and the European Central Bank (ECB) after the summer break have influenced market dynamics.
In terms of monetary policy, the Fed is expected to keep rates unchanged at the July 31 meeting, while the easing cycle is anticipated to begin in September. The ECB, according to recent comments from Vice President Luis de Guindos, may also cut rates in September. This policy divergence between the Fed and the ECB could lead to further weakening of the European currency in the medium term.
Key Macroeconomic Data:
Market participants will closely follow the release of preliminary Q2 GDP data from both Germany and the Eurozone, as well as advanced inflation data from Germany, scheduled for July 30. The preliminary Eurozone CPI report will be released on Wednesday, followed by the outcome of the FOMC monetary policy meeting. Finally, key US macroeconomic data, including the Nonfarm Payrolls (NFP) report scheduled for Friday, will be crucial in determining the next moves for the EUR/USD pair.
Technical Outlook:
From a technical perspective, spot prices showed resilience below the 50% Fibonacci retracement level of the June-July rally on Monday, although the lack of significant buying suggests caution for bulls. Oscillators on the daily chart are starting to gain negative traction, suggesting that the path of least resistance for EUR/USD is to the downside.
Spot prices could weaken further below the 61.8% Fibonacci level near the 1.0775 region and test the next relevant support near the 1.0745 horizontal zone. This is closely followed by the 78.6% Fibonacci level near the 1.0730 area, below which EUR/USD could challenge the June monthly low, around the 1.0660 region, with some intermediate support near the psychological 1.0700 mark.
Conversely, any subsequent move up is likely to confront resistance near the 1.0840-1.0845 region or the 38.2% Fibonacci level. Sustained strength beyond this could lift the EUR/USD pair above the 1.0865 horizontal barrier towards the 1.0885-1.0890 region. Continued buying beyond the 1.0900 level should allow bulls to aim back towards retesting the multi-month peak, around the mid-1.0900s.

GBP/USD edges lower after soft retail sales reportThe British pound has slightly lower on Friday. GBP/USD is trading at 1.2922 in the North American session, down 0.17% on the day. The pound has sparkled in the month of July but has hit a snag, dropping 0.50% on Thursday and extending those losses today.
UK retail sales suffered a turnaround in June, falling 1.2% m/m after a strong gain of 2.9% in May and below the market estimate of -0.4%. Annually, retail sales fell 0.2%; following a revised 1.7% gain in May and shy of the market estimate of a 0.2% rise.
Fingers were pointing again at inclement weather, which kept shoppers away from the stores. A wet April was blamed for a weak retail sales report and the unseasonably cool weather in June, along with uncertainty prior to the July 4th election were blamed for a decrease in June retail sales.
Consumers are showing a reluctance to spend, despite inflation falling to 2% and an increase in wages. Consumers have been squeezed by inflationary pressures and high interest rates and confidence in the economy has been weak. Still, the GfK consumer confidence index, released on Friday, ticked up to -13 for July, up a notch from -13 in June and its highest level since September 2021.
In the US, the Fed is signaling that the central bank is moving closer to a historic rate cut. Earlier in the week, FOMC members Chris Waller and John Williams hinted at a rate cut in the coming months, although neither provided a specific date. Waller said that the higher-than-expected inflation in the first quarter of 2024 may have been an “aberration” and inflation was moving lower towards the 2% target. The markets have priced in a September cut at 90%, up from just 70% several weeks ago.
GBP/USD is testing support at 1.2915, followed by support at 1.2887
1.2969 and 1.2997 are the next resistance lines

EUR/USD – slightly lower as ECB holds interest ratesThe euro has edged lower on Thursday. Early in the North American session, EUR/USD is trading at 1.0919, down 0.18% on the day. The euro hasn’t posted a losing day since July 9, gaining 1% during that period.
The European Central Bank maintained its key lending rate at 3.75% at today’s meeting, after cutting rates by a quarter-point in June. The decision to hold rates was widely expected, especially after the June cut, and the euro has had a calm day. The markets are following ECB President Lagarde’s press conference, hoping for clues about future rate policy.
The rate statement noted that “services inflation is elevated and headline inflation is likely to remain above the target well into next year”. The markets weren’t perturbed by this hawkish comment as the ECB has demonstrated that it is willing to lower rates even when inflation is above the 2% level, as it did in June.
The markets have priced in two more quarter-point cuts in September and December. ECB policy makers have been cautious and the rate statement reiterated that the ECB was “not pre-committing to a particular rate path”. ECB officials have stressed that inflation remains high and wage growth, which is feeding services inflation, needs to come down in order for the ECB to feel confident in lowering rates further.
In the US, Fedspeak will be in focus, with five public appearances from FOMC members before the week is over. Investors will be hoping to get some insights on Fed rate policy, with the markets widely expecting a rate cut in September.
EUR/USD is testing support at 1.0928. Below, there is support at 1.0907
1.0960 and 1.0981 are the next resistance lines

GBPUSD H8 - Sell SignalGBPUSD H8
Converse to AUDUSD analysis above. We also have the likes of GBPUSD here in front of us, where we have seen a rejection from 1.28500 price, a half number acting as resistance. If we look to the left on this chart, on June 12, you'll notice and aggressive selloff. This formed an attractive area of supply.
We have a few confluence in and around this 1.28500 price, so it's certainly a zone to keep an eye on for USD strength resumption. A double top on 1.28500 could be a great sell signal.

BTC USD: TRAPS ARE EMINENT~! BUT NOT WITH US!!!BTC USDT
Bullish Sentiment
a. BULLISH Back to 67.7K to get out (LAST CHANCE BEFORE WE KISS NEUTRAL AND GREED METER GOODBYE)
b. BULLISH to repect MA and Trendline retracement.
c. Shortterm Bullish to BULL trap and feed bears!
Bearish Sentiment
a. MStrat just bought; money for sharks and scalpers.
b. Increasing interest to short the market due to inflated balloon of longs.
c. Sharp knife drop eminent once we receive a capitulating news somewhere 66 67 and 68k at least
d. This knife drop will give you 3 candles signal in 1D tf. and a clear patterns in 4hr down to 15hr tf.
e. It will fail to reclaim a higher price than 68.8k body close. 69K is too funny to reclaim especially with a strong candle close in weekly. No one can predict that if that happens.
media.discordapp.net

Economic Indicators and DXY: Navigating CPI and FOMCHello Traders,
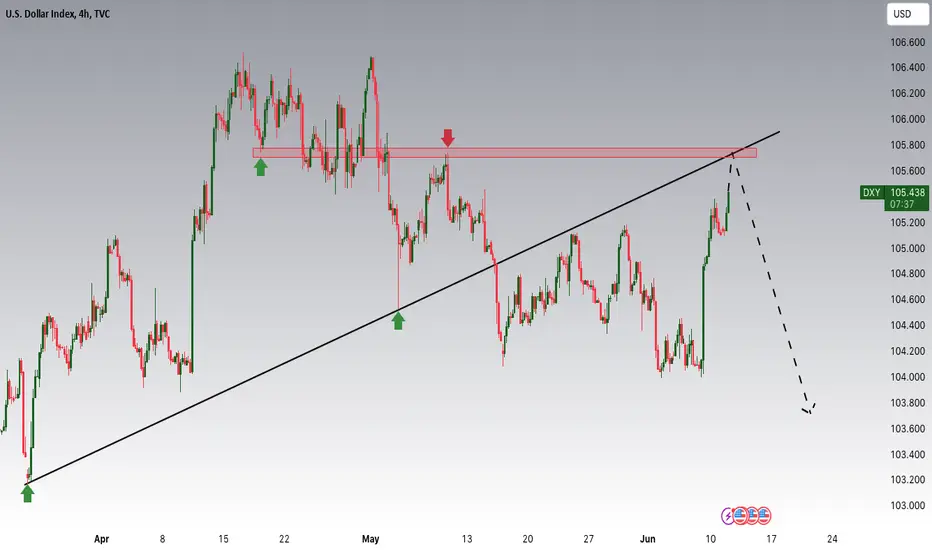
In today's trading session, we are closely monitoring the DXY for a potential selling opportunity around the 105.700 zone. The DXY had been trading in an uptrend but recently managed to break out of this trend. Currently, it is in a correction phase, approaching the key retrace area at the 105.700 support and resistance zone. This level is crucial as it has historically acted as a pivot point for price action.
However, it is essential to consider the broader economic context, particularly with two major events on the horizon: the release of the US CPI (Consumer Price Index) data and the FOMC (Federal Open Market Committee) meeting, both scheduled for tomorrow.
The CPI data will be a critical indicator of inflationary pressures within the US economy. A higher-than-expected CPI reading (a hot CPI) would indicate rising inflation, which could prompt the Federal Reserve to adopt a more hawkish stance. This would likely involve tightening monetary policy further, potentially leading to a stronger US dollar. In this scenario, we would reconsider and likely cancel our short position on the DXY, as a stronger dollar would work against the trade setup.
On the other hand, if the CPI data comes in softer than expected, indicating lower inflationary pressures, the Federal Reserve may lean towards a more dovish stance. This dovish outlook could involve maintaining or even easing current monetary policies, which would likely weaken the US dollar. A weaker dollar would support our bearish view on the DXY, making the 105.700 zone a favorable entry point for short positions.
Additionally, last week's Non-Farm Payroll (NFP) report also showed robust employment numbers, adding another layer of complexity to the Fed's decision-making process. The interplay between strong employment data and CPI readings will be crucial in shaping market expectations and the Fed's policy trajectory.
In summary, while we are looking at the 105.700 zone as a potential selling point for the DXY, it is imperative to stay alert to the upcoming CPI and FOMC announcements. These events will provide significant insights into the US economic outlook and the Fed's policy direction, both of which are pivotal for our trading strategy.
Trade safely,
Joe
Gold is appHey Traders, in today's trading session, we are monitoring XAUUSD for a buying opportunity around the 2315 zone. Gold is trading in an uptrend and is currently in a correction phase, approaching the trendline at the 2315 support and resistance area. Fundamentally, today's CPI data was soft, coming in below expectations with both core and headline inflation at 3.3% for May versus the expected 3.4%. This weaker-than-expected inflation data could prompt the Federal Reserve to adopt a more dovish stance, potentially weakening the dollar. Due to the negative correlation between gold and the dollar, a weaker dollar could push gold prices higher, making this an attractive buying opportunity.

BTC DAILY: Inflation rates, CPI and FOMC todayBitcoin cleared nearest liquidity pool under ~66155 and closed above that level which might be a swing failure - bullish pattern. But too early to confirm that.
Target for that bounce is May VAH zone + year VWAP VAH around 69.2k (for the wicks). These are conservative targets that assume rejection and pull back to 67600 at least with further consolidation.
Today CPI and Inflation rates at 12.30 UTC and FOMC at 18 UTC time. That always cause extra volatility. As I wrote before, there was no correlation with global markets in this crypto dump. Stocks actually performed pretty well yesterday. And Dollar Index so far follows the drawn path I've shared two days ago. So I don't see any sufficient bearish pressure on BTC outside of crypto world.
Bullish scenario comes into play if BTC find acceptance above year VWAP VAH.
Nearest liquidity pools:
above - 68256 / 68840 / 70400 / 72240
below - 66905 / 65760 / 64233 / 59960
Lines on the chart:
🔸73881 - ATH
🔸71363 - March close
🔸70393 - last W VAH
🔸69667 - week close
🔸68540 - last week close
🔸67577 - May close
🔸66239 - week close
🔸64025 - last April week close
Trend: D ▶️ W 🔼 M 🔼
🤑 F&G: 72 < 74 < 72 < 75 < 72

Levels discussed on livestream 13th June13th June
DXY: Could retrace, needs to stay above 104.60. If price breaks above 105, could retest resistance at 105.45
NZDUSD: Sell 0.6150 SL 20 TP 50
AUDUSD: Sell 0.6635 SL 20 TP 55
USDJPY: Look for reaction at 158 resistance
Buy 158.20 SL 30 TP 115 or Sell 157.80 SL 30 TP 125
GBPUSD: Retrace and reject resistance
Sell 1.2810 SL 20 TP 55
EURUSD: Sell 1.0880 SL 20 TP 80
USDCHF: Sell 0.8935 SL 15 TP 40
USDCAD: No setup for now
Gold: look for break of 2307 to trade lower to 2280 support

Bullish DXY (Post FOMC Analysis 13th June)The DXY spiked higher from the 104.20 price level to 104.60 during the release of the FOMC interest rate decision and the press conference.
The move higher has continued through the Asia session with the DXY now approaching the 105-round number level (around the 50% Fibonacci retracement level from the move yesterday)
This bullish move in the DXY is likely due to the FOMC adopting a conservative undertone during the news release.
Conservative due to
- "We don't see ourselves as having the confidence that would warrant policy loosening at this time"
- "We need further confidence, more good inflation readings but won't be specific about how many to start rate cuts"
- Indicating the potential of only 1 rate cut decision to come for the 2nd half of the year
- "Rate cuts that might have taken place this year, take place next year"
If the economy progresses along its current path, the FOMC dot plot suggests that terminal rates for 2024 is likely to be 5.1%.
Adopting a conservative stance on rates for 2024 (which could be offset by a more aggressive rate decision in 2025, 4 cuts expected) is bullish for the DXY as it indicates that rates could remain high for longer.
Look for the DXY to continue climbing to the upside, toward the immediate resistance level of 105.60 (which coincides with the 61.8% Fibonacci retracement level from the longer term)
Beyond 105.60, the DXY could retest the high from April at 106.40

Gold levels heading into US CPI, FOMCGold managed to rose for a second day after Friday's strong NFP selloff, but bulls clearly lack conviction looking at the small bullish candles on the daily chart. This has allowed a retracement channel to form on the 1-hour chart, which suggests momentum could eventually turn lower.
With US CPI potentially coming in hot and the Fed pushing back on cuts, it could be a game of two halves which could send gold initially higher before rolling over. The weekly pivot point around 2322 and high-volume node / upper 1-day implied volatility band around 2332 make likely targets for bulls, or areas for bears to consider fading into.
Of course, be on guard for explosive volatility around these events, as volatility can cut both ways.

SPY POST FOMC ANALYSIS!I hope you guys enjoyed the video; if you have any questions or comments feel free to comment down below!

Volatility strikes USD/JPY within rangeThe whipsaws for the US dollar around US CPI and the FOMC meeting made its mark on USD/JPY, which closed the day with a large hanging man candle beneath the May high. Markets are still deciding whether to pay closer attention to softer inflation data or the Fed's relatively hawkish meeting, and that likely means confusing price action on USD pairs.
The 1-hour chart shows strong volume accompanying the rally from Wednesday's low, which suggests another crack at breaking above the week's high. But with plenty of resistance overhead, bears may be tempted to fade into rallies on hopes of driving the pair back to the range lows around 155.

ETH - Bow and Arrow Trade!Hello TradingView Family / Fellow Traders. This is Richard, also known as theSignalyst.
📈 ETH has been overall bullish, trading above the rising trendline marked in blue.
After rejecting the $4,000 - $4,100 resistance zone, ETH is undergoing a correction phase and it is currently hovering around the $3,500 round number.
If the $3,500 is broken downward, a deeper bearish correction towards the $3,100 demand zone would be expected.
🏹 The highlighted blue circle is a strong area to look for trend-following buy setups as it is the intersection of the green demand zone and blue trendline acting as a non-horizontal support.
📚 As per my trading style:
As ETH approaches the blue circle zone, I will be looking for bullish reversal setups (like a double bottom pattern, trendline break , and so on...)
📚 Always follow your trading plan regarding entry, risk management, and trade management.
Good luck!
All Strategies Are Good; If Managed Properly!
~Rich

THE KOG REPORT - CPI/FOMCTHE KOG REPORT – CPI/FOMC
This is our view for CPI/FOMC, please do your own research and analysis to make an informed decision on the markets. It is not recommended you try to trade the event if you have less than 6 months trading experience and have a trusted risk strategy in place. The markets are extremely volatile, and these events can cause aggressive swings in price.
In all honesty, we would prefer to let them move the markets today into the level they want, then look for a set up to get in on the retracement tomorrow. At the moment, due to CPI and FOMC being on the same day, it’s likely to be an extremely aggressive move. We’re going to put the KOG Report plan to one side for now, as the whipsaw can cause spikes and key levels turn to extreme levels and we’ve taken what we needed on gold for now.
We have the range formed now and accumulation under way with sentiment standing at neutral. We have key level support below at the 2303-5 region, which if tapped could give a bounce upside, unless broken into the first key level 2335 which was on the KOG Report and then the extension of the move into the 2347-55 region. This is where there may be an opportunity to long into, or, on the flip capture the move downside into the immediate support levels, potentially even lower!
If you look at the illustration on the chart with path, we have highlighted the extreme level above sitting at 2385-90, this for us is on the break and would be ideal. If they take it there, this is the level we want to watch and is sticking out to us as a potential curveball, so please be careful!
On the flip, they take this down, we’ll sit back and wait, shorting with volume is a bad idea as the intermediate swings can go against you. So, we’ve highlighted the key levels below that have potential for a reaction in price.
We’ve put this report together this time to show you what the market can be capable of if they really want to move it. The circles are our hotspots, together with our targets they will help us navigate the move. They will want to slip new traders up and get them trading with the candles, this is a recipe for disaster, on days like this quick money trades are not an option. It’s either above or below for us on this occasion, otherwise we’ll come back to gold tomorrow and make our move.
Please do support us by hitting the like button, leaving a comment, and giving us a follow. We’ve been doing this for a long time now providing traders with in-depth free analysis on Gold, so your likes and comments are very much appreciated.
As always, trade safe.
KOG

BTCUSD to reclaim highs and more?Highlighting the inverse relationship between the DXY (yellow line) and the BTCUSD.
Potential weakness on the DXY tonight could see the BTCUSD continue its bounce from the support level of 66,000 (also formed by the 38.2% Fibonacci retracement level from the longer term) up toward the previous high of 72,000.
If the price breaks above the resistance level, significant upside could be anticipated with the next target profit level around the 74,500 area

GBPUSD H4 (Prior to US CPI & FOMC)Considering the scenario that the CPI data is released higher and/or the FOMC presents a hawkish tone, this would mean that the US interest rates could stay high for longer.
This would bring significant strength to the DXY which could see massive downside for the GBPUSD.
However, the GBPUSD has developed a strong support along the 1.27 price level, formed by several swing points and the 23.60% Fibonacci retracement level.
In DXY strength, look for the GBPUSD to break the bullish trend line and the support level before anticipating further downside toward the 61.8% Fibonacci retracement level and support area of 1.25

EURUSD H4 (Prior to US CPI & FOMC)The EURUSD has found support along the 1.0720 price level (with the 61.8% Fibonacci retracement level and the bullish trendline forming a confluence)
If the DXY does weaken with the news tonight, the EURUSD could bounce strongly from the support level to trade higher toward the resistance level of 1.09 (moving similarly to the price action on the 9th of May)
A trigger level for further upside potential would be a break of the 23.6% Fibonacci retracement level.
