There will be alot of opportunityHi guys, I was busy doin other things that i missed this trade on 15 min chart.. but i take it simply a miss trade. Also a forming another opportunity is waiting to trade after a pullback will finish. Hoping ill be ready to take an opportunity to present
Fomo

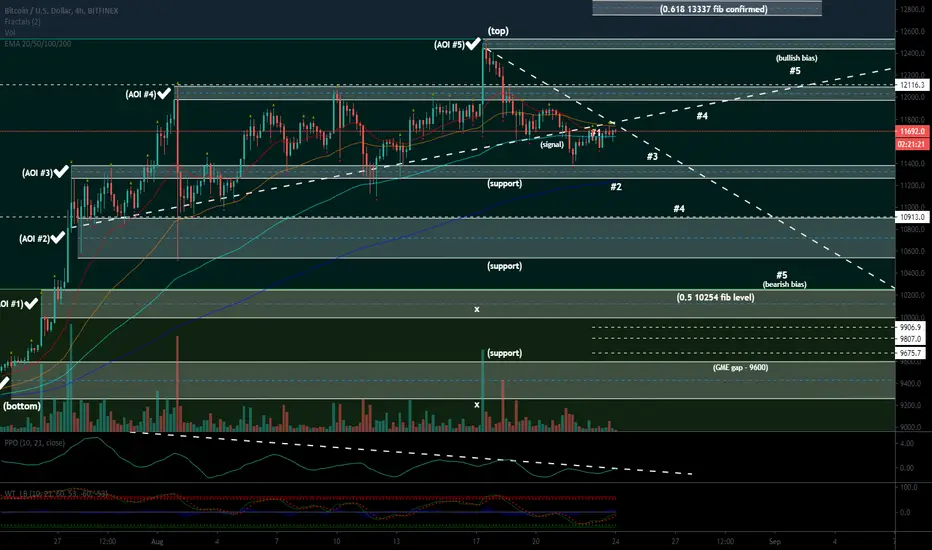
12,000 BY SEPTEMBER 3RD (bullish pennant) - 2 validation ticks Good evening -Yurlo (Please smash that like button) 👍
2 hours and 30 minutes until today's daily close (8PM est)
Expecting scam wicks/pumps over the weekend, CME gap will be opening and closing this weekend (always good to factor in with price action)
This is the 6 hour chart - & an inside look on my last technical analysis post (the monthly chart - which can take a few weeks to start trending)
Remember - stick to your trading plan, be smart about your trades, be consistent, be disciplined and most of all have fun!
Cheers.

(AOI #3 RETEST) - UPTREND INVALIDATED - 11250 - 11400 INCOMING?I'd expect to see (AOI #3) before finding a REAL floor, or even (AOI #2).
It depends on how price action reacts below 11500.
Bulls need to impulse up or we're going down to goblin town for a visit.
Goblins need loving too, plus it gives you the perfect "BUY THE DIP" opportunity.
Always be ready & stay patient waiting for those big moves.
Don't force the market, this will enable your mind to force positions which will force your account to be liquidated.
Let the market come to you, and wait for the signals your TA provides.
A NEW WEEK IS UPON US, BE READY FOR BOTH SIDES. (earlier this week we might find a bottom followed by later in the week pushing past these levels if we do reject.
FOMO is real and very very dangerous, the market has cycles and you won't miss out. There will ALWAYS be another opportunity somewhere and you need to understand this.
STICK TO YOUR TA.
I love you all.
August 22 Market Update | Technical, Fundamental, NewsDescription:
An analysis for the week ahead.
Points of Interest:
Minimal Excess; Non-Separation Of Value; Untested POCs; Gaps
Technical:
Broad-market equity indices ended the week mixed with the S&P 500 recovering its all-time high on relative strength from the technology sector.
Recapping last week’s action, Monday’s higher open on earnings and stimulus talks was followed by a balanced, low-volume session which migrated value to the top of prior balance. The market caught up to Monday’s delta, edging higher overnight on better than expected retail earnings, before liquidating, making a V-shape recovery, and resolving some resting liquidity at and above the $3,390 area.
On Wednesday, after the Federal Reserve signaled signs of a difficult recovery, the market left value behind on a spike which repaired some weak structure in the $3,350 region. Responsive buyers quashed Wednesday’s weak-handed initiative activity, driving prices higher into Friday’s monthly options expiration, albeit with minimal participation from the broader market.
Overall, the week ended in balance, again. In light of dull participation and poor structure on both sides of the market, attention has to be shifted to other stimuli, such as the cessation of trend in heavily weighted index constituents and decreased dealer hedging flows, among other things.
If momentum was to grow faint, there’s the potential for a fast-moving correction of the poor structure left behind by the recent anxiety-driven activity. Still, the path of least resistance is up.
Scroll to bottom of document for non-profile charts.
Key Events:
GDP Estimate; Initial Claims; Consumer Spending; Core PCE Price Index; University Of Michigan Sentiment; Conference Board Consumer Confidence Index; New Home Sales; Jackson Hole.
Fundamental:
Trading improves as China leads upswing; virus resurgence may delay negotiations. bit.ly
Urban markets will recover after pandemic as Americans’ housing decisions evolve. bit.ly
The ECB has signaled September to be a key month to read the economic recovery. bloom.bg
China: Virus under control, V-shape recovery and strong demand, politics to worsen. bit.ly
Majority of fund managers pulled out of LQD even after the Fed announced support. bloom.bg AMEX:LQD
COVID-19 coronavirus drop in fuel demand to weaken credit metrics through 2022. bit.ly
Fearing shipping crunch, retailers have initiated the earliest-ever holiday sales plans. reut.rs AMEX:XLY
Despite recovery, economists suggest an unemployment tsunami maybe coming. bit.ly
The peak leisure travel season is ending, and so might airlines’ modest recovery. bit.ly AMEX:JETS
American Airlines Group (NYSE: AAL) attracts shorts on suspension of flights. bit.ly
Wells Fargo & Co (NYSE: WFC) resumed job cuts, in-line with cost-cutting plans. reut.rs
Deere & Co (NYSE: DE) shares hit ATH after company lifted its full-year forecast. reut.rs
3 new U.S. stock exchanges are set to launch by the end of this September. reut.rs
Facebook Inc (NASDAQ: FB) weighs the kill switch for political ads after elections. reut.rs
Canada June retail sales rose by a record 23.7%, rising above pre-pandemic levels. reut.rs
Investor concern over Democratic win and tax increases valid, but overdone. mgstn.ly
Eurozone money supply surge will not spark inflation in the near term. bit.ly
U.S. dollar loses value and influence as debt rises, tax consequences uncertain. bit.ly TVC:DXY
Stimulus has largely been offset by a decrease in the volume of transactions. bit.ly
As homebuilder confidence matches record high, mortgage delinquencies rise. refini.tv
Rising value of gold is evidence that the U.S. could be debasing its currency. bit.ly
Detailed analysis on global venture funding during the coronavirus pandemic. bit.ly
Asset managers at major U.S. investment firms encourage stock buying. bit.ly
Workers win on Uber Technologies Inc (NYSE: UBER), Lyft Inc (NASDAQ: LYFT). reut.rs
Johnson & Johnson (NYSE: JNJ) to test coronavirus vaccine in 60,000 volunteers. reut.rs
Delay in fiscal support is negative for the US economy and consumer facing sectors. bit.ly
Target Corporation (NYSE: TGT) hit sales record on the online shopping surge. reut.rs
Market rally has more to do with asset inflation, which is fueled by liquidity support. bit.ly
Corporations will assume the burden of safety, rising costs and lowering capacity. bit.ly
People ready to start their household growing again, builders are playing catch up. bloom.bg
General Motors Company (NYSE: GM) bets on electric Cadillacs, micro vans. reut.rs
Southwest Airlines Co (NYSE: LUV) expects slower cash burn as bookings improve. reut.rs
Fed policymakers see more easing ahead to help brace economy, sustain recovery. reut.rs
OPEC+ pressed oil nations pumping above targets to cut more in August-September. reut.rs
Lowe’s Companies Inc (NYSE: LOW) beats sales expectations on spending surge. reut.rs
NY Fed’s index of real-time economic data showed a significant rise in its first revision. bit.ly
Inflation is happening in the basket of goods that excludes food, fuel and housing. bloom.bg
Analysis confirms the picture of rising income inequality and slowing income growth. brook.gs
Sentiment: 30.4% Bullish, 27.2% Neutral, 42.4% Bearish as of 8/19/2020. bit.ly
Gamma Exposure: (Trending Lower) 3,109,556,133 as of 8/21/2020. bit.ly
Dark Pool Index: (Trending Lower) 42% as of 8/21/2020. bit.ly
Product Snapshot:
S&P 500 (ES): AMEX:SPY SPCFD:SPX
Nasdaq 100 (NQ): NASDAQ:QQQ TVC:NDX
Russell 2000 (RTY): AMEX:IWM TVC:RUT
Gold (GC): AMEX:GLD AMEX:GDX TVC:GOLD
Crude Oil (CL): AMEX:USO AMEX:DBO AMEX:USO TVC:USOIL
Treasury Bonds (ZB): NASDAQ:TLT
Disclaimer:
This is a page where I look to share knowledge and keep track of trades. If questions, concerns, or suggestions, feel free to comment. I think everyone can improve, especially me.
In no way should this post be construed as investment advice.


Psychology of OTHER People in the Market Matters More Than YoursMorning Traders - The next in our series of education posts is going to focus solely on Psychology. specifically regarding the psychology of OTHER people in the market. Once you nail this topic its going to give you a huge edge on the market.
Any trader is always looking whether the next few price swings are going to be bullish or are they going to be bearish? That is the essence of trading - If you know the next few price swings are going to be bullish then it makes it easy to make money right?!
Once you have this identified then you simply just need to time your entry, the safest way to do that would be to be watching for a short term pullback against your bias of where the price swings will be headed. Its important that when looking at these price swings, you watch HOW the price moves, don't need to concern yourself with any chart patterns or candlesticks, but ask yourself as you watch the price move, is the price moving with strength or weakness? If price is pulling back from your bias with weakness then this is an opportunity to place your entries and wait for the price swings you have anticipated. If price pulls bask with strength then it could be time to consider you bias again and stay on the sidelines.
The real key when analysing price action both in the long term price swings you see and in each movement within those price swings is the psychology of everybody else that is trading in that market with you. Much has been written and spoken about regarding making sure you own mindset and psychology is right within trading but I personally feel understanding how other people are feeling within the market is worth so much more. Once you understand how other people are feeling, their emotions etc then its becomes easier you predict their actions.
One of the most powerful emotions we feel that affects our decision making is fear. Im sure everyone can easily anticipate the actions of a fearful person, so we just need to translate that into the chart.
So start watching where are people getting trapped into bad positions? When are they feeling fearful that they made the wrong trade? When are they praying for the market to turn around? These are the traders you want to target because by their nature these are weak traders and likely unprofitable ones, you want to watch for points in the market where these traders know they have got it wrong.. So you should be looking to take the other side of their trades and profit from their mistakes.
The other major aspect of fear you should look for in markets is FOMO. Fear of Missing Out. You see this type of emotion ALL the time in markets, its essentially the market equivalent as when you see people run for the tube / underground as the warning beeps have started and doors are closing... People who have been sat watching the market for a while suddenly see it moving in one direction and start running to enter the trade as quickly as they can... the psychology of this is that they will likely enter with the wrong position size, they haven't analysed the new market conditions that were different from when they were watching the market before, and most importantly their risk management has now gotten out of control. When you see after an already strong price movement that it starts to slow down momentarily and then rockets again in the same original direction - This is typical of FOMO trading. Its wise when you see this to start thinking about places some trades opposite to these traders.
So when people say you should analyse price action - this is the most powerful way to do that. Its not about head and shoulders patterns, its not about doji candles or anything else you hear spoken about... Its simply about human emotions and how they are expressed within the charts.
To be successful you need to start identifying the moments and points in the chart where you know people will buy after you have already brought, or where they will sell after you have already sold.

CHAINLINK DROPS- RECOVERY IN SIGHT? Quick correction. Linkies on sale. Then Shooting up. Dyor. $25-$35 EOM. IMO****

Best Way to Trade a Bull Stock MarketStocks are flirting with ATH's in a complete departure from a reality where unemployment is right around where it was in the great depression. Praise be to the Fed and their magic papers. The Kovach OBV is confirming the bull trend. We are seeing some red triangles in the Kovach Reversals indicator, confirming resistance, however. The fact that the S&P should break out from these levels is undeniable, but the question is if we will see a retracement first. We would prefer to error on the side of caution and not honey badger our way into a trade. Keep your eye on 3396 and 3390 for a rejection or breakout. The level 3357 would be a good place to buy back if it retraces.

1st attempt (rejection) 2nd attempt (ranging) 3rd attempt (moon)Good afternoon -Yurlo (smash that like button if you enjoy the charts I post daily for you guys) 👍
Here's the analysis for the day.
Not much has changed from yesterday (ranging between (11600 - 12000) - The range has been getting tighter in favour of bulls over the weekend (going into weekly close)
Today could moon very hard and i wouldn't want to miss out considering we've only tease a teaser of what the next bull run will feel like.
Get ready for some wild times boys, it's close.
Enjoy your day. (daily close in just over 5 hours)
Once we break 12.1k we're going straight to 12.5k.
Should be a GOOD FUCKING WEEK AHEAD.

WARNING TO GOLD PERMABULLS!Yep - I missed the parabolic pump and I'm sooo happy!
There could be trouble ahead. Gamblers late in the game go right ahead!
Those gamblers who made their killing could be getting out. You never know.
Disclaimers : This is not advice or encouragement to trade securities. No predictions and no guarantees supplied or implied. Heavy losses can be expected. Any previous advantageous performance shown in other scenarios, is not indicative of future performance. If you make decisions based on opinion expressed here or on my profile and you lose your money, or miss opportunity, kindly sue yourself.

Fast Market Moves And FOMO - Don't Get TrappedWhen the market moves strongly in a direction, you might feel the need to jump in and chase the trade because of the Fear Of Missing Out (FOMO).
Don't do that.
In fact, if you spend some time looking at the charts, you will find that often with such sharp fast market moves, the potential for a trade in the same direction as the fast move is over by the time people start reacting out of fear of missing out. This is when trades get squeezed and people lose money fast.
When you listen to experienced traders talk about such fast moves, you will often hear comments like "Wow, XYZ has rocketed up, but it's too late to enter now, I'll rather wait for a good pull back and see if there is an opportunity to enter later". You might actually hear them say that the move has gone too far from the moving average (maybe the 9 EMA or even 20 EMA) and that it's more likely that it will cause a "rubber band" effect with the price action moving back closer to the average.
The market may continue to rocket up or down, but let it go, don't chase that move, wait for your turn to get a good entry spot.
This is true no matter what you trade, Forex, Crypto, Stocks or Commodities, they all exhibit this tendency to recover (often quickly) when the price has suddenly moved too far from the average price. New traders are often caught off-guard by this, and tend to jump into the trade exactly when others are exiting their positions, so don't give in to FOMO. The market will give you many trading opportunities during the day, be patient and don't trade out of fear or greed.


Gold (XAU/USD) Monthly Candlesticks & Ichimoku ChartWe started the month with the Silver chart and we will end the month with the Gold chart. With this strong break through the previous all-time high, the FOMO that will soon grip the market will be yet another driving force that will push the price ever higher. Money printing that never stops is the dominant force for prices to continue higher into the stratosphere.
Gold has broken thru all-time highs of 1920–21 recorded in 2011 easily. This cycle of incessant money printing will lift it much higher than before. 2,700 is the target based on the monthly chart.

When Will The Creep Organization Run Out Of Pump?Monster sized gains since march this one has been on a massive run over 600% in gains!
Once this one shifts red I'm taking my shot at it.
Lots of bad rep in the media been going viral on all social media outlets.
🤔🤔🤔
Google trends popping off for wayfair currently.

Fomo or Market manipulation?The price seems to be manipulated by exchanges or behind-the-scenes hands
However, be very careful about the positions you open up

BITCOIN'S $1000 ROCKET 🚀Support by following and liking this idea :) 'Experts' would charge you hundreds for this insight.
The most ultimate Bitcoin setup has been underway since $10.5K. It's human nature to want price to drop FAST but naturally, it's just not the way that price action works. This is actually great for some people, it gives you time to adjust, do your due diligence and move in the direction of defined momentum.
Bitcoin has recently defined is intended direction recently after multiple failures in the $9300 range. Initially spiking up to $9330 before catching a $100 spike down south, price ended up recovering from the $9160 range ($9160-$9330). Nearly a $200 'rocket'. Not bad huh? The only problem is that bulls have used their energy only to get denied at the same area.
It may be slow, it may be choppy but value is headed south. The Bullish Exit Route that I've outlined pushes all the way down to $8719. $8900 also looks like a good area for a possible bounce and I do anticipate a quick jump up but only to get denied again near $9150. From here we should continue to push down toward $8719 and likely form a double bottom here.
The $1000 FOMO Rocket from $8700 to $9777 will ring off bells and whistles for bulls that are eager (and delusional). What else could 777 indicate, right? JACKPOT (for markets anyway).
I expect price action to be slow, stagnant and lingering as bulls that are late continue to load up their longs. When the momentum gasses out and price does drop, it should be quick and painful. I do have a wild imagination I guess.

IMPORTANT Chainlink mindblowing parabolic moveChainlink is unquestionably the most important project in crypto right now. More important then even bitcoin in it's world changing significance. Chainlink is like the invention of the internet, it will herald the 4th industrial revolution and will automate industries that people once thought were safe from automation.
Expect major fud to be released by the chinese and the jews who want to suppress the price and buy up the cheap linkies.
Never sell a link and if you want to be one of the new elites have 10000 Chainlink tokens whilst it is still possible to obtain such a amount.
1000 Chainlink tokens is the minimum for a suicide stack, anyless and you will probably feel pain everyday knowing that you missed your one and only chance to make it.
Never sell a link.

That is why you do not go FOMO mode on cryptocurrencies Hello, traders.
See how to identify overbought charts with Bollinger bands indicator.
Bollinger bands consist of three lines that plotted in the chart. The line in the middle is usually a simple moving average configured for a period of 20, typically default for Tradingview.
The up and the low Bands are defined at two standard deviations away from the central MA.
Whenever the price is away of the standard deviation of the Bollinger bands, up is a sign of overbought rate and down is a sign of oversold,
Take care to get into assets outside the top and bottom bands.
Note, RSI above 80 is a good indicator showing overbought signals; combining these two indicators can make you do not enter FOMO in some assets.

ONTX About to fly watch money inflow and volume** (First real analysis sharing with people, open to all criticism and other ideas to bounce back and forth)
Watch morning pop then drop to .382 fib (a,b,c pattern to next resistance) $.81 and big gap up from vwap
(resistance top of previous cancel but after bull flag and big vwap bounce itll bust straight through i think*
Next resistance 1.07$ level... Drip too $1.02
next levels to watch ....
1.65$ ( This may be a big fomo play when this goes watch it to go parabolic)
then next levels to watch 1.9952
2.1700
After this broke trend and watch for steady bullish trend

LINK - Enough with the FOMOMain reason for this extreme pump is FOMO
Now the price is extremely overbought on rsi both on weekly and daily - very bearish
We saw what a overbought signal on weekly did to the crypto market
Massive retest is possible therefore I am short for the meantime until the market cools down
So,
targets 7.6, 7.5, 7.4, 6
entry 7.8
sl 8.2
leverage x5-10

#NEO 31 December NEO 3.0 Short Term SETUP CUP-HANDLEThere's More Time But Earns Early Space.
Short Term Target 8%

BTCUSD: BITCOIN FOMO PUMPBitcoin Bulls have regained momentum at a very crucial moment.
$9900 must be checked.
Don't FOMO, just trade.

REQ/BTC Tell me what I should do?I bought into this coin when its trading at 0.000025 and has just taken profit today at 0.000050. I am having a serious case of FOMO ing given that I believe its alt coin season and there are more upside potential in a few interesting great projects. I want to get back into it and what level do you think I should? I have placed an order at 0.0000038. The reason why I took profit at0.0000050 is because I think that was a good resistance ahead of 0.000052 and should see some form of retracement lower first before trading higher again. A massive spike up cannot sustain very long without retracement and I do think retracement is healthy for bull market.
Tell me!
