SOLUSDT📊 #SOLUSDT
⏱ TIME: 1D
⭕️risk: mid
📍The initial buying market: 168-169
📌TP1: 192$
📌TP2: 224$
⛔️SL: 144$
❌These analyzes are just to give a better perspective for you dear ones
Do not base on buying and selling❌
Forcast

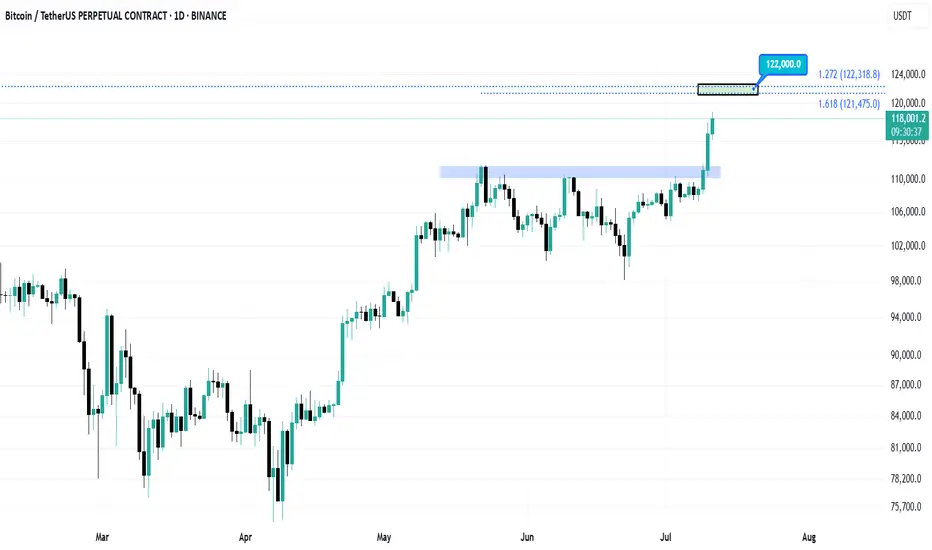
BitcoinThe next target for Bitcoin is $122,000.
I will update the chart when this target is reached.
Follow so you don't miss the next analysis.
AUD/USD Trade Zone!Firstly, we are in a news market right now and news is everything to understanding price action.
After a busy international weekend, AUD/USD opened strong to the sell side. We got the first initial push down last week when Iran attacked Israel. Then, this weekend, Trump struck Iran.
With Trump striking Iran, markets opened bearish initially. After the good news of Iran and Israel coming to peace, we are seeing markets start to rebound a bit.
Where we are currently in the markets is a good structural spot to make some moves. The market has been following a downtrend structure following the Lower-Low, Lower-High pattern and we are currently at the next lower high if the market is going to respect its current market structure.
I am preparing for sells in an overbought market, which is unsure of future international tensions. I am either waiting for a structure break where the gold line indicates or for the market to respect the current structure to play to the low side.
I will be back with future updates.

BTCUSD: Growth & Bullish Continuation
Remember that we can not, and should not impose our will on the market but rather listen to its whims and make profit by following it. And thus shall be done today on the BTCUSDpair which is likely to be pushed up by the bulls so we will buy!
Disclosure: I am part of Trade Nation's Influencer program and receive a monthly fee for using their TradingView charts in my analysis.
❤️ Please, support our work with like & comment! ❤️

AUDJPY: Price Action & Swing Analysis
The analysis of the AUDJPY chart clearly shows us that the pair is finally about to tank due to the rising pressure from the sellers.
Disclosure: I am part of Trade Nation's Influencer program and receive a monthly fee for using their TradingView charts in my analysis.
❤️ Please, support our work with like & comment! ❤️

GBPJPY: Will Start Falling! Here is Why:
The charts are full of distraction, disturbance and are a graveyard of fear and greed which shall not cloud our judgement on the current state of affairs in the GBPJPY pair price action which suggests a high likelihood of a coming move down.
❤️ Please, support our work with like & comment! ❤️

COPPER📊 #COPPER
⏱ TIME: 30M
📝You can enter this position by breaking the ceiling and trendline and consolidating above this.
⭕️risk: MID
📍buy stop: 4.18600
📌TP1: 4.23500 (free)
📌TP2: 4.29000
⛔️SL: 4.13300

BITCOIN📝 Important ranges for this week have been drawn, you can trade them according to your personal strategy.
⏱ TIME:15M
📍If you like this kind of content, please leave a comment❤️

ETHUSDT📝 Important ranges for this week have been drawn, you can trade them according to your personal strategy.
⏱ TIME:15M
📍If you like this kind of content, please leave a comment❤️

DXY📝 Important ranges for this week have been drawn, you can trade them according to your personal strategy.
⏱ TIME:30M
📍If you like this kind of content, please leave a comment❤️

GOLD📝 Important ranges for this week have been drawn, you can trade them according to your personal strategy.
⏱ TIME:15M
📍If you like this kind of content, please leave a comment❤️

XAG (SILVER)📝 Important ranges for this week have been drawn, you can trade them according to your personal strategy.
⏱ TIME:15M
📍If you like this kind of content, please leave a comment❤️

EURUSD📝 Important ranges for this week have been drawn, you can trade them according to your personal strategy.
⏱ TIME:30M
📍If you like this kind of content, please leave a comment❤️

DOWJONS US30📝 Important ranges for this week have been drawn, you can trade them according to your personal strategy.
⏱ TIME:30M
📍If you like this kind of content, please leave a comment❤️

NASDAQ US100📝 Important ranges for this week have been drawn, you can trade them according to your personal strategy.
⏱ TIME:15M
📍If you like this kind of content, please leave a comment

WTI OIL📝 Important ranges for this week have been drawn, you can trade them according to your personal strategy.
⏱ TIME:15M
📍If you like this kind of content, please leave a comment

USDCAD: Bears Will Push Lower
Our strategy, polished by years of trial and error has helped us identify what seems to be a great trading opportunity and we are here to share it with you as the time is ripe for us to sell USDCAD.
❤️ Please, support our work with like & comment! ❤️

BITCOIN📊 #BTCUSDT
⏱ TIME: 1D
📝According to the pinned analysis at the bottom of the page (previous post), Bitcoin is currently completing its fifth wave, with its first expected resistance range around $93,000 to $95,000.
If this range is lost, the next resistance level is between $111,000 and $115,000.
If a divergence appears with the RSI indicator at these resistance levels, it could be a signal to enter a sell position.
If the price gets rejected from the specified levels, I will announce the targets and update the analysis.
If you want me to analyze another currency, comment its name. Thank you❤️

BITCOIN📊 #BTCUSDT
⏱ TIME: 1D
📝From an Elliott Wave perspective, Bitcoin has completed its fourth wave and is now in the process of completing the fifth wave. In the next post, we’ll cover Bitcoin's target levels where we expect a price correction.


WTI OIL📊 #WTIUSD
⏱ TIME: 1H
📝Important oil ranges for this week
⭕️risk: mid
📍The initial buying limit: 72$ and 69.7$
