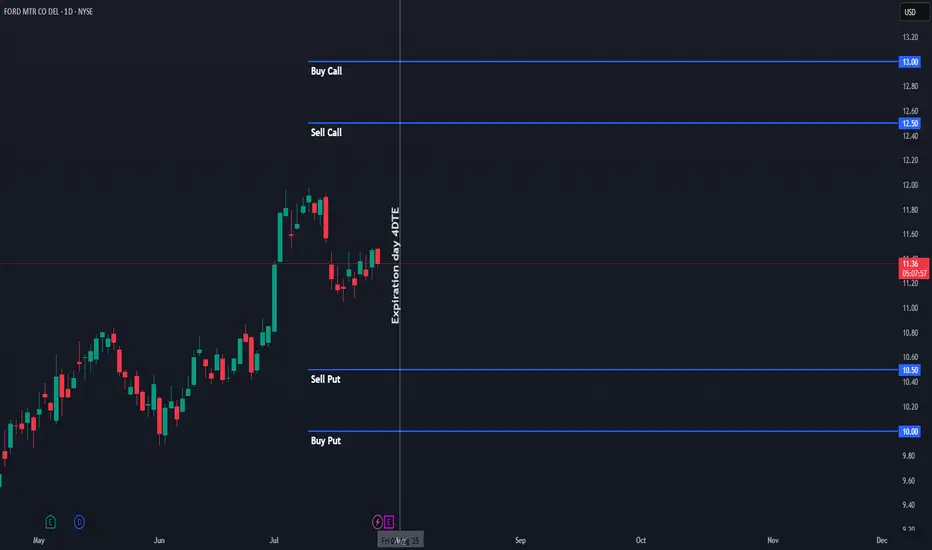
$F Iron Condor – Aug 1st Expiration | $7 Credit | I’m opening an Iron Condor on Ford ($F) with expiration on Friday, August 1st, 2025. The trade is based on the daily chart, using visible support/resistance levels to define the range. I selected strikes with approximately 0.15 delta on each side, giving the setup a high probability of success.
🔹 Total premium collected: $7 per contract
🔹 Stop loss: Defined at 50% of the premium collected (~$3.50)
🔹 Trade logic: We want $F to stay within the range throughout the week to let theta do its job.
🔹 Exit plan: If the price approaches either short strike, I will consider exiting at break-even or take a controlled loss.
This is a non-directional options strategy designed to benefit from time decay and low volatility. The setup is ideal for sideways price action, with no major catalysts expected during the week.
🎯 Target: Full profit if price stays within range until expiration.
❌ Stop: Exit if the price threatens any wing – max loss capped at 50% of the premium received.
This trade combines high probability with well-defined risk and is perfect for consistent weekly income when the market shows indecision or chop.
FORD
F 5M Long Daytrade Aggressive CounterTrend TradeAggressive CounterTrend Trade
- long impulse
- unvolumed T1
+ resistance level
+ biggest volume 2Sp-
+ weak test
+ first bullish bar below close entry
Calculated affordable stop market
T2 5M take profit
1H CounterTrend
"- long impulse
- unvolumed T1
+ resistance level"
1D CounterTrend
"- long impulse
- unvolumed T1
+ resistance level"
1M CounterTrend
"+ short impulse
- exhaustion volume
+ T2 level
+ resistance level
- unvolumed interaction bar
- reaction bar looks to close bullish in 6 days"
1Y CounterTrend
"+ long impulse
+ volumed T2 level
+ volumed 2Sp+
+ 1/2 correction
+ weak test"

F Investment 1D Conservative CounterTrend TradeConservative CounterTrend Trade
+ long impulse
- before 1/2 correction
+ expanding T2
+ support level
+ biggest volume 2Sp-
+ weak test
+ first bullish bar close entry
Calculated affordable stop limit
1 to 2 R/R take profit
Monthly CounterTrend
"- short impulse
+ 1/2 correction
- unvolumed T2
- resistance level
+ unvolumed interaction bar"
Yearly Trend
"+ long impulse
+ volumed T2 level
+ volumed 2Sp+
+ 1/2 correction
+ weak test"

Ford Stock Rises Over 5% Following Earnings ReportFord's stock gained more than 5% in the latest session after the company’s earnings were released following the close of yesterday’s trading. For now, investor confidence remains strong, as the company reported earnings of $0.14 per share, significantly beating expectations of $0.02, and revenue of $37.42 billion, above the estimated $36.21 billion.
In addition, although the company mentioned it expects tariff-related costs of $2.5 billion, it also stated it plans to offset at least $1 billion of these additional costs. This has contributed to a more optimistic outlook for the stock over the coming months, allowing bullish pressure to remain strong during the current session.
Short-Term Bullish Channel
Since early April, a steady bullish channel has been forming, pushing Ford’s stock back to the $10 per share level in the short term. At the moment, buying momentum is facing a key resistance at the 200-period simple moving average. If the price manages to break through this level, it could strengthen the current upward trend seen on the chart.
Technical Indicators:
ADX: The ADX line has started to show a consistent upward slope and is approaching the neutral 20 level. If this level is crossed, it could indicate increased volatility, which—if the current trend holds—could favor continued bullish movement.
TRIX: The TRIX line has crossed the zero level, signaling that the average strength of the moving averages has turned bullish, which may indicate growing buying momentum in the short term.
Key Levels:
$9.55 – Nearby Support: Aligns with recent zones of indecision. A move back to this level could jeopardize the current bullish formation and trigger a relevant bearish bias.
$10.30 – Current Resistance: Aligns with the 200-period simple moving average. Sustained movement above this level could extend the bullish channel currently shown on the chart.
Written by Julian Pineda, CFA – Market Analyst

May 6, 2025 - Markets Hold Their Breath Before Powell SpeaksHello everyone, it’s May 6, 2025 and markets are once again at the mercy of politics, Powell, and presidential mood swings.
After a 9-day rally, U.S. markets finally took a breather yesterday, with mild profit-taking ahead of the much-anticipated Federal Reserve decision. Investors are caught between two competing visions: Trump’s push for massive rate cuts, insisting inflation is a myth cooked up by bureaucrats, and Powell’s more sober stance acknowledging inflation isn’t dead, the economy is softening, and premature easing could trigger full-blown stagflation.
With Friday’s job report stronger than expected, Powell is expected to hold rates steady, staying cautious while tariffs and growth clouds loom. Markets are pricing in a July cut at best, but uncertainty lingers mostly around what Trump might tweet in reaction to Powell’s speech tomorrow night.
Meanwhile, despite the 90-day tariff moratorium, the trade war narrative hasn’t vanished. NYSE:F suspended its 2025 outlook, citing $1.5 billion in expected tariff costs and four major risks: disrupted supply chains, retaliatory measures, unclear tax policies, and emission rules. NASDAQ:MAT is also hedging its bets shifting production out of China and pausing forecasts, while begging for zero tariffs on toys “for the kids.” Their stocks dropped modestly after hours.
OANDA:XAUUSD surged again to $3,368, as fear and safe-haven demand ticked up. BLACKBULL:WTI rebounded to over $58 following an OPEC statement, helping airline stocks breathe a bit. BINANCE:BTCUSDT continued its meteoric rise, now sitting around $94,400.
On the macro front, inflation data like CPI and PPI are being shrugged off everyone’s waiting to see if Powell plays ball with Trump. There’s hope, too, that all this chaos is just Trump’s way of muscling the world into negotiation especially China and if a “deal” emerges, markets could rip higher. Until then, we’re stuck dancing between uncertainty and hope.
Asia opened strong this morning, led by China’s cautious optimism. Futures point slightly lower in the U.S., and volatility remains king. The Fed could flip the script tomorrow or keep us hanging. Stay buckled in.

General Motors (NYSE: $GM) Reports 17% Y0Y in Q12025 Sales General Motors (NYSE: NYSE:GM ) opened at $44.46 on April 4th, 2025, down 3.91%. The stock declined $1.80 in early trading. This came a day after Trump’s new 25% auto import tariffs took effect. In a report released on April 2nd, GM delivered 693,363 vehicles in Q1 2025, a 17% year-over-year increase. This marked the company's best Q1 since 2018. In Q1 2024, GM sold 594,233 units.
The automaker led in truck and compact SUV sales. Electric vehicle sales surged 94% to 31,887 units. GM currently remains the second-largest EV seller in the U.S, behind Tesla.
Other automakers posted mixed results. Ford's sales declined by over 5% on Thursday due to the tariffs.
GM’s growth came partly due to early consumer purchases ahead of the tariffs. Retail sales jumped in March, with buyers seeking to avoid expected price hikes.
Tariffs Threaten GM's Supply Chain
Trump’s 25% tariffs on imported vehicles started on April 3rd. According to the White House, tariffs on auto parts will begin no later than May 3.
Barclays analyst Dan Levy noted that only 52% of GM’s U.S sales in the first three quarters of 2024 came from domestic production. The rest came from plants in Mexico (30%) and other countries (18%). Levy added that GM depends on imports for models like the Equinox and Blazer. These are mostly built in South Korea and Mexico. The tariffs will likely increase production costs and squeeze margins.
Despite strong Q1 performance, GM faces near-term risks from global trade tensions and supply chain disruption.
Technical Analysis: Price at a Key Support Level.
GM stock has been retracing from its $61.24 52-week high in November 2024. It now tests a strong support level at $43, which aligns with the 78% Fibonacci retracement level. If GM bulls hold this key support level, they could trade bullish towards the $53 target resistance. The $53 high serves as a key resistance level of an internal structure high and March high.
However, a break below $43 may push the stock lower, with the next potential support at $39, which aligns with 100% retracement level.
Forecast: Watch for Breakout or Breakdown
GM's technical position is delicate. A rebound from $43 could start a continuation of the trend. But extended trade risks and import costs could drag it down further. The company’s stock has fallen over 11% year-to-date. Analysts on TipRanks rate it a Moderate Buy. The average price target is $62.17, offering a 42% surge from the current market price.
With the earnings date set to be released on Apr 29, 2025, this will provide more clarity on the overall market sentiment.

Ford (F) Share Price Drops Following Trump's TariffsFord (F) Share Price Drops Following Trump's Tariffs
President Trump has fulfilled his promise to impose tariffs on foreign car manufacturers, introducing a 25% tariff on all cars and light trucks not made in the United States, as well as on "certain auto parts."
As reported by Yahoo Finance: "This will continue to drive growth like you've never seen before," Trump stated from the White House on Wednesday while signing the tariff order. The 25% tariffs are set to take effect on 2 April, adding to existing duties. The White House announced that $100 billion in annual tariffs would be collected.
Why Have Ford (F) Shares Fallen?
Trump’s decision has led to a sharp drop in car manufacturers’ share prices, particularly in Europe. However, shares of American automakers have also declined. Ford (F) shares, according to the price chart, fell by approximately 4% yesterday.
This decline is due to the fact that Ford (as well as GM and Stellantis) has manufacturing facilities in Canada, Mexico, and China, which now means higher costs due to the impact of tariffs on supply chains.
Technical Analysis of Ford (F) Share Price Chart
As we noted when analysing Ford (F) shares on 6 March, Trump's tariff policy previously helped the price recover from a four-year low.
However, it now seems that “the pendulum has swung the other way.” Examining the price chart, we can identify three levels that actively interact with the price (some key reversals are marked with an arrow), with the middle level appearing to act as a median for the "pendulum" of market sentiment.
From this perspective, we can reasonably assume that:
→ The $10.25 level continues to act as resistance;
→ The $9.66 level, acting as a median for Ford (F) price fluctuations, may "attract" the price.
This article represents the opinion of the Companies operating under the FXOpen brand only. It is not to be construed as an offer, solicitation, or recommendation with respect to products and services provided by the Companies operating under the FXOpen brand, nor is it to be considered financial advice.

ford in the next few weeksFord stock is undervalued and now at strong support
we will see bullish movements in the next few days

F 1H Swing Long Conservative Trend TradeConservative Trend Trade
- long impulse
- volumed T2
+ support level
+ 1/2 correction
+ biggest volume Sp
Calculated affordable stop limit
1 to 2 R/R take profit
Day Trend
"+ long impulse
+ 1/2 correction
- neutral zone
- context direction short"
Month CounterTrend
"- short impulse
+ 1/2 correction
- unvolumed T1
+ support level
+ long volume distribution
+ biggest volume manipulation"
Year Trend
"+ long impulse
+ volumed T2 level
+ volumed 2Sp+
+ 1/2 correction
+ weak test"

$F: Ford Motor Company – Driving Profits or Stalling Out?(1/9)
Good afternoon, everyone! ☀️ NYSE:F : Ford Motor Company – Driving Profits or Stalling Out?
With F at $10.18, is this auto giant revving up with EVs or sputtering in the market? Let’s shift gears and find out! 🔍
(2/9) – PRICE PERFORMANCE 📊
• Current Price: $ 10.18 as of Mar 18, 2025 💰
• Recent Move: Slight uptick in March, per data 📏
• Sector Trend: Auto sector mixed, EV demand growing 🌟
It’s a road with twists—let’s see where it leads! ⚙️
(3/9) – MARKET POSITION 📈
• Market Cap: Approx $45B (4.4B shares) 🏆
• Operations: Global auto manufacturer, focusing on EVs ⏰
• Trend: EV push with F-150 Lightning, per data 🎯
Firm in its lane, with electric acceleration! 🚗
(4/9) – KEY DEVELOPMENTS 🔑
• Q1 2025 Earnings: Expected soon, EV sales in focus 🌍
• EV Sales: F-150 Lightning gaining traction, per data 📋
• Market Reaction: Stock reflects cautious optimism 💡
Shifting to electric, eyes on the horizon! ⚡
(5/9) – RISKS IN FOCUS ⚡
• Economic Slowdown: Impact on auto sales 📉
• Competition: Tesla, GM, VW in EV race ❄️
• Supply Chain: Geopolitical tensions affecting parts 🛑
It’s a competitive race—buckle up! 🚦
(6/9) – SWOT: STRENGTHS 💪
• Brand Power: Iconic auto brand 🥇
• EV Strategy: F-150 Lightning leading the charge 📊
• Undervalued: Low P/E ratio, strong cash flow 🔧
Got the engine to roar! 🏁
(7/9) – SWOT: WEAKNESSES & OPPORTUNITIES ⚖️
• Weaknesses: Traditional auto sales vulnerable to economic shifts 📉
• Opportunities: Growing EV market, new models 📈
Can it charge ahead or run out of juice? 🤔
(8/9) – POLL TIME! 📢
F at $10.18—your take? 🗳️
• Bullish: $12+ soon, EV boom drives growth 🐂
• Neutral: Steady, risks balance out ⚖️
• Bearish: $9 looms, market stalls 🐻
Chime in below! 👇
(9/9) – FINAL TAKEAWAY 🎯
F’s $10.18 price tags potential value 📈, but volatility’s in the air 🌿. Dips are our DCA fuel 💰—buy low, ride high! Gem or bust?

F 5M Daytrade Long Aggressive Trend TradeAggressive Trend Trade
- short impulse
+ volumed TE / T1 level
+ support level
+ long volume distribution approach
+ biggest volume 2Sp+
- no test
Calculated affordable stop limit
1 to 2 R/R take profit before 5M T2
Hour Trend
"- long impulse
- volumed T2
+ support level
+ 1/2 correction
+ biggest volume manipulation"
Day Trend
"+ long impulse
+ 1/2 correction
- neutral zone
- context direction short"
Month CounterTrend
"- short impulse
+ 1/2 correction
- unvolumed T1
+ support level
+ long volume distribution
+ biggest volume manipulation"
Year Trend
"+ long impulse
+ volumed T2 level
+ volumed 2Sp+
+ 1/2 correction
+ weak test"

F 5M DayTrade Long Conservative CounterTrend TradeConservative CounterTrend Trade
+ long impulse
+ exhaustion volume
+ change of trend
+ neutral zone
Calculated affordable stop limit
1 to 2 R/R take profit
1H CounterTrend
"- short impulse
- unvolumed TE / T1
+ support level
+ long volume distribution
+ volumed Sp"
1D CounterTrend
"+ long impulse
- biggest volume on correction
- below SOS test level
- below support level
+ 1/2 correction"
1M Trend
"- short impulse
+ 1/2 correction
- unvolumed T1
+ support level
+ reverse volume approach
+ volumed manipulation"
1Y Trend
"+ long impulse
+ volumed T2 level
+ volumed 2Sp+
+ weak test"
F 5M Daytrade Conservative CounterTrend TradeConservative CounterTrend Trade
+ long impulse
+ T1 level
+ support level
+ 1/2 correction
+ volumed 2Sp-
Calculated affordable stop limit
1 to 2 R/R take profit
1H Countertrend
"- short impulse
- unvolumed TE / T1
+ support level
+ long volume distribution
+ volumed Sp
+ test"
1D Trend
"+ long impulse
- biggest volume on correction
- below SOS test level
- below support level
+ 1/2 correction"
1M CounterTrend
"- short impulse
+ 1/2 correction
- unvolumed T1
+ support level
+ reverse volume approach
+ volumed manipulation"
1Y Trend
"+ long impulse
+ volumed T2 level
+ volumed 2Sp+
+ weak test"

F 5M Long Conservative Trend DayTrade Conservative Trend Trade
+ long impulse
+ SOS level
+ 1/2 correction
+ support level
+ biggest volume 2Sp+
Calculated affordable stop limit
1D T2 take profit
1H Trend
"+ long impulse
- before 1/2 correction
+ SOS test level"
1D Trend
"- short impulse
+ exhaustion volume
+ volumed TE / T1 level
+ biggest volume 2Sp+
+ test"
1M CounterTrend
"- short impulse
+ 1/2 correction
- unvolumed T1
+ support level
+ reverse volume approach
+ volumed manipulation"
1Y Trend
"+ long impulse
+ volumed T2 level
+ volumed 2Sp+
+ weak test"

Ford (F) Stock Price Rises Following Trump's DecisionFord (F) Stock Price Rises Following Trump's Decision
The White House announced on Wednesday that automakers will receive a one-month exemption from tariffs on imports from Mexico and Canada for vehicles that comply with the free trade agreement between these two countries and the United States.
White House Press Secretary Karoline Leavitt stated that this move came in response to a request from the heads of Ford Motor, General Motors, and Stellantis. The American Automotive Policy Council expressed gratitude to President Trump in a statement and noted that companies would work with the administration to boost vehicle production in the U.S. and expand exports.
This fundamental backdrop triggered a bullish momentum in the stock market for these automakers. In particular, Ford (F) shares rose by more than 6%, while the S&P 500 (US SPX 500 mini on FXOpen) gained about 1.1%.
As shown in Ford (F) stock's price chart today, the stock has rebounded from a four-year low.
Technical Analysis of Ford (F) Stock Chart
As we noted in our February 7 analysis of Ford (F) stock, special attention should be paid to the level marked by the blue line. This area, around $9.65–$9.75, acted as support in 2023 and 2024 (indicated by arrows), preventing bears from pushing the price below the psychological threshold of $10 per share.
We also highlighted the "Trump factor" and the fact that the newly inaugurated president could drastically alter the landscape for the iconic American automaker by imposing tariffs on foreign car manufacturers. The impact of this price driver on Ford (F) shares is visible on the chart: a sharp upward reversal (marked by a curved arrow) indicates that the bears’ attempt to push the stock below its previous low has failed.
It is reasonable to assume that bulls now have the initiative. If they manage to push Ford (F) stock above the resistance of the blue line, this level could turn into future support.
Ford (F) Stock Price Forecasts
Analysts remain cautious in their assessments. They may believe that one month is too short a period to significantly alter supply chains and relocate production to the U.S., where, according to Trump's statements, no tariffs would be imposed.
According to TipRanks:
→ Only 4 out of 14 analysts recommend buying Ford (F) stock.
→ The average 12-month price forecast for Ford (F) is $10.76.
Trade on TradingView with FXOpen. Consider opening an account and access over 700 markets with tight spreads from 0.0 pips and low commissions from $1.50 per lot.
This article represents the opinion of the Companies operating under the FXOpen brand only. It is not to be construed as an offer, solicitation, or recommendation with respect to products and services provided by the Companies operating under the FXOpen brand, nor is it to be considered financial advice.

Ford 1D Investment Aggressive CounterTrend TradAggressive CounterTrend Trade
- short impulse
+ exhaustion volume
+ 1/2 correction
Calculated affordable stop limit
Take profit:
1/3 to 1/2 Month Trend
1/3 to Month T2
1/3 to Year 1/2
Sell F Limit at $14.95 (Good 'til Canceled)
Sell F Limit at $11.57 (Good 'til Canceled)
Sell F Limit at $10.21 (Good 'til Canceled)
Monthly CounterTrend
"- short impulse
+ 1/2 correction
- unvolumed T1
+ support level
+ reverse volume approach
+ volumed manipulation"
Yearly Trend
"+ long impulse
+ volumed T2 level
+ volumed 2Sp+
+ weak test"

Ford (F) Share Price Drops to a 4-Year LowFord (F) Share Price Drops to a 4-Year Low
As shown by the Ford (F) share price chart today, the price has fallen to $9.25 – its lowest level since early 2021.
This drop occurred following the publication of the quarterly earnings report on 5 February:
→ Earnings per share: Actual = $0.39, Expected = $0.34;
→ Gross revenue: Actual = $48.2bn, Expected = $47.4bn.
Despite the report exceeding expectations, investors were disappointed by the company’s weak forecasts for 2025.
The decline in Ford’s share price was further exacerbated when on 6 February, S&P Global Ratings announced that, according to their analysts:
→ Progress on cost reduction is slower than expected;
→ Price pressures are rising, and labour costs remain high;
→ Ford Motor Co.’s margin growth will be limited until 2026.
As a result, S&P revised its outlook for Ford’s debt rating from stable to negative, citing "weaker-than-expected profitability prospects."
Technical Analysis of Ford (F) Share Price Chart
A key focus is the $9.75 level, which acted as support in 2023 and 2024, preventing the bears from pushing the price below the psychological $10 per share mark.
However, the recent price drop with a large bearish gap seems to have changed the situation, and now the $9.75 level may switch from support to resistance.
This suggests that the Ford (F) share price could continue to develop within the emerging (as shown by the red lines) descending channel.
Should You Buy Ford (F) Shares?
Analysts are cautious in their assessments. According to TipRanks:
→ Only 2 out of 12 analysts recommend buying Ford (F) shares;
→ The average 12-month price target for Ford (F) shares is $10.52.
However, the “Trump factor” should not be overlooked. The newly elected president could significantly alter the situation for the iconic US automaker, potentially by imposing tariffs on imports from other countries. The implementation of the economic support measures promised by Trump during his campaign may prove effective and support Ford’s share price in the coming years.
Trade on TradingView with FXOpen. Consider opening an account and access over 700 markets with tight spreads from 0.0 pips and low commissions from $1.50 per lot.
This article represents the opinion of the Companies operating under the FXOpen brand only. It is not to be construed as an offer, solicitation, or recommendation with respect to products and services provided by the Companies operating under the FXOpen brand, nor is it to be considered financial advice.

FORD WEEKLYRULES:
-If price break Point 2, 4, 6, or 8 cancel the setup
-Price needs to break Point 1, 3, 5, or 7 to confirm the setup
When price reach the 100FE(BLUE BOX) it normally does a pullback/retest or reversal
The market can Truncate(fall short)
Ford (F): Struggling to Reclaim ResistanceFord was unable to flip its resistance and is now back trading near the support level, with the situation becoming increasingly precarious. NYSE:F has closely followed the Elliott wave count until recently, but now signs of weakness are emerging. If the $9.4 support level is lost, it will invalidate the previous wave count.
Analysts remain pessimistic about Ford’s outlook due to persistent challenges. The company faces potential pricing pressures on internal combustion engine vehicles and continued struggles in the electric vehicle market amid an ongoing price war. Additionally, possible tariffs on imports from Canada and Mexico under Donald Trump’s policies could further complicate the situation.
At this point, we do not see any compelling opportunities in the current market for $F. A long opportunity may arise only if Ford manages to reclaim the significant resistance level. Until then, the risk-to-reward ratio does not justify any immediate action.

TESLA 300 AFTER EARNINGS ? 3 STRONG REASONS !!
Strong EV Market Position:
Tesla’s electric vehicles (EVs) remain popular, with the Model Y and Model 3 ranking among the top-selling vehicles in the U.S. in 2023. Even as legacy automakers enter the market, Tesla’s success suggests continued consumer preference for its vehicles.
Cybertruck:
Tesla’s long-awaited Cybertruck could be a game-changer. Pickup trucks have high gross profit margins, and if Tesla prices the Cybertruck right, it could boost their overall profitability1.
Regulatory Credits and Rebates: As Europe tightens regulations on internal combustion engine (ICE) cars, Tesla may receive more regulatory credits (from competitors like Fiat) going forward.
Full Self-Driving (FSD) Technology: Analysts estimate that Tesla’s FSD technology could potentially raise earnings per share by $1-$2 annually through the end of the decade.

Ford (F): Eyeing Earnings for Potential Resistance FlipFord is set to release its earnings report in a few hours, and analysts generally anticipate that results will meet or slightly exceed consensus expectations. Currently, Ford is trading around a significant resistance level, and a breakout above this level could mark an important shift, opening the door for further gains. Our outlook remains bullish, with expectations that Ford will fill the large gap visible on the chart in the coming months.
Recent analyst targets align with our view, with ratings from Barclays, Goldman Sachs, and Morgan Stanley averaging around $13 for Ford stock. This target range corresponds well with our technical analysis, reinforcing our approach to Ford.
However, we’re holding off on any immediate action until after the earnings report to avoid an unpredictable reaction. We’ll be monitoring the market’s response closely, avoiding impulsive moves, as the true direction often becomes clearer after the initial post-earnings volatility.
Until then, patience remains crucial—trade the plan, stay disciplined, and seize the opportunity when it aligns with our setup.

Large Daily FVG between ~12-13.6Good chance this will get filled considering how large it is, and considering that most daily fair value gaps on Ford have been filled in recent history.
A long play into $12.5-13 seems reasonable here.
Not trading this one myself, just noticing it and saving the idea to see how it plays out, I primarily trade spot, not options.
Example of prior gaps getting filled on the daily below:

6 stocks to add to your portfolio for huge upward potentialI believe at least 5 stocks from these 6 stocks will offer more than 100% return in 2 to 3 years. Regarding TSLA I will be waiting for better entries.
Disclaimer: Not a financial advice. Do your own analysis.
