Ford is Bearish. FDivergence, Elliott flat in progress, negative momentum and fractally correcting.
We are not in the business of getting every prediction right, no one ever does and that is not the aim of the game. The Fibonacci targets are highlighted in purple with invalidation in red. Fibonacci goals, it is prudent to suggest, are nothing more than mere fractally evident and therefore statistically likely levels that the market will go to. Having said that, the market will always do what it wants and always has a mind of its own. Therefore, none of this is financial advice, so do your own research and rely only on your own analysis. Trading is a true one man sport. Good luck out there and stay safe!
FORD

Flooks like a lot of these older stocks are poised for a break out in the coming weeks
follow the money to get to the treasure
i'm eyeing $20 as a target for my trade

Ford is turning around. FIt appears like Wave 5 of a major impulse has finished growing. We are looking for a turnaround confirm, and are trading off what we see as Wave 5 first. If that falls, more short positions may be placed by us in that instance. Bearish outlook for this one.
We are not in the business of getting every prediction right, no one ever does and that is not the aim of the game. The Fibonacci targets are highlighted in purple with invalidation in red. Fibonacci goals, it is prudent to suggest, are nothing more than mere fractally evident and therefore statistically likely levels that the market will go to. Having said that, the market will always do what it wants and always has a mind of its own. Therefore, none of this is financial advice, so do your own research and rely only on your own analysis. Trading is a true one man sport. Good luck out there and stay safe!

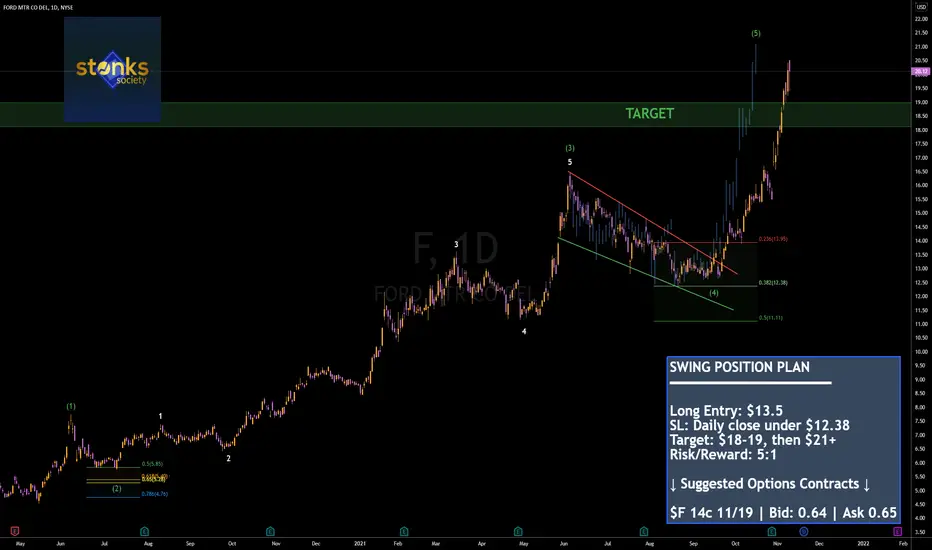
$F | UPDATEWe have successfully predicted this ENTIRE move since the initial falling wedge breakout resulting in a 56% move on the stock.
If you took the suggested options play, here are the potential gains: F 14C 11/19 @0.65 -> 6.0 or over 800% gain!
Congrats if you played.
Ford Analysis 08.11.2021Hello Traders,
welcome to this free and educational analysis.
I am going to explain where I think this asset is going to go over the next few days and weeks and where I would look for trading opportunities.
If you have any questions or suggestions which asset I should analyse tomorrow, please leave a comment below.
If you enjoyed this analysis, I would definitely appreciate it, if you smash that like button.
Thank you for watching and I will see you tomorrow!

Ford Motor Co. (F) Overall Macro Trends & Bullish Case for ATHsThis a fairly long video on Ford Motor Company NYSE:F and the overall macro trends I see in its market. I am long on Ford and this is my bullish case-video and DD. I hope you enjoy! NYSE:F . This is also my first voice over video, so please be kind and let me know if there is ANYTHING you disagree with on the charting aspect of the video or otherwise.
Identified:
1. Falling Wedge
2. Ascending Rising Channel
3. Ascending Broadening Wedge
4. Levels of Support
5. Levels of Resistance
6. Breakout Zones
7. Overall Options-Chain Sentiment
Tools Used:
1. Trading View
2. Google
3. Unusual Whales
4. www.ford.com
5. My brain
Indicators Used:
1. Weekly Candles to find levels of support and resistance - keeping it simple
Could Ford be on the verge of a breakout? How is Ford fitting itself into the EV future? What does the big money say about Ford?
After careful study of Ford NYSE:F I have come to a bullish conclusion that this stock is getting very close to all time highs. There are 3 major overall macro BULLISH patterns at play that I have highlighted in my video.
1. Falling Wedge
2. Ascending Rising Channel
3. Ascending Broadening Wedge
NYSE:F
We are possibly about to enter into a breakout zone with NYSE:F as a Broadening Wedge breakout is forming right now. This Broadening Wedge breakout could propel Ford out of its Ascending Channel, which itself was used to thrust Ford out of its Falling Wedge. This is my mind is BULLISH. Please watch the video for more details on my case of Ford reaching new ATH and when that could potentially happen. Any feedback is greatly welcomed!
I am long on Ford F

Ford Motor Company Overall MacrotrendsIdentified:
1. Falling Wedge
2. Ascending Rising Channel
3. Ascending Broadening Wedge
4. Levels of Support
5. Levels of Resistance

$F Ford loves cup pattern. $F Cup pattern. Next week it will be good for healthy price movement to 22$ price zone if a short consolidation period may occur.

Ford correctionthere will be a potential zone for a good correction in the major ascending trend ...

$F | UPDATEHave not adjusted this count at all since sharing this trade idea awhile back. Played out perfectly and at my wave 5 target of $18-19.
Congrats if you played!! $13.5 -> $18+ resulting in a 35% move in equity.

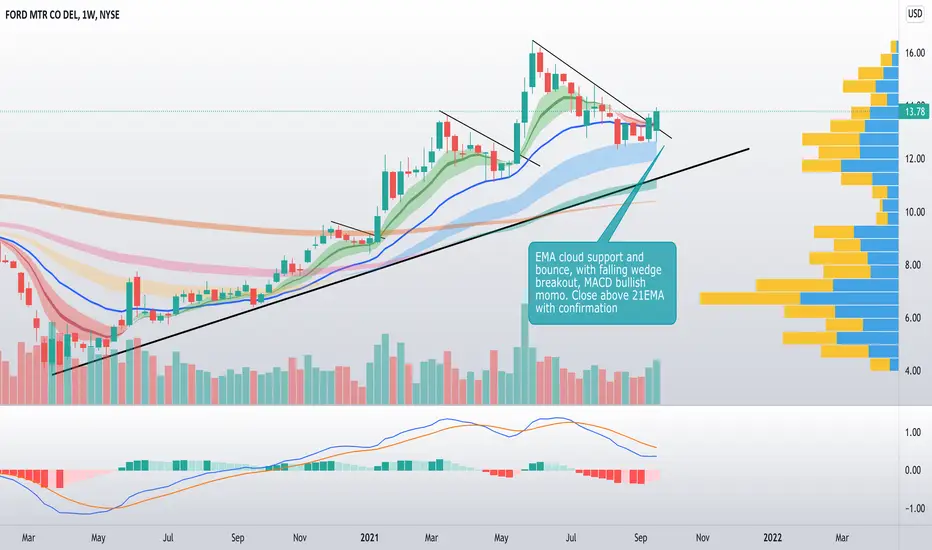
Is the Macro-trend on Ford ending or is this a healthy pullback?NYSE:F
Most DD is posted as text on my chart. Please refer to the chart for a detailed breakdown. This post is meant to purely intrigue those who may be on the fence with Ford. Todays daily candle closed as what I consider to be a Hanging Man. This is a Bearish reversal candlestick pattern that is yet to be confirmed. This reversal may be apart of the Marco or Mirco trend, only time will tell. If the reversion is part of the Micro trend, we may see a pullback to the high $15's again before another leg up. Again, only time will confirm this. I have visualized my thoughts in order to share my way of processing TA and information. Please feel free to open a discuss on the topic with me if you would like.

Acceleration Bands Acceleration Bands
Serve as a trading envelope that factors
The standard setting is 20 candles.
They can be used across any time period as breakout indicators outside these bands.
Acceleration Bands are plotted around a simple moving average as the midpoint, and the upper and lower bands are of equal distance from this midpoint.
Can be used in both growth and value trading strategies to show the potential breakouts.

Ford. Boomer stock. Will it fly?Hi everyone,
Today we are analyzing ancient automotive company manufacturer NYSE:F Ford Motors .
Can this stock still outperform young tech companies?
Let's find out.
Tools used:
Long-term trend lines
Boxes
10 year Fib retracement
1 year Fib retracement
Trend:
NYSE:F is in a strong uptrend channel since Covid crash. It has gained 4x from the bottom. Very imressive for a boomer.
Recent developments:
Price broke long-term resistance line this week. This resistance level goes back 10 years to 2011.
Massive breakout occured on positive news. However, price did not dip back below the resistance. The level was tested and price consolidated.
NYSE:F stock seems very strong here.
Levels :
18.89 - long-term Fib resistance level
17.58 - last rejection
16.46-16.89 - strong demand zone at support
15.72 - long-term Fib support level
13.67 - short-term Fib support level
Interesting to see NYSE:F stock showing strenght and going to 7 year highs.
If the company will be successfull with their EV program, I expect stock price to grow in the future.
Trade wisely and good luck!
-----------------------------------------------------------------------------------------------------------------
Disclaimer!!!
This is not financial advise.

Can anyone help identify this type of DOJI? Such an odd DOJI candlestick on the $F FORD daily contained above a gap up from the previous day. I know a DOJI needs to open and close at the same relative price for the day, but is it still considered a DOJI on a gap up? Please help!

Ford won't be seeing the lightning TSLA has this year.I love Ford and have the F150 reserved since the first day.
I like the stock at 12.50-13.50 to accumulate.
We'll see in tomorrows earnings if the dividend returns.
I'm not sure how they will do on earnings, but the market as a whole does not look supportive going into November.
Still. I'm going to hold.
I could get another chance to pick up more F under $13.

FORD Long term breakout. Buy and HoDlBeen consolidating in the triangle since 1998. finally broke out and backtested. looks like a good long term hodl

#FORD Double top in an uptrend period sector www.tradingview.com
NYSE:F
-Resistance in progress for a double top pattern
-Sector in uptrend since a while
-MA in uptrend position
-Progression to watch next week

F pullback initiatedentered F 15.50p 11/12 @0.28
~We bounced off a double top
~RSI divergence like the pullback in June
~We are also seeing a similar pattern back to back
✅ Phase 1: a downtrend
✅ Phase 2 an steep upside down cup
✅ Phase 3: a nice strong uptrend impulsive move.
Using fib and zones I have PT at 15.50, 15.13, 14.60. We could see a pullback to 13.43 as well, but I probs wont hold that long. 14.60 is my last take profit, as it is the 0.5 fib line

TSLA - PUTS - OPTIONSAll,
First off I like TSLA, Elon etc. They had an absolute monster run, but what goes up most come down (some). I think we see 760s or 750s retest. Adding PUTS once it fails up here and volume dies off. Also some semi not great news recently. Once again TA and bull run coming to an end I think.


A sharp growth on the way !!!PAVM in Weekly view; regarding the chart's position, and waves, between 35 to 40 percent price growth is expected until the Earning date. Buy is STRONGLY suggested.

possible low risk trade on FORDThis is just a low risk trade for me cause Ford runs last month's very well (picture) and the worldwide lack of chips is hitting the whole car sector.
Not sure what's the long run for this. But I like the technical setup in my trading timeframe (1D) so far.
After a increase in volume and price, we see a 1:2.4 consolidation. I like to see that there is buying interest after closing the gap up (1) around the golden pocket, accompanied by some volume (2). So it means to me the level should hold. Positive earnings should be always a nice catalyst. Also Ford hits the SMA20 in the weekly (picture).
I think i consider a trade if the gap up level breaks again with volume, and my stop would be half ATR under the 13.62$ resistance. I dont want to see a pullback to the 61 fib again.
13.62-0.25 (half ATR)= 13.37 .. should be an epic stop :/
Sry 4 bad english and some mistakes, just a tradingbeginner from germany
have nice weekend
