Where to place your STP LOSS is important & can be misleading Choosing your STP loss determines your risk, and is essential part of executing your trade.
On this trade analysis, we are looking at ticker F (Ford Motors) using the weekly (W) chart as the active chart, the price is selling off & coming into a Demand Zone (DZ). This DZ is also the last higher Low HL of the long-term (M) monthly uptrend.
my trading strategy; makes perfect sense of placing LNG entry, at this level. Order entered & waiting like a snipper in the DZ, surly enough the price penetrates into the DZ & the LNG order is executed at $12.90, now where to place your STP LOSS, meaning at which point do you determine the trade has gone against you & you need to exit & cut your losses short.
There are many strategies for placing your stop loss, some of the common ones, are placing the stop loss below the DZ, some other strategies offer a margin as a buffer, for example if price violates the DZ by lets say 0.50 points, am out & the STP Loss is triggered. the stop loss placement strategy that i used in this trade required a close of a candle stick below the DZ, few days after, once that occurred I executed you my STP loss, and was out at 11.30 points loss, so 1.60 loss per share. that is within my Risk to Reward ratio
Now, the trade was still a loss, yet it was not a bust; simply because I anticipated this risk within expected range of my trade plan. in other words, I followed my trading plan & rules; that really matters. Following a trading plan is how novice traders become trading sharks. Obviously it hurts the ego to witness price rallies to $15 and above; shortly after closing below the DZ & triggering my stop-loss; but thats life, you can't make sense of it all, the best we can do is learn how to navigate it.
*Active Chart (W)
*Long-term chart (M)
*Enter timing chart (D)
Fordmotorcompany

#ford powerful twisted continuedHere and there markets are showing up positive signals of what near future will bring.
big markets are ready to suck in more money now.
Here we have a nice burst of price increase for Ford , that we expect to follow up to 18,45 USD by this cycle, with safenets that would suggest 17,90 target for us.

F:Not out of woods yetFord
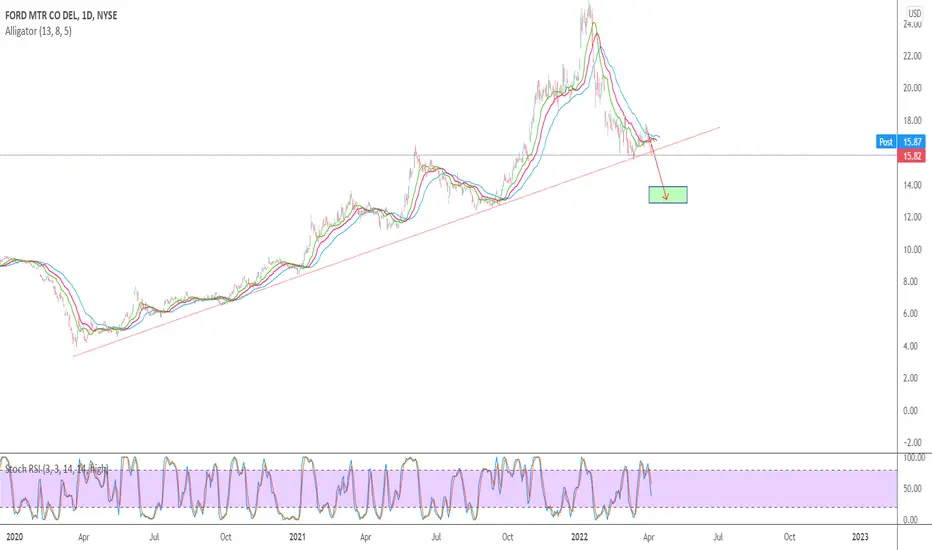
Short Term - We look to Sell a break of 15.43 (stop at 16.33)
We are trading at overbought extremes. A lower correction is expected. A break of 15.50 is needed to confirm follow through negative momentum. A break of support at 15.50 should lead to a more aggressive move lower towards 13.00. Further downside is expected.
Our profit targets will be 13.04 and 12.00
Resistance: 16.00 / 18.00 / 21.00
Support: 15.50 / 13.00 / 11.00
Please be advised that the information presented on TradingView is provided to Vantage (‘Vantage Global Limited’, ‘we’) by a third-party provider (‘Signal Centre’). Please be reminded that you are solely responsible for the trading decisions on your account. There is a very high degree of risk involved in trading. Any information and/or content is intended entirely for research, educational and informational purposes only and does not constitute investment or consultation advice or investment strategy. The information is not tailored to the investment needs of any specific person and therefore does not involve a consideration of any of the investment objectives, financial situation or needs of any viewer that may receive it. Kindly also note that past performance is not a reliable indicator of future results. Actual results may differ materially from those anticipated in forward-looking or past performance statements. We assume no liability as to the accuracy or completeness of any of the information and/or content provided herein and the Company cannot be held responsible for any omission, mistake nor for any loss or damage including without limitation to any loss of profit which may arise from reliance on any information supplied by Signal Centre.

7/27/22 FFord Motor Co ( NYSE:F )
Sector: Consumer Durables (Motor Vehicles)
Market Capitalization: 53.023B
Current Price: $13.19
Breakout price: $13.55
Buy Zone (Top/Bottom Range): $12.60-$10.90
Price Target: $14.80-$15.40 (1st), $17.90-$18.30 (2nd)
Estimated Duration to Target: 28-30d (1st), 70-74d (2nd)
Contract of Interest: $F 8/19/22 14c, $F 12/16/22 15c
Trade price as of publish date: $0.32/contract, $0.75/contract

ASX:INR TO REGAIN LT UPTREND?Watching INR closely after recent bullish fundamental news regarding Ford Binding Offtake Agreement.
I have charted key levels of support and resistance as well as added in long-term and short-term trends.
Direction 1: Recently validating short-term uptrend and testing current daily resistance zone IF momentum continues it could regain long-term uptrend and eventually breach current daily resistance.
Direction 2: Short-term uptrend eventually breaks due to lack of bullish momentum and a selloff but manages to maintain support, eventually regaining long-term uptrend for a slower and more stable rally as it targets upper band downtrend resistance and ath resistance.
Direction 3: Short-term uptrend fails and price fails to regain long-term uptrend due to selloff, price manages to hold and validate daily support and moves sideways developing a short-term range.
Direction 4: Short-term trend fails and daily support fails, selloff increases and price moves back to the former low territory to find and validate a level of support.
Indicator RSI: Currently trending above the 50 midway mark and in Bullish territory. I will be watching closely to see which way momentum swings and see if it fails the current uptrend.
"DISCLAIMER: NO ADVICE. The information presented here is general in nature and is for education purposes only. Nothing should be considered to be advice. You should consult with an appropriate professional for specific advice tailored to your situation."

More af-FORD-able?Ford - Short Term - We look to Buy at 12.42 (stop at 11.47)
Broken out of the channel formation to the upside. Price action looks to be forming a bottom. A higher correction is expected. Expect trading to remain mixed and volatile.
Our profit targets will be 14.45 and 16.00
Resistance: 13.28 / 13.96 / 14.46
Support: 12.42 / 11.78 / 10.61
Disclaimer – Saxo Bank Group. Please be reminded – you alone are responsible for your trading – both gains and losses. There is a very high degree of risk involved in trading. The technical analysis, like any and all indicators, strategies, columns, articles and other features accessible on/though this site (including those from Signal Centre) are for informational purposes only and should not be construed as investment advice by you. Such technical analysis are believed to be obtained from sources believed to be reliable, but not warrant their respective completeness or accuracy, or warrant any results from the use of the information. Your use of the technical analysis, as would also your use of any and all mentioned indicators, strategies, columns, articles and all other features, is entirely at your own risk and it is your sole responsibility to evaluate the accuracy, completeness and usefulness (including suitability) of the information. You should assess the risk of any trade with your financial adviser and make your own independent decision(s) regarding any tradable products which may be the subject matter of the technical analysis or any of the said indicators, strategies, columns, articles and all other features.
Please also be reminded that if despite the above, any of the said technical analysis (or any of the said indicators, strategies, columns, articles and other features accessible on/through this site) is found to be advisory or a recommendation; and not merely informational in nature, the same is in any event provided with the intention of being for general circulation and availability only. As such it is not intended to and does not form part of any offer or recommendation directed at you specifically, or have any regard to the investment objectives, financial situation or needs of yourself or any other specific person. Before committing to a trade or investment therefore, please seek advice from a financial or other professional adviser regarding the suitability of the product for you and (where available) read the relevant product offer/description documents, including the risk disclosures. If you do not wish to seek such financial advice, please still exercise your mind and consider carefully whether the product is suitable for you because you alone remain responsible for your trading – both gains and losses.

Ford AnalysisAn analysis for Ford (F)
Similar positions above similar downward trending channels
Just above the green dotted line which is the line that I would consider the bullish support

Ford - Similar Indicator Situations Similar scenario right now to the area first in yellow
Price has dipped similarly to the 100MA
This touch on the 100MA on this Weekly timeframe will be bullish and lead to continuation above the major trend line
Major point is the initial and latter scenario are very similar
Bullish

TESLA - THE MACHINE THAT BUILDS THE MACHINESThe company with multiple companies within. After acquisition of PERBIX Tesla became the machine that builds the machines.
Not much needs to be said here except:
Macro environment plays out for all the known reasons.
Maximum fear have not been reached by retail yet. Institutions are buying in. Largest whales Vanguard and Black Rock have increased their holdings.
Total Increased Positions 1.558 vs Total Decreased Positions = 968. New Positions = 236 vs Sold out Positions = 141.
Guess who survives the next 10 years
MBG Net debt = 94.13B
GM Net debt = 80.42B
F Net debt = 95.76B
TSLA Net debt = -11.29B
A clear 10/10 broadening wedge / megaphone pattern is playing out with multiple price gaps in between (represented by the orange lines) 2/7 has been filled. All might not be filled (least changes to be filled around the 450 price target)
80% completion of the pattern expected to be reached around Q2 earnings with reversal to the upside for 100% completion and onwards to new ATHs.
In spite of of continuation or reversal, descending broadening wedges are always bullish in nature.
Only reason for this idea to be invalid will be WW3 with nukes.
In times like these remember to be more together with your family <3

Possible Head and Shoulders formingLots to look at these days. Be careful with your funds. Im no pro, do you research, make good decisions.

FORD - Weekly IdeaA nice Fibonacci Circle can be drawn with the bearish but very little volatility price
This shows price hit a bottom at 2.618
Price increase based n assumption that 1.618 acts as support for price

Ford - Similar Indicator Situations Using these different places in time, yet similar structural features using this indicator, conclusions can be drawn about how price will progress on this Monthly timeframe
It looks bullish, hard/impossible enter into a trade on this timeframe, I am just demonstrating an indicator

Ford ($F): Continued Downside Toward Discount TerritoryFord Motor Company has had a spectacular run up since the lows of March 2020. The company value appreciated 600% in the months after COVID was first announced and lockdowns started. Two years later, and it appears F has made a high at 25.87 and broken bullish market structure below 18.60.
I am looking at continued down side to 15.50 followed by retracement back to 20.00 level before downside continues to fairer value. My short objectives are 15.50, 12.40, 11.15 and 9.50 price levels.


Ford back to $20 ?Can ford make its way back to $20. I think it can if bulls push it. Technically i see some downward movement before we take off. What do you think?

Ford buy the dip[F is sitting nice bottom 43 level on RSI. It can continue to move higher high same as other EV sectors.

$F at previous highs$F
Ford is currently at its previous high from June of last year. If you like buying support this is a solid setup

Ford Stock: Bullish Divergence (Price vs. RSI and MACD)Ford's chart is showing bullish divergence as the stock price decreased but the RSI and MACD have increased.
This suggests that the stock may have bottomed out and is poised for a rebound.
Ford has a positive growth catalyst with its electric vehicle line-up: F-150 Lightning, Mustang Mach E, and E-Transit van.
The company also produces hybrids. The EVs and hybrids can stimulate growth for Ford during this time of high gas prices.
You can google the title: "Ford - The Future is Looking Brighter with EVs" to read more.

Ford Motors-Making a turnaroundThe corrective move has halted and a resumption in upmove is imminent.

$F - Ford Motor investment idea 💡 ⚠️ - This idea is based on my technical analysis only. Do your research and trade on your own risk!

