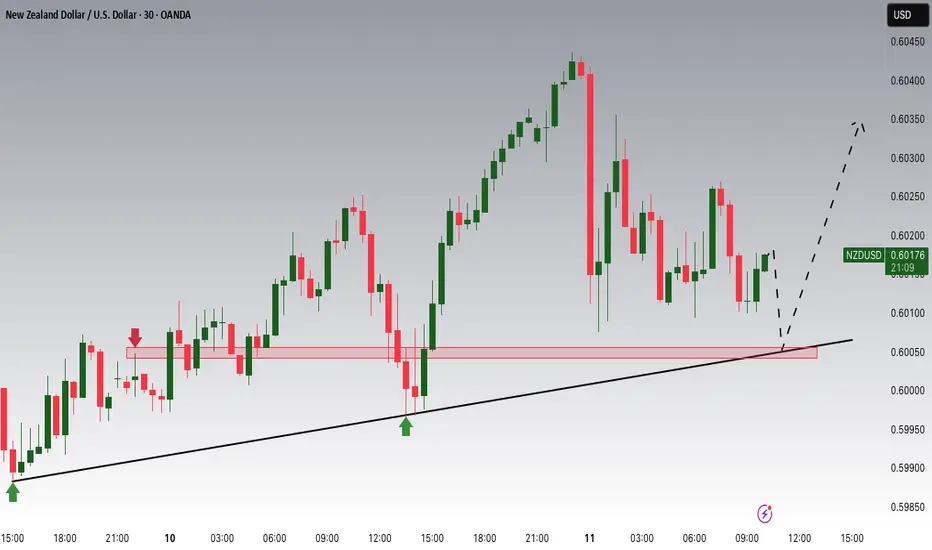
NZDUSD Potential UpsidesHey Traders, in today's trading session we are monitoring NZDUSD for a buying opportunity around 0.60000 zone, NZDUSD is trading in an uptrend and currently is in a correction phase in which it is approaching the trend at 0.60000 support and resistance area.
Trade safe, Joe.
Forex market
EURUSD: Bearish Continuation Ahead EURUSD is expected to maintain a bearish trend following a confirmed breakout below a significant horizontal support level.
The broken structure, along with a descending trend line, creates a contracting supply zone, indicating a strong likelihood of further downward movement.
The next target is
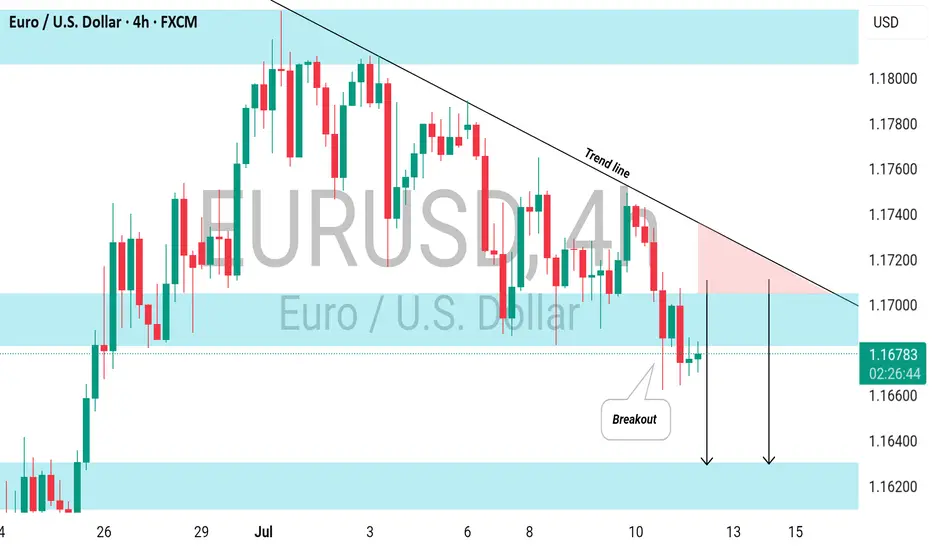
USD/CHF (1-hour timeframe)USD/CHF (1-hour timeframe), the analysis appears to include:
Ascending triangle pattern (with higher lows and a horizontal resistance).
Ichimoku Cloud for trend analysis.
Two marked target levels with projected breakout potential.
Identified Targets:
1. First Target:
🔹 Around 0.80000
This is j

EURAUD: Rebound to 1.798 is high probabilityI am watching for a reversal here EURAUD as marked on my chart, expecting a rejection with a upside target at around 1.798.
This are is where it can become a decision point, either price finds support and bounces, or it breaks below, and that’s when we might see the move start to extend lower.
If

11.07.25 USDJPY Trade Recap + Re-Entry for +2.5%A long position taken on USDJPY for a breakeven, followed by a premature re-entry that I took a loss on. I also explain the true re-entry I should have taken for a 2.5% win.
Full explanation as to why I executed on these positions and also more details around the third position that I did not take

GBPUSD: Two Strong Bullish Area To Buy From ?GU is currently in a bullish trend when examined on a daily time frame. There are two potential areas for purchase. The first area is currently active, as we anticipate a price reversal from this point. There is a significant possibility that price could decline to the second area and subsequently r

USDCAD I Weekly CLS I Model 1 I KL - OB I Target CLS LowYo Market Warriors ⚔️
BIG SHORT — if you’ve been riding with me, you already know:
🎯My system is 100% mechanical. No emotions. No trend lines. No subjective guessing. Just precision, structure, and sniper entries.
🧠 What’s CLS?
It’s the real smart money. The invisible hand behind $7T/day — bank

USDJPY : More Upside Ahead?USDJPY : More Upside Ahead?
USDJPY remains firmly in a bullish trend, largely driven by renewed tariff concerns.
The yen weakened sharply after U.S. President Donald Trump reaffirmed plans to impose 25% tariffs on Japanese goods starting August 1st.
Since that announcement, USDJPY has rallied ne

EURO - Price will continue to grow inside rising channelHi guys, this is my overview for EURUSD, feel free to check it and write your feedback in comments👊
Recently, price entered to rising channel, where it soon reached the support level, which coincided with the support area.
After this movement, the price broke this level, but soon turned around and

HelenP. I Euro will drop more, breaking the support levelHi folks today I'm prepared for you Euro analytics. After analyzing the current structure of the EURUSD chart, I noticed a strong break of the ascending trend line, which had been respected for a long period. The price has now returned to test the broken trend line from below, aligning with the resi

See all popular ideas
| - | - | - | - | - | - | - | ||
| - | - | - | - | - | - | - | ||
| - | - | - | - | - | - | - | ||
| - | - | - | - | - | - | - | ||
| - | - | - | - | - | - | - | ||
| - | - | - | - | - | - | - | ||
| - | - | - | - | - | - | - | ||
| - | - | - | - | - | - | - |