CHF/JPY BEARS ARE STRONG HERE|SHORT
Hello, Friends!
The BB upper band is nearby so CHF-JPY is in the overbought territory. Thus, despite the uptrend on the 1W timeframe I think that we will see a bearish reaction from the resistance line above and a move down towards the target at around 177.078.
Disclosure: I am part of Trade Nation's Influencer program and receive a monthly fee for using their TradingView charts in my analysis.
✅LIKE AND COMMENT MY IDEAS✅
Forecast

AUDCHF: Growth & Bullish Forecast
Looking at the chart of AUDCHF right now we are seeing some interesting price action on the lower timeframes. Thus a local move up seems to be quite likely.
Disclosure: I am part of Trade Nation's Influencer program and receive a monthly fee for using their TradingView charts in my analysis.
❤️ Please, support our work with like & comment! ❤️

EURUSD: Bears Will Push Lower
The analysis of the EURUSD chart clearly shows us that the pair is finally about to tank due to the rising pressure from the sellers.
Disclosure: I am part of Trade Nation's Influencer program and receive a monthly fee for using their TradingView charts in my analysis.
❤️ Please, support our work with like & comment! ❤️

USOIL Is Very Bullish! Long!
Take a look at our analysis for USOIL.
Time Frame: 1D
Current Trend: Bullish
Sentiment: Oversold (based on 7-period RSI)
Forecast: Bullish
The market is on a crucial zone of demand 73.546.
The oversold market condition in a combination with key structure gives us a relatively strong bullish signal with goal 79.365 level.
P.S
We determine oversold/overbought condition with RSI indicator.
When it drops below 30 - the market is considered to be oversold.
When it bounces above 70 - the market is considered to be overbought.
Disclosure: I am part of Trade Nation's Influencer program and receive a monthly fee for using their TradingView charts in my analysis.
Like and subscribe and comment my ideas if you enjoy them!

EURUSD Is Going Down! Sell!
Please, check our technical outlook for EURUSD.
Time Frame: 1h
Current Trend: Bearish
Sentiment: Overbought (based on 7-period RSI)
Forecast: Bearish
The price is testing a key resistance 1.146.
Taking into consideration the current market trend & overbought RSI, chances will be high to see a bearish movement to the downside at least to 1.143 level.
P.S
Overbought describes a period of time where there has been a significant and consistent upward move in price over a period of time without much pullback.
Disclosure: I am part of Trade Nation's Influencer program and receive a monthly fee for using their TradingView charts in my analysis.
Like and subscribe and comment my ideas if you enjoy them!

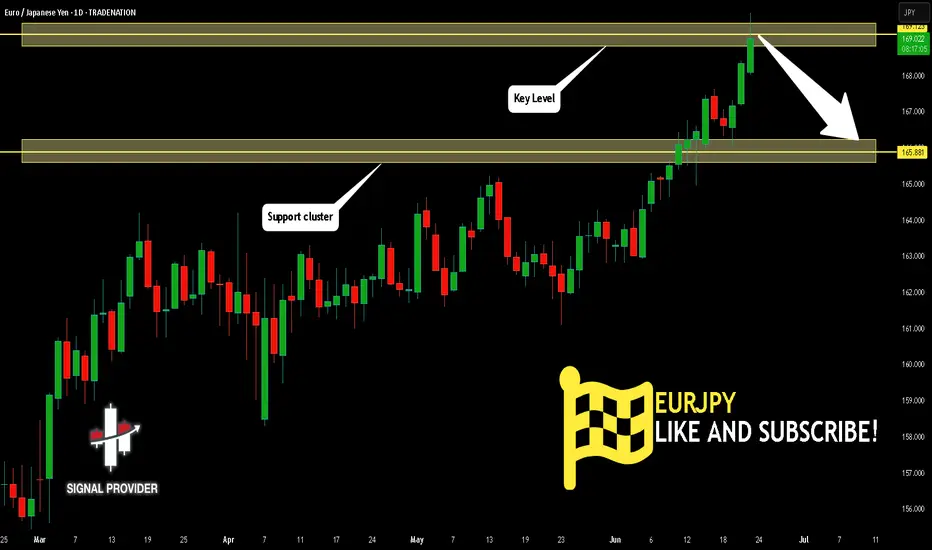
EURJPY Will Fall! Short!
Here is our detailed technical review for EURJPY.
Time Frame: 1D
Current Trend: Bearish
Sentiment: Overbought (based on 7-period RSI)
Forecast: Bearish
The market is trading around a solid horizontal structure 169.123.
The above observations make me that the market will inevitably achieve 165.881 level.
P.S
Please, note that an oversold/overbought condition can last for a long time, and therefore being oversold/overbought doesn't mean a price rally will come soon, or at all.
Disclosure: I am part of Trade Nation's Influencer program and receive a monthly fee for using their TradingView charts in my analysis.
Like and subscribe and comment my ideas if you enjoy them!
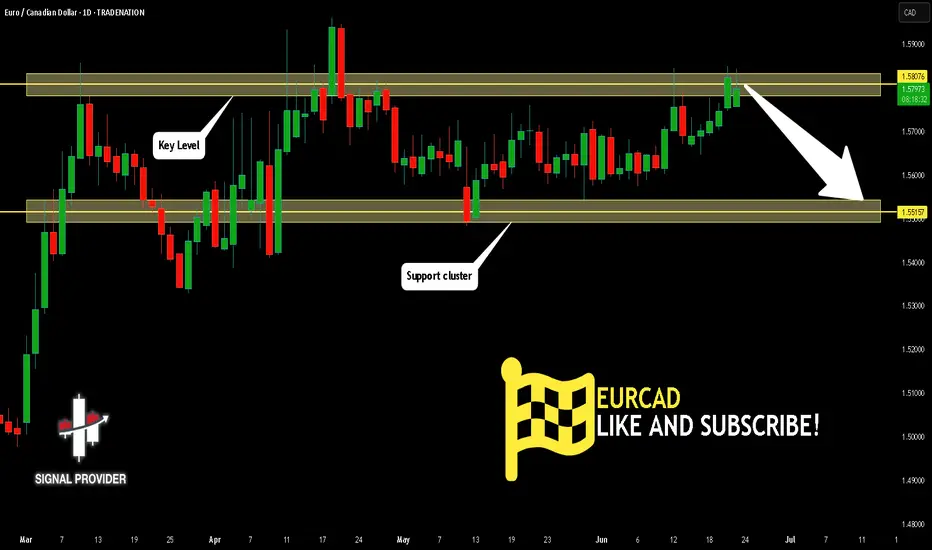
EURCAD Will Go Lower From Resistance! Sell!
Take a look at our analysis for EURCAD.
Time Frame: 1D
Current Trend: Bearish
Sentiment: Overbought (based on 7-period RSI)
Forecast: Bearish
The market is testing a major horizontal structure 1.580.
Taking into consideration the structure & trend analysis, I believe that the market will reach 1.551 level soon.
P.S
The term oversold refers to a condition where an asset has traded lower in price and has the potential for a price bounce.
Overbought refers to market scenarios where the instrument is traded considerably higher than its fair value. Overvaluation is caused by market sentiments when there is positive news.
Disclosure: I am part of Trade Nation's Influencer program and receive a monthly fee for using their TradingView charts in my analysis.
Like and subscribe and comment my ideas if you enjoy them!
AUDCAD Will Move Lower! Short!
Please, check our technical outlook for AUDCAD.
Time Frame: 9h
Current Trend: Bearish
Sentiment: Overbought (based on 7-period RSI)
Forecast: Bearish
The price is testing a key resistance 0.885.
Taking into consideration the current market trend & overbought RSI, chances will be high to see a bearish movement to the downside at least to 0.879 level.
P.S
The term oversold refers to a condition where an asset has traded lower in price and has the potential for a price bounce.
Overbought refers to market scenarios where the instrument is traded considerably higher than its fair value. Overvaluation is caused by market sentiments when there is positive news.
Disclosure: I am part of Trade Nation's Influencer program and receive a monthly fee for using their TradingView charts in my analysis.
Like and subscribe and comment my ideas if you enjoy them!

GBPUSD Will Fall! Sell!
Here is our detailed technical review for GBPUSD.
Time Frame: 6h
Current Trend: Bearish
Sentiment: Overbought (based on 7-period RSI)
Forecast: Bearish
The market is approaching a significant resistance area 1.349.
Due to the fact that we see a positive bearish reaction from the underlined area, I strongly believe that sellers will manage to push the price all the way down to 1.341 level.
P.S
The term oversold refers to a condition where an asset has traded lower in price and has the potential for a price bounce.
Overbought refers to market scenarios where the instrument is traded considerably higher than its fair value. Overvaluation is caused by market sentiments when there is positive news.
Disclosure: I am part of Trade Nation's Influencer program and receive a monthly fee for using their TradingView charts in my analysis.
Like and subscribe and comment my ideas if you enjoy them!

EURNZD Will Go Higher From Support! Buy!
Take a look at our analysis for EURNZD.
Time Frame: 1h
Current Trend: Bullish
Sentiment: Oversold (based on 7-period RSI)
Forecast: Bullish
The market is on a crucial zone of demand 1.922.
The oversold market condition in a combination with key structure gives us a relatively strong bullish signal with goal 1.930 level.
P.S
We determine oversold/overbought condition with RSI indicator.
When it drops below 30 - the market is considered to be oversold.
When it bounces above 70 - the market is considered to be overbought.
Disclosure: I am part of Trade Nation's Influencer program and receive a monthly fee for using their TradingView charts in my analysis.
Like and subscribe and comment my ideas if you enjoy them!

GOLD Will Go Down From Resistance! Short!
Please, check our technical outlook for GOLD.
Time Frame: 1h
Current Trend: Bearish
Sentiment: Overbought (based on 7-period RSI)
Forecast: Bearish
The price is testing a key resistance 3,373.02.
Taking into consideration the current market trend & overbought RSI, chances will be high to see a bearish movement to the downside at least to 3,354.03 level.
P.S
Overbought describes a period of time where there has been a significant and consistent upward move in price over a period of time without much pullback.
Disclosure: I am part of Trade Nation's Influencer program and receive a monthly fee for using their TradingView charts in my analysis.
Like and subscribe and comment my ideas if you enjoy them!

EURJPY Is Going Up! Long!
Please, check our technical outlook for EURJPY.
Time Frame: 4h
Current Trend: Bullish
Sentiment: Oversold (based on 7-period RSI)
Forecast: Bullish
The price is testing a key support 166.677.
Current market trend & oversold RSI makes me think that buyers will push the price. I will anticipate a bullish movement at least to 167.654 level.
P.S
The term oversold refers to a condition where an asset has traded lower in price and has the potential for a price bounce.
Overbought refers to market scenarios where the instrument is traded considerably higher than its fair value. Overvaluation is caused by market sentiments when there is positive news.
Disclosure: I am part of Trade Nation's Influencer program and receive a monthly fee for using their TradingView charts in my analysis.
Like and subscribe and comment my ideas if you enjoy them!

GBPUSD Is Very Bearish! Sell!
Take a look at our analysis for GBPUSD.
Time Frame: 5h
Current Trend: Bearish
Sentiment: Overbought (based on 7-period RSI)
Forecast: Bearish
The market is testing a major horizontal structure 1.357.
Taking into consideration the structure & trend analysis, I believe that the market will reach 1.351 level soon.
P.S
The term oversold refers to a condition where an asset has traded lower in price and has the potential for a price bounce.
Overbought refers to market scenarios where the instrument is traded considerably higher than its fair value. Overvaluation is caused by market sentiments when there is positive news.
Disclosure: I am part of Trade Nation's Influencer program and receive a monthly fee for using their TradingView charts in my analysis.
Like and subscribe and comment my ideas if you enjoy them!

NZD/JPY BEARS WILL DOMINATE THE MARKET|SHORT
NZD/JPY SIGNAL
Trade Direction: short
Entry Level: 87.077
Target Level: 84.490
Stop Loss: 88.805
RISK PROFILE
Risk level: medium
Suggested risk: 1%
Timeframe: 1D
Disclosure: I am part of Trade Nation's Influencer program and receive a monthly fee for using their TradingView charts in my analysis.
✅LIKE AND COMMENT MY IDEAS✅

AUD/JPY SENDS CLEAR BEARISH SIGNALS|SHORT
Hello, Friends!
Previous week’s green candle means that for us the AUD/JPY pair is in the uptrend. And the current movement leg was also up but the resistance line will be hit soon and upper BB band proximity will signal an overbought condition so we will go for a counter-trend short trade with the target being at 93.835.
Disclosure: I am part of Trade Nation's Influencer program and receive a monthly fee for using their TradingView charts in my analysis.
✅LIKE AND COMMENT MY IDEAS✅

BITCOIN SENDS CLEAR BULLISH SIGNALS|LONG
BITCOIN SIGNAL
Trade Direction: long
Entry Level: 104,672.03
Target Level: 107,484.65
Stop Loss: 102,785.72
RISK PROFILE
Risk level: medium
Suggested risk: 1%
Timeframe: 3h
Disclosure: I am part of Trade Nation's Influencer program and receive a monthly fee for using their TradingView charts in my analysis.
✅LIKE AND COMMENT MY IDEAS✅

GBP/USD BEARS ARE STRONG HERE|SHORT
Hello, Friends!
We are going short on the GBP/USD with the target of 1.344 level, because the pair is overbought and will soon hit the resistance line above. We deduced the overbought condition from the price being near to the upper BB band. However, we should use low risk here because the 1W TF is green and gives us a counter-signal.
Disclosure: I am part of Trade Nation's Influencer program and receive a monthly fee for using their TradingView charts in my analysis.
✅LIKE AND COMMENT MY IDEAS✅

AUD/USD SELLERS WILL DOMINATE THE MARKET|SHORT
Hello, Friends!
AUD/USD pair is trading in a local uptrend which we know by looking at the previous 1W candle which is green. On the 1D timeframe the pair is going up too. The pair is overbought because the price is close to the upper band of the BB indicator. So we are looking to sell the pair with the upper BB line acting as resistance. The next target is 0.636 area.
Disclosure: I am part of Trade Nation's Influencer program and receive a monthly fee for using their TradingView charts in my analysis.
✅LIKE AND COMMENT MY IDEAS✅

BITCOIN BEARS WILL DOMINATE THE MARKET|SHORT
BITCOIN SIGNAL
Trade Direction: short
Entry Level: 105,952.89
Target Level: 102,605.64
Stop Loss: 108,184.39
RISK PROFILE
Risk level: medium
Suggested risk: 1%
Timeframe: 4h
Disclosure: I am part of Trade Nation's Influencer program and receive a monthly fee for using their TradingView charts in my analysis.
✅LIKE AND COMMENT MY IDEAS✅

EUR/CHF SHORT FROM RESISTANCE
Hello, Friends!
We are going short on the EUR/CHF with the target of 0.938 level, because the pair is overbought and will soon hit the resistance line above. We deduced the overbought condition from the price being near to the upper BB band. However, we should use low risk here because the 1W TF is green and gives us a counter-signal.
Disclosure: I am part of Trade Nation's Influencer program and receive a monthly fee for using their TradingView charts in my analysis.
✅LIKE AND COMMENT MY IDEAS✅

GBP/CHF BEARS ARE STRONG HERE|SHORT
Hello, Friends!
GBP/CHF pair is trading in a local uptrend which we know by looking at the previous 1W candle which is green. On the 3H timeframe the pair is going up too. The pair is overbought because the price is close to the upper band of the BB indicator. So we are looking to sell the pair with the upper BB line acting as resistance. The next target is 1.094 area.
Disclosure: I am part of Trade Nation's Influencer program and receive a monthly fee for using their TradingView charts in my analysis.
✅LIKE AND COMMENT MY IDEAS✅

Can 6 Holes in a mountain move gold this week? 23-27 June 2025Hello fellow traders of OANDA:XAUUSD
All about last week here
Since Israel's attack on Iran on Friday, June 13th, aimed at destroying all facilities for potential nuclear weapons production, the gold price initially rose to $3450. This surge lasted until Monday, June 16th, during the European session, but then began to fall from there. 📉🔻
Signs of potential peace talks and a swift end to the conflict largely made investors hesitant to invest. Throughout the week, the gold price mostly reacted negatively to higher prices due to investor uncertainty. This was further exacerbated by the fact that the US had not yet entered this war, which Israel initiated. 🕊️😟
However, since the US attack with bunker-busting bombs on the nuclear facilities on June 21st, they are now part of the conflict. Not least for this reason, they might become the target of retaliatory strikes, as already announced by the Iranian regime. 💣💥
If one looks at the timeline of news and announcements regarding potential US involvement in this war, and the two-week waiting period announced by President Trump, it will certainly become clear that this was nothing more than tactics. It was foreseeable that the US would become involved in the conflict, not least because the Israelis lack the appropriate weapons. The possibility of the US providing these weapons to the Israelis was also in the news; however, it then became clear that this specific bomb could only be used by the Stealth Bomber B2. This made it evident that it was only a matter of timing when it would happen, and they naturally wanted to keep that secret – anything else would be nonsensical anyway. 🤫✈️
What's to be expected next? Regarding this conflict, I hope for a swift end. 🕊️🙏 As for the gold price, well, I still believe in a new All-Time High (ATH). 🚀🌟 Will it come this week? Possibly. But the much more important question is whether the Iranian regime will truly dare to attack the US and exact revenge. 🤔⚔️
Market Structure:
The chart shows a clear shift from bullish 🐂 to bearish 🐻 structure. We see a significant high around June 13th at approximately $3,451, followed by a break of structure with lower highs and lower lows forming. 📉
Key Levels: 🔑
Premium levels: The area around $3,440-$3,451 represents premium pricing where institutional selling likely occurred. 💎
Fair Value Gaps: There appear to be several imbalances/gaps that price may seek to fill, particularly around the $3,380-$3,400 zone. 🎯
Order Blocks: The consolidation areas around $3,320-$3,340 and $3,380-$3,400 represent potential institutional order blocks. 🧱
Institutional Levels: 🏦
Psychological resistance: $3,450 level acted as significant resistance. 🚧
Current support cluster: $3,320-$3,340 area showing multiple touches. 🛡️
Liquidity zones:
The recent lows around $3,293 represent buy-side liquidity that institutions may target. 💧
Fibonacci Analysis: 📏
Based on the major swing from the low around June 9th ($3,300) to the high on June 13th ($3,451):
50% retracement: ~$3,375 (already tested and failed) 📉
61.8% retracement: ~$3,357 (near current price action) ✨
78.6% retracement: ~$3,337 (aligns with support cluster) ✅
Gann Concepts: 🔢
The timing shows potential significance around the June 13th high, with subsequent price action following geometric price relationships. The current price action around $3,328 suggests we're testing important Gann square relationships from the cycle highs. 📐
Cycle Timing: ⏰
The approximately 10-day cycle from low to high to current retracement suggests we may be in a corrective phase that could extend into late June, with potential for cycle lows around the June 25-27 timeframe based on typical precious metals cycles. 🗓️
Current Assessment:
Price appears to be in a corrective phase testing the $3,320-$3,340 institutional support zone. A break below could target the cycle lows, while a hold here with reclaim of $3,380 could indicate accumulation for the next leg higher. ⚖️🔍
Please take the time to let me know what you think about this. 💬
-------------------------------------------------------------------------
This is just my personal market idea and not financial advice! 📢 Trading gold and other financial instruments carries risks – only invest what you can afford to lose. Always do your own analysis, use solid risk management, and trade responsibly.
Good luck and safe trading! 🚀📊

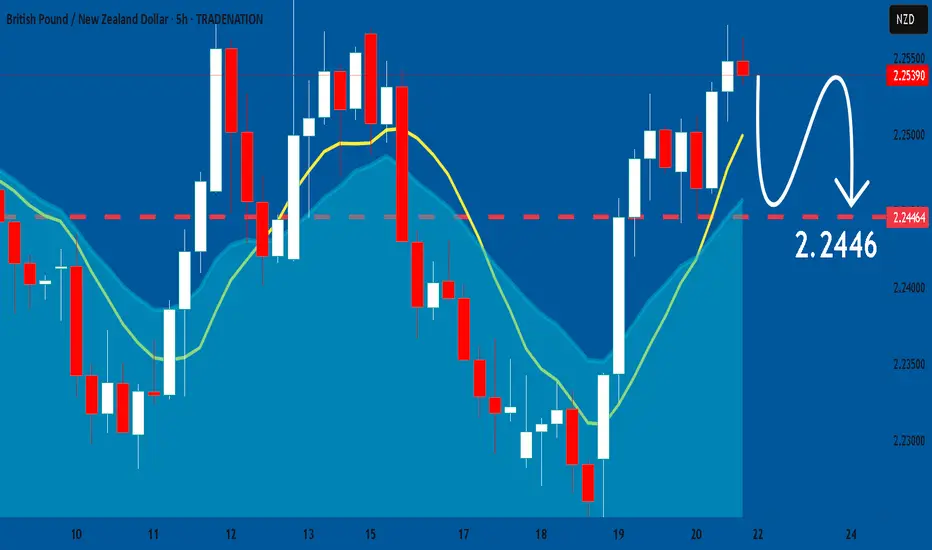
GBPNZD: Market Sentiment & Forecast
Looking at the chart of GBPNZD right now we are seeing some interesting price action on the lower timeframes. Thus a local move down seems to be quite likely.
Disclosure: I am part of Trade Nation's Influencer program and receive a monthly fee for using their TradingView charts in my analysis.
❤️ Please, support our work with like & comment! ❤️