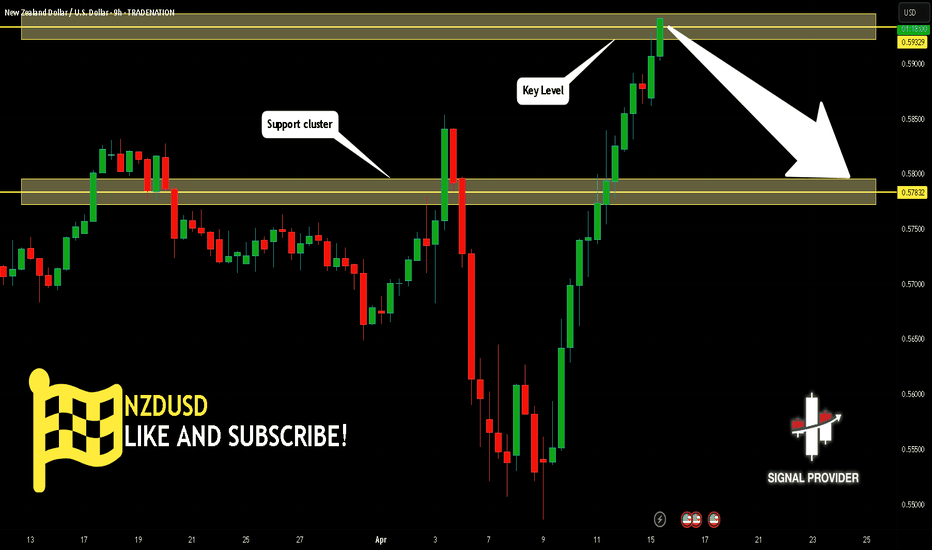
USOIL Is Going Down! Sell!
Take a look at our analysis for USOIL.
Time Frame: 9h
Current Trend: Bearish
Sentiment: Overbought (based on 7-period RSI)
Forecast: Bearish
The market is trading around a solid horizontal structure 71.19.
The above observations make me that the market will inevitably achieve 67.16 level.
P.S
Overbought describes a period of time where there has been a significant and consistent upward move in price over a period of time without much pullback.
Like and subscribe and comment my ideas if you enjoy them!
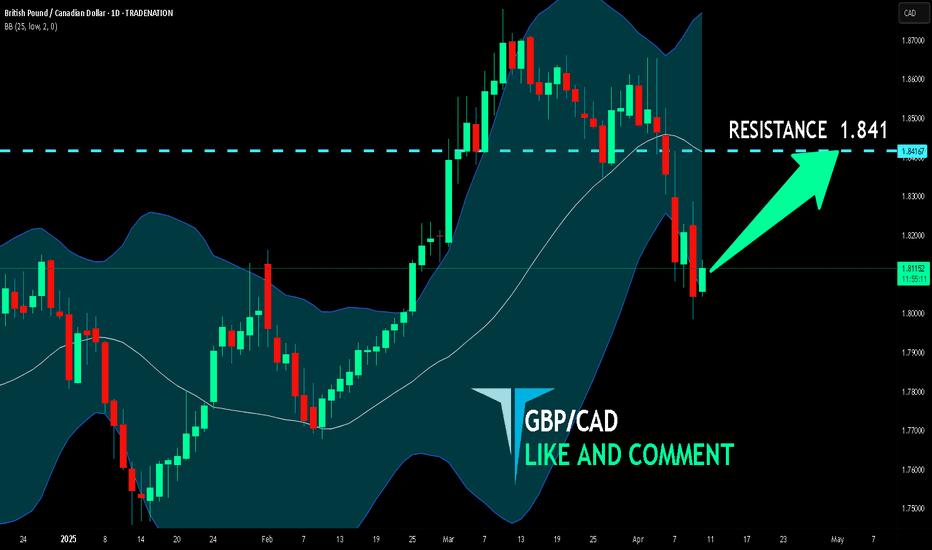
Forecast
CADCHF Will Fall! Short!
Please, check our technical outlook for CADCHF.
Time Frame: 2h
Current Trend: Bearish
Sentiment: Overbought (based on 7-period RSI)
Forecast: Bearish
The market is testing a major horizontal structure 0.626.
Taking into consideration the structure & trend analysis, I believe that the market will reach 0.624 level soon.
P.S
Please, note that an oversold/overbought condition can last for a long time, and therefore being oversold/overbought doesn't mean a price rally will come soon, or at all.
Like and subscribe and comment my ideas if you enjoy them!
AUDCHF Will Go Lower From Resistance! Sell!
Here is our detailed technical review for AUDCHF.
Time Frame: 1h
Current Trend: Bearish
Sentiment: Overbought (based on 7-period RSI)
Forecast: Bearish
The market is approaching a key horizontal level 0.577.
Considering the today's price action, probabilities will be high to see a movement to 0.575.
P.S
The term oversold refers to a condition where an asset has traded lower in price and has the potential for a price bounce.
Overbought refers to market scenarios where the instrument is traded considerably higher than its fair value. Overvaluation is caused by market sentiments when there is positive news.
Like and subscribe and comment my ideas if you enjoy them!
BITCOIN SELLERS WILL DOMINATE THE MARKET|SHORT
Hello, Friends!
We are targeting the 59,865 level area with our short trade on BITCOIN which is based on the fact that the pair is overbought on the BB band scale and is also approaching a resistance line above thus going us a good entry option.
✅LIKE AND COMMENT MY IDEAS✅
CHF/JPY BEARISH BIAS RIGHT NOW| SHORT
Hello, Friends!
CHF/JPY is making a bullish rebound on the 4H TF and is nearing the resistance line above while we are generally bearish biased on the pair due to our previous 1W candle analysis, thus making a trend-following short a good option for us with the target being the 167.610 level.
✅LIKE AND COMMENT MY IDEAS✅
AUD/CHF BEST PLACE TO SELL FROM|SHORT
Hello, Friends!
It makes sense for us to go short on AUD/CHF right now from the resistance line above with the target of 0.569 because of the confluence of the two strong factors which are the general downtrend on the previous 1W candle and the overbought situation on the lower TF determined by it’s proximity to the upper BB band.
✅LIKE AND COMMENT MY IDEAS✅
Forecasting the S&P 500: A Complex TaskForecasting the S&P 500: A Complex Task
Forecasting the S&P 500, a major stock market index, is a challenging endeavor due to numerous factors influencing its movement. These include economic indicators, corporate earnings, interest rates, geopolitical events, and market sentiment.
Key Factors to Consider:
Economic Indicators:
Gross Domestic Product (GDP): Economic growth can positively impact stock prices.
Inflation: High inflation can negatively impact corporate profits and stock prices.
Unemployment Rate: A low unemployment rate generally indicates a strong economy and can support stock prices.
Corporate Earnings:
Profitability: Strong corporate earnings can drive stock prices higher.
Earnings Expectations: Market expectations for future earnings can influence stock prices.
Interest Rates:
Federal Reserve Policy: Interest rate changes by the Federal Reserve can significantly impact stock prices. Lower interest rates can stimulate economic activity and boost stock prices, while higher interest rates can slow down the economy and put downward pressure on stocks.
Geopolitical Events:
Global Events: Political instability, trade wars, or natural disasters can affect market sentiment and stock prices.
Market Sentiment:
Investor Confidence: Positive investor sentiment can drive stock prices upward, while negative sentiment can lead to declines.
Forecasting Methods:
Fundamental Analysis: This involves analyzing economic indicators, corporate earnings, and other factors to assess the underlying value of a stock or index.
Technical Analysis: This method uses historical price data and charts to identify patterns and trends that may predict future price movements.
Quantitative Analysis: This approach employs statistical models and algorithms to analyze large datasets and identify correlations between variables that may influence stock prices.
It's important to note that no forecasting method is foolproof. Stock markets are highly volatile, and unexpected events can significantly impact stock prices. A combination of fundamental, technical, and quantitative analysis can provide a more comprehensive understanding of market dynamics.
Would you like to explore any of these factors or methods in more detail? I can also provide information on specific forecasting tools or resources.
The forecasting of SOLUSDThe forecasting of SOLUSD prices can be a complex task, as it involves analyzing various factors such as:
Market sentiment: The overall mood of the cryptocurrency market can significantly impact SOLUSD prices. Positive news and trends can lead to price increases, while negative news and trends can lead to price decreases.
Supply and demand: The balance between the supply of SOLUSD tokens and the demand for them can also influence prices. If demand exceeds supply, prices may rise, and vice versa.
Technical analysis: This involves studying historical price data to identify patterns and trends that may indicate future price movements. Technical indicators such as moving averages, relative strength index (RSI), and Bollinger Bands can be used to make predictions.
Fundamental analysis: This involves examining the underlying factors that affect the value of SOLUSD, such as the development of the Solana blockchain, the adoption of SOLUSD by merchants and businesses, and the overall health of the cryptocurrency industry.
Disclaimer: This information is for educational purposes only and should not be considered financial advice. Investing in cryptocurrencies involves risk, and it is important to do your own research before making any investment decisions.
Forecasting the S&P 500Forecasting the S&P 500: A Complex Task
Forecasting the S&P 500, a major US stock market index, is a challenging endeavor due to the multitude of factors influencing its movement. These include economic indicators, corporate earnings, interest rates, geopolitical events, and investor sentiment.
Key Factors to Consider:
Economic Indicators:
GDP Growth: A strong economy generally supports stock prices.
Unemployment Rate: A low unemployment rate indicates a robust labor market, which can boost corporate profits and stock prices.
Inflation: High inflation can negatively impact corporate profits and stock prices due to increased costs.
Corporate Earnings:
Profit Growth: Strong corporate earnings growth can drive stock prices higher.
Earnings Expectations: Market expectations for future earnings play a significant role in stock price movements.
Interest Rates:
Federal Reserve Policy: The Federal Reserve's monetary policy decisions, particularly interest rate changes, can have a substantial impact on stock prices. Rising interest rates can make borrowing more expensive for businesses and reduce the attractiveness of stocks relative to bonds.
Geopolitical Events:
Global Events: Political instability, trade wars, or natural disasters can affect market sentiment and stock prices.
Investor Sentiment:
Risk Appetite: Market sentiment can shift rapidly, influencing stock prices. During periods of risk aversion, investors may be more likely to sell stocks.
Forecasting Methods:
Fundamental Analysis: This method involves analyzing economic indicators, corporate earnings, and other factors to assess the underlying value of stocks.
Technical Analysis: This approach uses historical price data and charts to identify patterns and trends that may predict future price movements.
Quantitative Analysis: This method employs statistical models and algorithms to analyze large datasets and identify correlations between variables that may influence stock prices.
It's important to note that no forecasting method is foolproof. Stock markets are highly volatile, and unexpected events can significantly impact prices. A combination of fundamental, technical, and quantitative analysis can provide a more comprehensive understanding of market dynamics.
Would you like to explore any of these factors or methods in more detail? I can also provide information on specific forecasting tools or resources.
The forecasting of SOLUSDThe forecasting of SOLUSD prices can be a complex task influenced by various factors, including market sentiment, economic conditions, technological developments, and regulatory changes. While there's no guaranteed method to predict future prices, here are some approaches that can be considered:
1. Technical Analysis:
Chart Patterns: Identify recurring patterns in price charts, such as head-and-shoulders, triangles, or double tops/bottoms, to anticipate potential price movements.
Indicators: Use technical indicators like moving averages, relative strength index (RSI), and Bollinger Bands to gauge overbought/oversold conditions and potential trend reversals.
2. Fundamental Analysis:
Market Sentiment: Assess the overall sentiment towards SOLUSD and Solana, considering factors like news, social media discussions, and investor behavior.
Economic Factors: Evaluate the impact of macroeconomic factors, such as interest rates, inflation, and global economic growth, on the cryptocurrency market.
Technological Developments: Analyze advancements in Solana's technology, including scalability improvements, new features, and partnerships, as they can influence investor confidence and demand.
Regulatory Landscape: Monitor regulatory developments in the cryptocurrency space, both globally and domestically, as changes in regulations can significantly impact market dynamics.
3. Quantitative Analysis:
Statistical Models: Employ statistical models, such as time series analysis or machine learning algorithms, to analyze historical price data and identify patterns that could predict future movements.
Algorithmic Trading: Utilize automated trading systems that execute trades based on predefined rules and algorithms, often incorporating technical and fundamental analysis.
4. Expert Opinion:
Analysts and Forecasters: Consult the opinions of financial analysts, cryptocurrency experts, and market forecasters who may provide insights into potential price trends.
5. Risk Management:
Diversification: Consider diversifying your cryptocurrency portfolio to manage risk and reduce exposure to potential price fluctuations.
Stop-Loss Orders: Set stop-loss orders to limit potential losses if the price moves against your expectations.
6. Disclaimer:
Past Performance: Remember that past performance is not indicative of future results. Cryptocurrencies are highly volatile, and prices can fluctuate significantly.
Research and Due Diligence: Conduct thorough research and due diligence before making any investment decisions in cryptocurrencies.
It's important to note that forecasting cryptocurrencies involves inherent risks, and there's no foolproof method to guarantee accurate predictions. Combining multiple approaches and staying informed about market developments can help you make more informed investment decisions.
I hope this information is helpful!
GBPNZD: Expecting Bearish Continuation! Here is Why:
It is essential that we apply multitimeframe technical analysis and there is no better example of why that is the case than the current GBPNZD chart which, if analyzed properly, clearly points in the downward direction.
❤️ Please, support our work with like & comment! ❤️
The forecasting of SOLUSD pricesThe forecasting of SOLUSD prices can be a complex task influenced by various factors, including market sentiment, economic conditions, technological developments, and regulatory changes. While there's no guaranteed method to predict future prices, here are some approaches that can be considered:
1. Technical Analysis:
Chart Patterns: Identify recurring patterns in price charts, such as head-and-shoulders, triangles, or double tops/bottoms, to anticipate potential price movements.
Indicators: Use technical indicators like moving averages, relative strength index (RSI), and Bollinger Bands to gauge overbought/oversold conditions and potential trend reversals.
2. Fundamental Analysis:
Market Sentiment: Assess the overall sentiment towards SOLUSD and Solana, considering factors like news, social media discussions, and investor behavior.
Economic Factors: Evaluate the impact of macroeconomic factors, such as interest rates, inflation, and global economic growth, on the cryptocurrency market.
Technological Developments: Analyze advancements in Solana's technology, including scalability improvements, new features, and partnerships, as they can influence investor confidence and demand.
Regulatory Landscape: Monitor regulatory developments in the cryptocurrency space, both globally and domestically, as changes in regulations can significantly impact market dynamics.
3. Quantitative Analysis:
Statistical Models: Employ statistical models, such as time series analysis or machine learning algorithms, to analyze historical price data and identify patterns that could predict future movements.
Algorithmic Trading: Utilize automated trading systems that execute trades based on predefined rules and algorithms, often incorporating technical and fundamental analysis.
4. Expert Opinion:
Analysts and Forecasters: Consult the opinions of financial analysts, cryptocurrency experts, and market forecasters who may provide insights into potential price trends.
5. Risk Management:
Diversification: Consider diversifying your cryptocurrency portfolio to manage risk and reduce exposure to potential price fluctuations.
Stop-Loss Orders: Set stop-loss orders to limit potential losses if the price moves against your expectations.
6. Disclaimer:
Past Performance: Remember that past performance is not indicative of future results. Cryptocurrencies are highly volatile, and prices can fluctuate significantly.
Research and Due Diligence: Conduct thorough research and due diligence before making any investment decisions in cryptocurrencies.
It's important to note that forecasting cryptocurrencies involves inherent risks, and there's no foolproof method to guarantee accurate predictions. Combining multiple approaches and staying informed about market developments can help you make more informed investment decisions.
USD/JPY Forecast: Bullish Bias Expected – Key Factors to Watch.USD/JPY Forecast: Bullish Bias Expected – Key Factors to Watch (20/09/2024)
As we analyze the USD/JPY pair on 20/09/2024, the outlook appears to be slightly bullish for this week and next. Several key drivers are pushing the U.S. dollar higher against the Japanese yen, creating an attractive opportunity for traders. In this article, we’ll break down the fundamental factors behind this forecast and highlight the elements influencing USD/JPY price action in the coming days.
1. US Dollar Strength Bolsters USD/JPY
The strength of the U.S. dollar is a critical factor contributing to the bullish bias in USD/JPY. With the Federal Reserve signaling a commitment to maintaining high interest rates for an extended period, the greenback remains in demand. Fed officials have recently emphasized their concerns about persistent inflation, leading markets to believe that U.S. interest rates will stay elevated for longer than previously expected.
This hawkish monetary stance, coupled with strong economic data, has made the U.S. dollar more attractive to investors. As a result, USD/JPY has been moving higher, with the strong dollar likely to continue exerting upward pressure on the pair.
Key SEO keywords: USD/JPY forecast, US dollar strength, Federal Reserve policy, interest rate hike, USD/JPY price action.
2. Dovish Bank of Japan Keeps the Yen Weak
On the other side of the equation, the Japanese yen remains under pressure due to the Bank of Japan’s (BoJ) ultra-loose monetary policy. The BoJ has shown no signs of tightening monetary policy in the near term, despite global inflationary trends. Japan’s central bank continues to prioritize economic support, maintaining low interest rates while avoiding any drastic policy shifts.
This dovish stance contrasts sharply with the Federal Reserve’s hawkish policy, widening the interest rate differential between the U.S. and Japan. This is a major driver of USD/JPY’s bullish outlook, as investors gravitate towards the higher-yielding U.S. dollar over the lower-yielding yen.
Key SEO keywords: Bank of Japan policy, Japanese yen weakness, dovish BoJ, USD/JPY interest rate differential, yen depreciation.
3. Interest Rate Differentials Favor USD/JPY Upside
One of the most important factors pushing USD/JPY higher is the widening interest rate differential between the U.S. and Japan. While U.S. Treasury yields remain attractive, the yield on Japanese government bonds remains low due to the BoJ’s dovish policy stance. This gap in yields makes the U.S. dollar more appealing for investors seeking better returns.
The widening interest rate gap is a key bullish signal for USD/JPY, as capital continues to flow into U.S. dollar-denominated assets. As long as the Federal Reserve maintains its hawkish tone, and the BoJ remains accommodative, this dynamic will likely support the bullish bias for USD/JPY.
Key SEO keywords: Interest rate differentials, U.S. Treasury yields, Japanese bond yields, USD/JPY bullish outlook, capital flows into USD.
4. Japanese Economic Weakness Adding Pressure on the Yen
Another factor supporting the bullish bias for USD/JPY is the ongoing weakness in the Japanese economy. Japan has struggled with slow economic growth and weak inflation, further justifying the BoJ’s cautious approach to monetary policy. Domestic consumption remains low, and Japan’s economic recovery has been uneven.
As a result, the Japanese yen continues to face downside pressure, while the U.S. dollar benefits from stronger economic fundamentals. This divergence between the U.S. and Japanese economies adds to the case for a stronger USD/JPY in the coming weeks.
Key SEO keywords: Japanese economic weakness, low inflation in Japan, weak yen, Bank of Japan policy, USD/JPY forecast.
5. USD/JPY Technical Analysis Suggests Further Upside Potential
From a technical standpoint, USD/JPY is showing signs of further upside. The pair has been testing key resistance levels, and if these levels are broken, we could see a more significant bullish move. The recent price action has shown strength, with USD/JPY consistently finding support at higher lows.
Traders should watch for a potential breakout above these resistance zones, as it could signal further gains for USD/JPY. With strong fundamentals supporting the pair, the technical outlook aligns with the overall bullish bias.
Key SEO keywords: USD/JPY technical analysis, key resistance levels, USD/JPY price action, bullish trend, support and resistance.
Conclusion: Bullish Bias Expected for USD/JPY
In conclusion, several fundamental and technical factors support a slightly bullish bias for USD/JPY over the next couple of weeks. The ongoing strength of the U.S. dollar, the dovish stance of the Bank of Japan, favorable interest rate differentials, and Japan’s economic challenges all point towards further upside potential for USD/JPY.
Traders and investors should closely monitor these key drivers as they make their trading decisions. As always, staying updated on central bank policies, economic data, and technical signals will be crucial in navigating the USD/JPY price action during this period.
Key SEO keywords: USD/JPY forecast, bullish bias, USD/JPY key drivers, US dollar strength, Bank of Japan policy, interest rate differential, USD/JPY technical analysis.
EUR/USD Forecast: Bearish Bias Likely to Continue – Key Drivers!EUR/USD Forecast: Bearish Bias Likely to Continue – Key Drivers for the Upcoming Weeks (20/09/2024)
As we move further into September, the EUR/USD pair faces a potential downside with a slightly bearish bias expected for this week and the next. In this analysis, we’ll break down the fundamental and technical drivers behind this forecast and explore the key factors that could influence EUR/USD price action. Traders and investors alike will want to stay informed about these crucial elements affecting the euro-to-dollar exchange rate.
1. US Dollar Strength Continues to Pressure EUR/USD
One of the primary factors driving the EUR/USD pair’s bearish outlook is the ongoing strength of the U.S. dollar. The greenback continues to benefit from a strong domestic economy, leading to increased expectations that the Federal Reserve will maintain high interest rates for an extended period. Recent data and statements from Fed officials signal confidence in the resilience of the U.S. economy, suggesting that inflationary pressures may persist longer than expected.
For EUR/USD, this creates a downward trajectory, as a stronger U.S. dollar weighs heavily on the exchange rate. As traders adjust their portfolios to reflect the higher yields available in U.S. markets, the demand for the dollar grows, pushing EUR/USD lower.
Key SEO keywords: EUR/USD forecast, US dollar strength, Federal Reserve policy, EUR/USD price action, interest rate hike, inflationary pressures.
2. Eurozone Economic Weakness Adding to Bearish Pressure on EUR/USD
On the other side of the EUR/USD equation, the Eurozone continues to face significant economic challenges. Recent data shows that the region's growth has been slower than expected, with inflation remaining persistently high. The European Central Bank (ECB) has adopted a cautious approach to raising interest rates, balancing the need to control inflation against the backdrop of sluggish industrial activity and weak consumer sentiment.
This dovish stance from the ECB, compared to the more aggressive Federal Reserve, further supports the bearish bias in EUR/USD. As the interest rate differential between the U.S. and Europe widens, the euro becomes less attractive, leading to downward pressure on the exchange rate.
Key SEO keywords: Eurozone economic weakness, ECB policy, interest rate differential, euro inflation, industrial slowdown, euro exchange rate.
3. Interest Rate Differentials Favoring the US Dollar
Interest rate differentials between the U.S. Federal Reserve and the ECB continue to favor the U.S. dollar. As the Fed maintains a hawkish stance, hinting at further rate hikes, the ECB remains cautious, primarily due to the fragility of the Eurozone economy. This divergence in central bank policies has become a key factor in the EUR/USD bearish outlook.
A widening interest rate gap is a bearish signal for EUR/USD traders, as higher yields in the U.S. attract capital away from the euro. This ongoing dynamic is expected to persist into the following weeks, continuing to favor the USD over the euro.
Key SEO keywords: Interest rate differentials, Fed vs ECB policy, hawkish Federal Reserve, EUR/USD downside risk, capital flows.
4. Geopolitical Tensions Adding Risk for the Euro
Another factor weighing on the euro is the ongoing geopolitical uncertainty, particularly related to energy issues and tensions in Eastern Europe. Any escalation in these areas could undermine confidence in the euro, as investors seek safe-haven assets such as the U.S. dollar. Given the current global landscape, this could add to the bearish pressure on EUR/USD in the weeks ahead.
Key SEO keywords: Geopolitical tensions, euro risks, energy crisis, Eastern Europe tensions, EUR/USD safe-haven flows, euro downside risk.
5. Technical Analysis – EUR/USD Testing Key Support Levels
From a technical perspective, the EUR/USD chart shows a bearish trend beginning to form. The pair is approaching key support levels, and if these are broken, we could see a sharper decline in the EUR/USD exchange rate. Recent price action suggests that resistance levels are holding firm, indicating limited upside potential for the euro in the short term.
Traders should watch for a potential breakdown of these key support areas, which could signal a further bearish move for the EUR/USD pair in the upcoming weeks.
Key SEO keywords: EUR/USD technical analysis, key support levels, resistance levels, EUR/USD chart, bearish trend.
Conclusion – EUR/USD Bearish Bias Expected to Continue
In conclusion, several fundamental and technical factors are aligning to suggest a continued bearish bias for EUR/USD over the next couple of weeks. The strength of the U.S. dollar, economic challenges in the Eurozone, interest rate differentials, geopolitical tensions, and bearish technical setups all point toward further downside risk for the euro-to-dollar exchange rate.
Traders and investors should closely monitor these drivers as they make their trading decisions in the weeks ahead. As always, staying updated on key economic data releases and central bank announcements will be crucial for navigating EUR/USD price action.
Key SEO keywords: EUR/USD forecast, bearish bias, EUR/USD key drivers, US dollar strength, Eurozone economic outlook, ECB policy, Fed interest rates, EUR/USD price action.
SPX500 Will Go Lower! Short!
Take a look at our analysis for SPX500.
Time Frame: 2h
Current Trend: Bearish
Sentiment: Overbought (based on 7-period RSI)
Forecast: Bearish
The market is approaching a significant resistance area 5,716.20.
Due to the fact that we see a positive bearish reaction from the underlined area, I strongly believe that sellers will manage to push the price all the way down to 5,672.36 level.
P.S
We determine oversold/overbought condition with RSI indicator.
When it drops below 30 - the market is considered to be oversold.
When it bounces above 70 - the market is considered to be overbought.
Like and subscribe and comment my ideas if you enjoy them!