EURO - Price will continue to grow inside rising channelHi guys, this is my overview for EURUSD, feel free to check it and write your feedback in comments👊
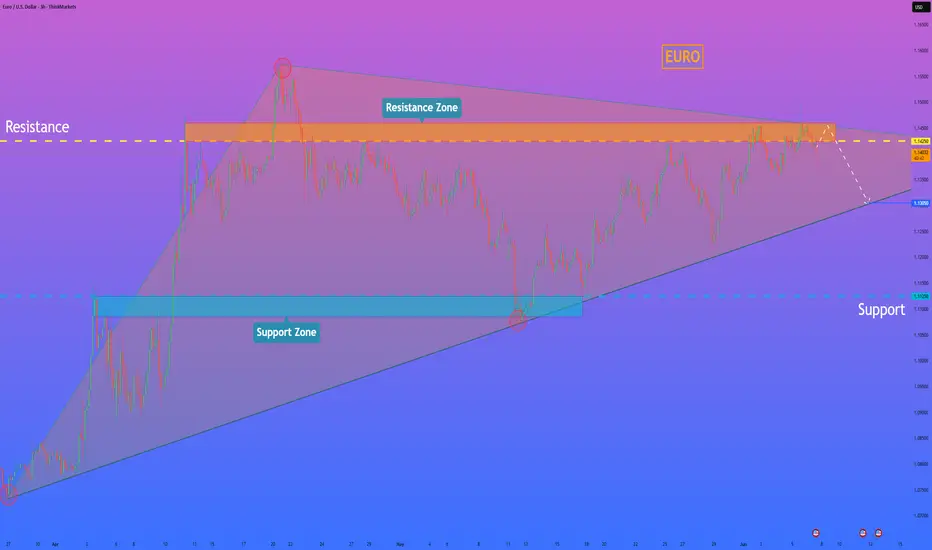
Recently, price entered to rising channel, where it soon reached the support level, which coincided with the support area.
After this movement, the price broke this level, but soon turned around and corrected the support line of the channel.
Next, EUR went back to $1.1365 level and broke it again, after which it made a retest and continued to move up.
In a short time, EUR rose to the resistance line of the channel, made a correction, and then grew to $1.1700 support level.
Price broke this level too and reached the resistance line of the channel, but not long ago corrected.
At the moment, I expect that the Euro can correct to the support line of the channel and then rise to $1.1900
If this post is useful to you, you can support me with like/boost and advice in comments❤️
Disclaimer: As part of ThinkMarkets’ Influencer Program, I am sponsored to share and publish their charts in my analysis.
Forex-analysis

GOLD - Price can bounce down from resistance line of channelHi guys, this is my overview for XAUUSD, feel free to check it and write your feedback in comments👊
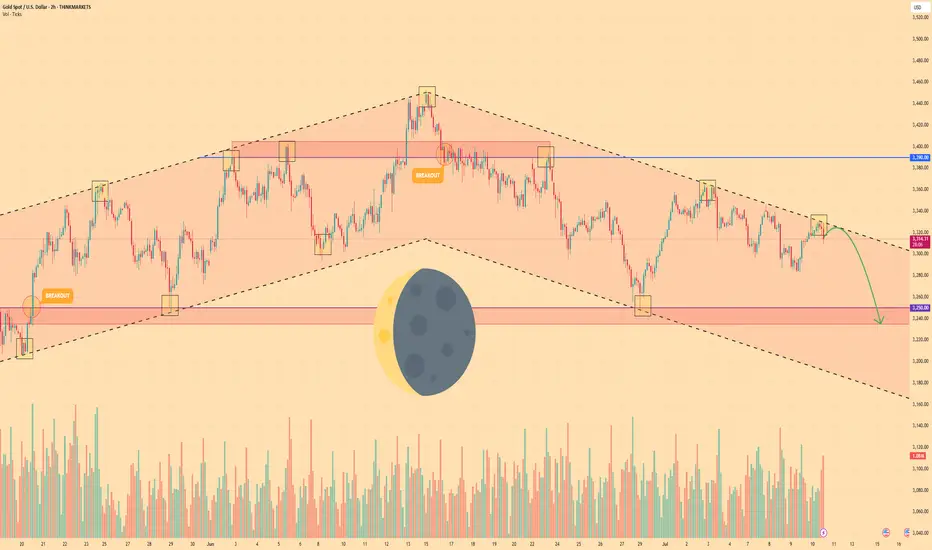
Gold broke out of its long-term rising channel and hit $3390 resistance level before momentum definitively stalled.
That failure marked a shift in control, as sellers forced price into a falling channel, establishing lower highs and lower lows.
Price fell to support level, after whcih it turned around and bounced up to resistance line of falling channel.
Now, Gold tests the upper boundary of the falling channel near $3318, where each bounce has been capped by declining volume.
Key support lies in the $3250 - $3235 area, aligned with multiple prior demand tests and the former rising-channel floor.
I expect Gold to reverse from the channel resistance and slide toward $3235, decisively breaking below the $3250 level.
If this post is useful to you, you can support me with like/boost and advice in comments❤️
Disclaimer: As part of ThinkMarkets’ Influencer Program, I am sponsored to share and publish their charts in my analysis.
EURO - Price can start to decline from resistance line of wedgeHi guys, this is my overview for EURUSD, feel free to check it and write your feedback in comments👊
Some days ago price grew to $1.1500 level and even broke it, after which started to decline in wedge.
Price declined to support line, breaking two levels, after which it turned around and started to move up.
Soon, EUR broke $1.1215 level and then rose more, after which made a correction to support line.
Then price in a short time rose to $1.1500 level, broke it one more time, and tried to grow more, but failed.
But recently it turned around and quickly rose to resistance line of wedge and now trades near.
In my mind, Euro can bounce from resistance line and fall to $1.1520 support line of wedge pattern.
If this post is useful to you, you can support me with like/boost and advice in comments❤️
Disclaimer: As part of ThinkMarkets’ Influencer Program, I am sponsored to share and publish their charts in my analysis.

XAUUSD Analysis – June Monthly CloseGold starts the week with a weak bounce attempt after a strong bearish momentum on Friday, which pushed the market below the key 3254 support. The downtrend structure remains valid with a clear pattern of lower highs and lower lows on the 4H chart.
At the moment, price is trapped inside the 3254–3295 range. Despite the strong bearish pressure, we have yet to see a meaningful correction after the sharp drop on June 28th. This opens the door for a potential intraday pullback to test minor supply and moving average resistance near 3291–3297.
However, today is monthly candle close, which means increased volatility and possible false breakouts—especially during US sessions. Traders should be cautious with breakout traps, especially around 3305–3310, where stop hunting might occur.
The bigger picture still favors the bears unless gold manages to break and hold above the descending trendline and the EMA cluster.
📌 Trade Setup (Short Bias – Intraday Correction)
SELL zone: 3291 – 3297
SL: 3303 (Above supply & EMA test zone)
TP1: 3278
TP2: 3255
TP3: 3215
This is not a high-conviction swing setup but a tactical short based on potential rejection from previous supply and dynamic resistance. Small lot size is recommended due to the wider stop-loss and low R/R reward unless high volatility plays in our favor.
📊 Key Intraday Levels
R3: 3342
R2: 3322
R1: 3295
Pivot: 3254
S1: 3214
S2: 3180
S3: 3123

HelenP. I Gold will rebound up from trend line to $3400 levelHi folks today I'm prepared for you Gold analytics. After looking at this chart, we can see how the price after a prolonged consolidation inside a large wedge pattern, XAUUSD, approached the ascending trend line again - this line has acted as a key support several times in the past. This time is no exception: the price reacted to it with a bullish bounce. We can see a confluence here — trend line support coincides with the lower boundary of the wedge and the local support zone at 3270 - 3250 points. Now the price is trading above this line, showing early signs of recovery. Given the symmetry of this structure and past behavior, I expect gold to continue rising from current levels. The nearest major obstacle lies in the resistance zone around 3400 - 3420, which acted as a turning point before. That’s why my current goal is set at the 3400 level. If bulls hold the trend line, we may see a steady move toward this key resistance. Given the trend line reaction, wedge structure, and current momentum, I remain bullish and expect further growth. If you like my analytics you may support me with your like/comment ❤️
Disclaimer: As part of ThinkMarkets’ Influencer Program, I am sponsored to share and publish their charts in my analysis.

BTCUSD : HUGE FALL AHEAD ? Sell at 106200 or below
Stoplos : 113000
Target : 100000, 90000
BTCUSD struggling hard to make new highs. Retest of 90k level expected.

Gold may exit from pennant and rise to resistance levelHello traders, I want share with you my opinion about Gold. The price previously made a strong impulse upward, forming a downward pennant, but this move lost steam after touching the seller zone around 3430 - 3440. From there, the market reversed and dropped sharply below the support level, even creating a visible gap. Didn’t last long, the price recovered quickly and made another strong move up, breaking out of the downward pennant structure. Since then, Gold has been trading inside a new formation, an upward pennant, where both support and resistance lines are gradually converging. This setup suggests growing pressure and the potential for a breakout. Currently, the price is hovering near the support line of this upward pennant. In my opinion, we may see a small correction to test this support, followed by a bullish rebound. If the structure holds, Gold could break out upward and head directly toward the 3430 resistance level, which matches the upper boundary of the previous seller zone — this is my TP 1. Given the strong impulse structure and continuation pattern, I remain bullish and expect further growth after this local retest. Please share this idea with your friends and click Boost 🚀
Disclaimer: As part of ThinkMarkets’ Influencer Program, I am sponsored to share and publish their charts in my analysis.

Euro can turn around and start to fall to support areaHello traders, I want share with you my opinion about Euro. Observing this chart, we can see how the price earlier dropped toward the 1.1360 support level and successfully broke it. Then we saw a short recovery move, but the price once again returned to the downside and retested the support line from below. After that, the market created a strong upward impulse, broke back above the 1.1360 level, and entered a phase of consolidation inside a range. This range held for some time, with price respecting both its upper and lower boundaries. Eventually, we saw a breakout from this consolidation, followed by another strong bullish impulse and a steady climb above the 1.1530 zone, where price is currently trading. However, the price has now approached a critical structure and is showing signs of weakening momentum. In my mind, the Euro may attempt one more small move up but then turn around and start declining toward the 1.1530 support level, breaking the ascending support line as well. That's why my TP is this support level, which coincides with the support area. Please share this idea with your friends and click Boost 🚀
Disclaimer: As part of ThinkMarkets’ Influencer Program, I am sponsored to share and publish their charts in my analysis.

GOLD - Price will bounce from support area and start to growHi guys, this is my overview for XAUUSD, feel free to check it and write your feedback in comments👊
Some days ago price declined to $3220 level and then started to grow, and soon reached $3380 level and even broke it.
Then price started to trades inside wedge, where it at once started to decline and in a short time declined to support line of wedge.
After this, Gold rose and broke $3220 level and continued to move up in wedge, where it also made two gaps before.
Price rose to $3380 level and some time traded very close to this level, but later corrected to support line.
Next, price made a strong impulse, breaking $3380 level and exiting from wedge as well, and continued to grow.
Recently, Gold started to fall, so I think that it will fall to support area and then bounce up to $3500
If this post is useful to you, you can support me with like/boost and advice in comments❤️
Disclaimer: As part of ThinkMarkets’ Influencer Program, I am sponsored to share and publish their charts in my analysis.


HelenP. I Gold may bounce from trend line to resistance levelHi folks today I'm prepared for you Gold analytics. After observing this chart, I see that the price tried to grow to the resistance level first, but failed and dropped to the support level, which coincided with the buyer support zone. After this correction movement, XAU rebounded up and then dropped below the support level, breaking it. But soon, price turned around and made impulse up, breaking the 3265 level, after which it continued to move up to the resistance level. When Gold reached this level, it entered to resistance zone, where it turned around at once and made a strong movement down to the trend line, breaking two levels. Also then it started to trades inside a triangle, and soon turned around from the trend line and made a strong impulse up. Price broke the 3265 support level one more time, rose a little more, and then made a correction. After this, price continued to move up and soon reached the 3395 resistance level, after which it turned around and fell to the trend line, which is the support line of the triangle as well. Recently, it started to grow, so I expect that XAUUS will correct to the trend line and then continue to move up to the resistance level. That's why the 3395 resistance level is my current goal. If you like my analytics you may support me with your like/comment ❤️
Disclaimer: As part of ThinkMarkets’ Influencer Program, I am sponsored to share and publish their charts in my analysis.

GOLD - Price can drop to support line of triangle patternHi guys, this is my overview for XAUUSD, feel free to check it and write your feedback in comments👊
In this chart price formed a triangle pattern, where it first declined to support line and then made an impulse up.
After this, Gold broke $3165 level and, after a small correction reached and broke $3400 level too.
Then it rose to resistance line of triangle and dropped below $3400 level, breaking it one more time.
Price tried to back up, but failed and dropped more to support line of triangle, after which started to grow.
In a short time price rose to resistance line of triangle, which coincided with resistance level and area.
Now, I think that Gold can drop from resistance area to $3250 point of support line of triangle.
If this post is useful to you, you can support me with like/boost and advice in comments❤️
Disclaimer: As part of ThinkMarkets’ Influencer Program, I am sponsored to share and publish their charts in my analysis.

EUR/USD - After taking the highs, are the lows next?The EUR/USD currency pair is moving between two important price levels. The top level is 1.1454 and the bottom level is 1.1357. This means the price is staying inside a range. Yesterday, the price of EUR/USD went above the top level of 1.1454. By doing this, it triggered many stop-loss orders from traders who were expecting the price to go down. These traders had placed their stop-losses just above this level, and the market moved up to take them out.
Current support of the 1H FVG
Now, the price is starting to go down again. It is getting closer to the lower level of the range, which is around 1.1357. There is a chance that the market will go below this level as well. If that happens, it may take out the stop-loss orders of traders who are expecting the price to go up. These traders often place their stop-losses just below the low point of the range. When the market goes below the low, it collects liquidity. In simple words, it grabs the orders that are waiting there.
Looking at the chart, we can see that EUR/USD has found some support at the 1-hour Fair Value Gap (1H FVG). This area is acting like a short-term floor for the price. If a full 1-hour candle closes below this support area, then the price will likely fall further. In that case, it may reach the bottom of the range and possibly move below it to take out more stop-losses.
Why below support?
But why would the market go below the low on purpose? The reason is that many retail traders, those are small traders who trade from home, often put their stop-losses just below the recent low. If the market moves there, it activates those stop-losses. These stop-losses are usually sell orders, and when they get triggered, it gives the market extra selling power. After collecting this liquidity, the market often uses the new buying interest (from other traders entering long positions) to push the price back up again.
Conclusion
So in summary, the EUR/USD is still inside a range. It has already moved above the top to take out stop-losses, and now it might go below the bottom to do the same. After that, there could be a strong move upward, powered by the new liquidity in the market.
Disclosure: I am part of Trade Nation's Influencer program and receive a monthly fee for using their TradingView charts in my analysis.
Thanks for your support.
- Make sure to follow me so you don't miss out on the next analysis!
- Drop a like and leave a comment!

HelenP. I Euro may continue to decline to trend lineHi folks today I'm prepared for you Euro analytics. In this chart, we can see how the price reached the trend line and then started to grow inside a triangle pattern. Price some time traded near the trend line and then made an impulse up to the support level, which coincided with the support zone, and then made a correction, after which it turned around and made an impulse up one more time, breaking the support level. The euro reached the resistance level, which coincided with the resistance zone, and then made a small correction, after which it continued to move up and rose to the resistance line of the triangle. But then the Euro dropped below the resistance level, breaking it, and then continued to decline, after a retest. Price fell to the support zone, where it rebounded from the trend line, which is the support line of the triangle as well, and then started to grow. The euro has grown to a resistance zone, but recently it started to fall and now trades below the 1.1425 resistance level. So, I think that EURUSD will enter to resistance zone one more time and then continue to fall to the trend line. For this case, I set my goal at 1.1305 points, which coincided with this line. If you like my analytics you may support me with your like/comment ❤️
Disclaimer: As part of ThinkMarkets’ Influencer Program, I am sponsored to share and publish their charts in my analysis.
HelenP. I Gold will reach trend line and then start to declineHi folks today I'm prepared for you Gold analytics. Observing this chart, we can see how the price traded inside the support zone, which coincided with the support level, and then dropped below. After this price turned around and made impulse up, reached the 3135 level, broke it, and made a retest. Next, price continued to move up and later it reached the resistance level, which coincided with the resistance zone, and even broke this level and rose to the trend line. But then Gold at once rebounded and fell below the 3385 level, breaking it again, and continued to decline next. When the price fell to 3215 points, it turned around and in a short time rose to the trend line, breaking the resistance level again, after which it turned around and started to fall. Gold broke the 3385 level one more time and later made a gap and then fell to the support level. But not a long time ago, it turned around and started to grow. At the moment, price has almost reached the trend line, so I expect that XAUUSD will reach the trend line finally and then rebound and start to decline. For this case, I set my goal at 3185 points. If you like my analytics you may support me with your like/comment ❤️
Disclaimer: As part of ThinkMarkets’ Influencer Program, I am sponsored to share and publish their charts in my analysis.

HelenP. I Euro may reach resistance level and break itHi folks today I'm prepared for you Euro analytics. Observing this chart, we can see how the price appears to be finding stability just above the trend line support. This zone also aligns closely with the local swing low formed after the rejection from the resistance area near 1.1270. Buyers managed to defend this key trend structure, forming a potential higher low setup within the broader bullish framework. The price is now trading below a significant resistance cluster, where both horizontal and supply pressure meet, the 1.1270 to 1.1315 zone. However, the fact that EUR is respecting the rising trend line and hasn't broken below the previous local low suggests that bullish momentum may still be intact. A corrective dip into the trend line could offer the final shakeout before a new leg upward begins. If price manages to build strength around this support and push back toward the resistance zone, a breakout becomes increasingly likely. In such a case, the market may extend toward the 1.1400 area, which I consider my current target. Given the sustained higher lows, trend support, and structure of accumulation forming below resistance, I expect EURUSD to continue pushing upward after this retest phase. If you like my analytics you may support me with your like/comment ❤️
Disclaimer: As part of ThinkMarkets’ Influencer Program, I am sponsored to share and publish their charts in my analysis.

Gold has recently broke through the call entry!Market Analysis Update: Gold Price Movement
Gold has recently broken through the Call Entry (CE) level of the 1-hour Fair Value Gap (FVG), indicating a possible continuation of upward momentum in the short term. Based on current price action and technical indicators, we are expecting gold to continue moving higher. This move may potentially target the liquidity resting above previous swing highs, as traders' stop losses in those areas are likely to be triggered, fueling the upward trend.
Once this liquidity is cleared, there is a notable resistance zone marked in the 3270–3274 range, commonly referred to as the "black zone." This area is likely to act as a key decision point. If price reaches this zone and exhibits signs of bearish confirmation (such as rejection candles, divergence, or other reversal signals), there may be a potential selling opportunity from that level.
Additionally, it is worth noting that there is a trendline drawn below the current market structure, which may also attract price action. This trendline represents another area where liquidity might be collected before any significant directional move occurs.
Thank you for your attention to this analysis. If there is anything in the explanation that you find unclear or if you have questions about specific terms or concepts, feel free to ask for clarification.

GOLD - Price can make correction movement to support levelHi guys, this is my overview for XAUUSD, feel free to check it and write your feedback in comments👊
A few moments ago, the price traded inside a little flat, where it declined to the bottom part and then started to grow.
In a short time, it reached the $2955 level, broke it and started to trades inside a big flat, exiting from a small range.
After this movement, the price reached the top part of the flat and then corrected, after which it entered to pennant.
In the pennant pattern, Gold exited from a flat and rose to the resistance line from the support line, breaking the $3205 level.
Also recently, price made a correction, but then it turned around and bounced up, thereby exiting from pennant.
Now, I think that Gold can rise a little and then start to decline to $3205 support level.
If this post is useful to you, you can support me with like/boost and advice in comments❤️

XAUUSDWe have two scenarios in the analysis: either a rise in the form of a trend, a staircase, or a deep correction and taking the buy zone. We wait for the deep correction of the market and taking the buy zone. However, if it rises in the form of a staircase, we will renew the entry, but in the event of any entry, geopolitical situations end the analysis and we analyze another analysis or another renewal.

Gold can correct to support level and then continue to move upHello traders, I want share with you my opinion about Gold. After studying this chart, we can track the progression of Gold's price action from strong bullish momentum to its current consolidation. Initially, the market trended confidently inside an upward channel, with steady growth supported by the lower boundary of the channel and occasional corrections after touching the resistance line. Each pullback respected previous support zones, a strong signal of buyer control at the time. The most impulsive move came after the price exited the buyer zone, followed by a clean breakout above the resistance line of the channel. However, once the price entered the seller zone, we saw the momentum start to fade. A strong rejection occurred near the resistance level at 3370, which eventually triggered a series of lower highs and shifted the market into a more neutral, range-bound phase. Currently, Gold is trading inside a defined range between 3205 and 3370. The bottom of this range aligns perfectly with the buyer zone, which already acted as a strong support during the last decline. We can also observe the market beginning to show signs of reversal after tapping the zone again. Given the reaction from the support area and the structure of the range, I expect the price can bounce back and make another attempt to reach the 3370 resistance level, which is my TP1 for this scenario. Please share this idea with your friends and click Boost 🚀

TA for FX,Indices and many More!(Week 17,28Apr25)Hello fellow traders , my regular and new friends!
Which pairs or instruments should we keep a look out for?
For me I am looking at :
potentially more pullback (down) on EURUSD and the majors.(stronger USD)
SNP might have a day or 2 of upside and pullback (chance for long on the change in daily trend)
Potential H&S on EurGbp and Gold.
BTC to see potential long if there's decent pullback.
NFP this week, BOJ interest rate release as well! Take note!
Do check out my recorded video for more insights!
Do Like and Boost if you have learnt something and enjoyed the content, thank you!
-- Get the right tools and an experienced Guide, you WILL navigate your way out of this "Dangerous Jungle"! --

Euro can drop from top part of range and fall to support levelHello traders, I want share with you my opinion about Euro. Recently, price continued to grow inside a well-defined upward channel, maintaining a steady structure of higher highs and higher lows. The move started after a clear breakout from the buyer zone, which marked a strong bullish impulse and confirmed support near the 1.0735 level. After this breakout, the price gradually climbed, eventually entering a horizontal range, where it started to consolidate between local support and resistance. The current support level has held firm and now aligns with the lower boundary of the range as well as the support area. At the moment, the Euro is approaching the upper boundary of the range. Given the repeated reactions from this resistance zone, I expect the price to make one more push upward, retesting the top of the range, and then reverse downward toward the lower boundary, with TP1 set at 1.1270, where demand and structure are likely to react again. This short-term setup aligns with the current channel structure, the strength of the support area, and the repeated rejection from the range highs. Please share this idea with your friends and click Boost 🚀

GOLD - Price can rise a little and then correct to support areaHi guys, this is my overview for XAUUSD, feel free to check it and write your feedback in comments👊
A few days ago price traded inside a rising channel, showing steady growth and holding above support levels.
Later, Gold made several breakouts from local resistances and continued to rise within the channel borders.
Eventually price reached the upper edge of the channel and formed a local top around the $3238 level.
Recently, it made a short-term pullback and now trades just above $3165 support zone without momentum.
Currently, Gold stays in the upper part of the range but shows early weakness after a strong bullish rally.
In my opinion, Gold can decline and reach the $3140 support level during the next corrective wave down.
If this post is useful to you, you can support me with like/boost and advice in comments❤️
