Gold Forecast 30/08/2022Gold prices charted an inconclusive session at the beginning of the week amidst a small uptick in open interest. That said, further weakness should not be ruled out while the next support now emerges at $1,711 per ounce troy
Forex-analysis

EUR/USD SHORT OPPORTUNITY 0.96 INCOMINGI hate explaining myself on this bs description box but anyways ive made the word count so i dont need to explain anything now lolll. Self Explanatory Charts!
i value my time so if anyone is willing to put in the effort to learn a few things about the markets then im here to help at no costs! hit me up

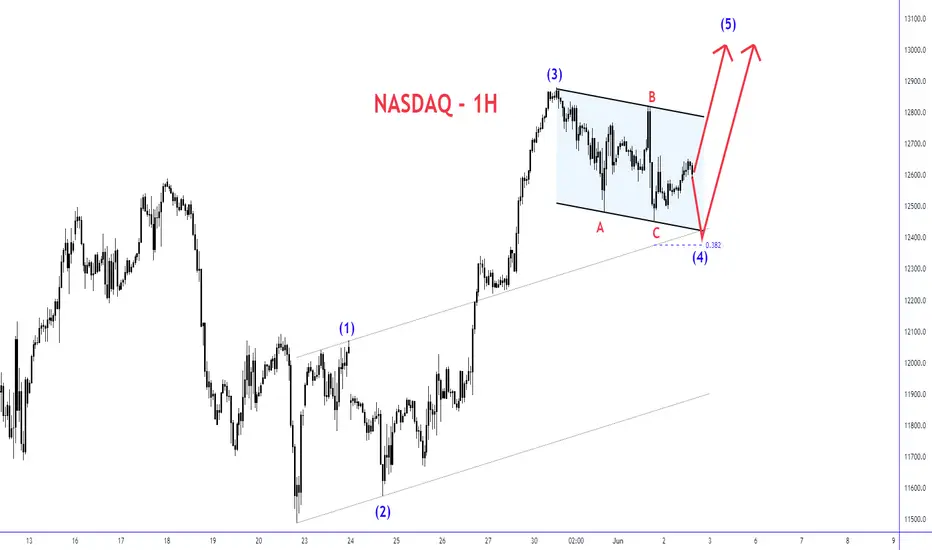
NASDAQ Stuck In Wave 4 ELLIOTT WAVE PHASEThe Nasdaq here on the 4hour timeframe is seemingly in the Elliott Wave Theory Impulse phase ( Motive ). We can see a clear 1-2-3 sequence we are expecting a 4-5 to validate the impulse pattern. Wave (4) has multiple scenarios although the main direction is the upside to complete the fifth wave, one scenario being we will still see a drop to touch the base channel and the 76.8 Fibonacci retracement level.
EUR/USD 26th of AugustE/U perfectly rejected our supply zone. Once price reached it, a bearish trend started.


US30 26th of August US20 perfectly respected our analysis, in the liquidity zone, price perfectly rejected.


EUR/USD Potential SELL 🔴 08.09.22As you can see this is the possible trend of EUR/USD , don't forget to do your own research !
Follow us for more analysis & Feel free to ask any questions you have, we are here to help.
⚠️ This Analysis will be updated ...
👤 Arman Shaban : @ArmanShabanTrading
📅 08.09.2022
⚠️(DYOR)
❤️ If you apperciate my work , Please like and comment , It Keeps me motivated to do better ❤️


EUR/USD 14th of JulyPrice used our liquidity level as a key level for a bull run during fundamental news.


NZDUSDHello Traders, here is the full analysis for this pair, let me know in the comment section below if you have any questions, the entry will be taken only if all rules of the strategies will be satisfied. I suggest you keep this pair on your watchlist and see if the rules of your strategy are satisfied.
The way I told you, you have to trade like this and you will have more profit always and you will not be a loss.

SPX500USD Shorts Coming This weekHi Traders,
S&P500 Has a similar structure to the Nasdaq and the Dow Jones, Right now I see a few points of interest where I may take a short position. I would like to see Price reach 3895 where I would look for potential sells seeing that price has made a lower high at 3950. Keep in mind that Price is yet to make a lower low and if we do reach our point of entry it may be the best place to enter the short for a lower low.
Price has left an imbalance at 4080 which still has the potential of being filled. Knowing this, I will be very conservative with the entry at 3895 where I will wait for rejection and then some sort of bearish candles before entering.
Let's be sure to smash this week, Remember to be patient disciplined, and very calculated with each trade. Many Traders tend to bring the gambler's mindset into their trading.
Best Regards,
Renaldo Philander.

EUR-CHF idea! 💡💬
Hi traders.
I use the supply-demand method for my analysis.
Check the lower timeframes for confirmation and entry. (5m,1m)
💬
What do you think about this setup?
💬
Everything I share is how I trade personally. 😉
Enter the trade by checking yourself.☑️
Do not put more than 3% of your capital at risk! ❌

USD/CHF Day Trade - LongSeeing a potential Head and Shoulder pattern on the 15 minute chart on the USD/CHF pair.
~.95823 was a target level where we wanted to take a long position, this setup could confirm a further upward move.
A bounce off of that .96000 level and a move to .96900 is what we could be seeing here.
Notable untested levels at ~.96298 and ~.96418. (Potential Resistance - areas of Take Profit)
Please leave a like and a follow would be appreciated!

USD-CHF idea! 💡💬
Hi traders.
I use the supply-demand method for my analysis.
Check the lower timeframes for confirmation and entry. (5m,1m)
💬
What do you think about this setup?
💬
Everything I share is how I trade personally. 😉
Enter the trade by checking yourself.☑️
Do not put more than 3% of your capital at risk! ❌

USD/CAD waiting for confirmationHello ,This is kamy.
we can see a good bullish movement to top of a trading range and even breaking the resistance same as the previous exhaustion movement. with this good bullish movement i'll think about buying but if i see a weakness and breaking out our triangle to start falling we go for sell
we will wait to see a confirmation and take our decision.

USD-CHF idea! 💡💬
Hi traders.
I use the supply-demand method for my analysis.
Check the lower timeframes for confirmation and entry. (5m,1m)
💬
What do you think about this setup?
💬
Everything I share is how I trade personally. 😉
Enter the trade by checking yourself.☑️
Do not put more than 3% of your capital at risk! ❌

GBP-JPY idea! 💡💬
Hi traders.
I use the supply-demand method for my analysis.
Check the lower timeframes for confirmation and entry. (5m,1m)
💬
What do you think about this setup?
💬
Everything I share is how I trade personally. 😉
Enter the trade by checking yourself.☑️
Do not put more than 3% of your capital at risk! ❌
