Forex-analysis


EURUSD
English
If the market falls to the point of touching the support line and continue upwards until it touches the trend of the days that have passed, two things can occur: the candle can break as well as re-adjust the trend or it can remain how it was and then continue with a downward trend in which one will start looking for possibilities of sale. Now, if the market falls below the support line it will be changed to a resistance line. This will cause the market to stop its movement that it was carrying, therefore one would look for sales until we expect it to reach a strong point of support and notice if it breaks in order to see if it keeps on going down. We must also work with the indicators that are considered to be currently in an overbought area during a duration of 4 hours; the possibility that it falls at least to that support point is somewhat strong, but you always have to wait while the market is in action.
These are the possible advances for this week for this pair.
Spanish
Si el mercado cae hasta el punto de tocar el soporte, se mantendrá y continuará hacia arriba hasta que toque la tendencia de días en el cual puede llegar la vela a romperla y retestearla donde llegará un cambio de tendencia, o que permanezca en ella y luego continúe con su tendencia a la baja en lo cual uno comenzará a buscar ventas. Ahora, si el mercado cae por debajo de la línea de soporte será cambiado a una línea de resistencia, causando que el mercado deje de hacer el movimiento que llevaba y tendríamos que buscar ventas mientras que esperamos que alcance un punto de soporte fuerte en lo cual se pueda ver si se termina de romper y si sigue bajando. También debemos trabajar con los indicadores que actualmente en una duración de 4 horas se encuentra en un área de sobrecompra, la posibilidad de que caiga al menos hasta ese punto de soporte es más o menos fuerte pero siempre hay que esperar mientras el mercado actúa .
Estos son los posibles avances para esta semana de este par.


USDCHF - FOREX - 15. SEPT. 2019Welcome to our weekly market Breakdown ( USDCHF )!
-
1 HOUR
Bullish move after forming new h1 lows.
4 HOUR
Small bearish pullback in a bullish market.
DAILY
Bullish moving market with several pullbacks.
OVERALL
Expecting prices to form new highs before heading back down to
average price movement and range. Will update you once we
have more confirmations.
Good luck
-
Leave us a comment or like to keep our content for free and alive.
Have a great week everyone!
ALAN

GBPNZD 14/09/2019Hello Traders!
We play with Smartmoney concepts, that means that we look mostly on PA to determine what will happen in future.
As we all know, price is moved by BIG players: Banks, Institutional traders, HFT bots (we call them all of them SM).
They can't play as we do, cause of a HUGE lot sizes, so cause of that they need to SELL to BUY and BUY to SELL for positioning them self in the best possible spot.
If u were learn about trading from free and accessible knowledge, u probably heard about BUYing LOW and SELLing HIGH?
So SM must BUY LOWER and SELL HIGHER :)
We as retail traders are just a small fish in this ocean, so we need to catch the waves which are created by SM.
CHARTS AGENDA:
SM - SMART MONEY
PA - PRICE ACTION
HEC - HIGH ENERGETIC CANDLE (LAST OPPOSITE CANDLE BEFORE MOVE) <- SM MUST SELL TO BUY AND BUY TO SELL :)
BITCOIN SIGN - MONEY POCKET (SL, BUY STOPS, SELL STOPS) - EQH - EQUAL HIGHS / EQL - EQUAL LOWS
BLACK ARROWS ARE ABOVE AND BELOW THESE MONEY SPOTS POINTING FUTURE TARGET
BLUE LINES - ENTRIES WITH SMART MONEY MITIGATION MOVE - SNIPER ENTRY FOR US
BLACK LINES FOOT PRINTS - SPOTS ON CHART WHERE SMART MONEY SHOULD COME BACK TO GET OUT OF THEIR POSITIONS IN DRAWDOWN (SM MUST SELL TO BUY AND BUY TO SELL) - POTENCIAL SNIPER ENTRIES
BLACK BOX - GAP's (IPA - INSUFFICIENT PRICE ACTION) - SPOTS ON CHART WHERE PRICE MOVED TOO FAST, AND LEFT SOME "WHOLES" IN PRICE ACTION WHERE ALGORITHMS WHAT TO COME BACK AND FILL IT BY "HEALTHY" PA.
If u have any questions feel free to ask:)
GOD BLESS U ALL!

EURGBP 14/09/2019 H1Hello Traders!
We play with Smartmoney concepts, that means that we look mostly on PA to determine what will happen in future.
As we all know, price is moved by BIG players: Banks, Institutional traders, HFT bots (we call them all of them SM).
They can't play as we do, cause of a HUGE lot sizes, so cause of that they need to SELL to BUY and BUY to SELL for positioning them self in the best possible spot.
If u were learn about trading from free and accessible knowledge, u probably heard about BUYing LOW and SELLing HIGH?
So SM must BUY LOWER and SELL HIGHER :)
We as retail traders are just a small fish in this ocean, so we need to catch the waves which are created by SM.
CHARTS AGENDA:
SM - SMART MONEY
PA - PRICE ACTION
HEC - HIGH ENERGETIC CANDLE (LAST OPPOSITE CANDLE BEFORE MOVE) <- SM MUST SELL TO BUY AND BUY TO SELL :)
BITCOIN SIGN - MONEY POCKET (SL, BUY STOPS, SELL STOPS) - EQH - EQUAL HIGHS / EQL - EQUAL LOWS
BLACK ARROWS ARE ABOVE AND BELOW THESE MONEY SPOTS POINTING FUTURE TARGET
BLUE LINES - ENTRIES WITH SMART MONEY MITIGATION MOVE - SNIPER ENTRY FOR US
BLACK LINES FOOT PRINTS - SPOTS ON CHART WHERE SMART MONEY SHOULD COME BACK TO GET OUT OF THEIR POSITIONS IN DRAWDOWN (SM MUST SELL TO BUY AND BUY TO SELL) - POTENCIAL SNIPER ENTRIES
BLACK BOX - GAP's (IPA - INSUFFICIENT PRICE ACTION) - SPOTS ON CHART WHERE PRICE MOVED TOO FAST, AND LEFT SOME "WHOLES" IN PRICE ACTION WHERE ALGORITHMS WHAT TO COME BACK AND FILL IT BY "HEALTHY" PA.
If u have any questions feel free to ask:)
GOD BLESS U ALL!

Longterm AB = CD on GBPJPYGBPJPY price is at a historic low. The price was at this point exactly 3 years ago.
This was how it played out then...
If the price touches or plays around 125... will definitely open a long position... Unfortunately missed this last week as I was occupied in moving houses...
Hopefully, the price action will be generous enough...

GBP/USD BUY (RETEST OF 1.22500)My BIAS for GBP/USD for the upcoming week is BUY.
My reasons behind this are
1. Price has just broken above our Daily Resistance.
2.Price has retested our Daily Resistance and bounced straight back up sitting currently just above the previous high made on the 4HR TF.
What I will be looking for before entering this trade.
- A retest of previous highs at 1.22500
- A strong Bullish Rejection Candlestick
- Price to not fall below recent lows at 1.22000.
I will be looking to enter my trade around 1.22500
Taking profits at 1.23800 (130 pips)
Stops set at 1.22200(30 pips)
Please Like & Follow for future analysis and updates.


CADCHF: Analysis and Plan for the week ahead (15 JULY 2019)Looking at the CADCHF pair, price has been following the trend line (going upwards at 4H chart). Looking at the 1H chart, the price has been staying at the SUPPORT. The price has been having some difficulties to break the SUPPORT level. Therefore there is a probability that the price will be going bullish.
Disclaimer: These are only an idea or a point of view of what will happen in the market. Please do your own analysis for more confirmation and do not copy blindly. I will not be responsible for any losses if you follow the idea. These ideas are meant for sharing and learning for those who are still new and learning like me. Please manage your risk-reward accordingly as it is very crucial. You are allowed at any moment to leave any comments below as those comments will be taken as a learning point or reviews. Trade at your own risk and good luck.

USDINR Short BiasWelcome to everyone!
Today we are stick with usdinr. Price action shows a small retracement then a good drop could possible.
We never use indicators, news etc in supply and demand we just follow odds and price actions and rules of our strategy.
Happy Trading

SHORT AUDCAD: Analysis and Plan for the week ahead (26JUNE2019)I am still new to this but I am still learning. I am just sharing of what I feel through the analysis that I did while the market was closed on the weekends.
We are looking at the AUDCAD pair. Currently this pair is in down ward trend. The price is currently hitting the monthly high key level. I have plotted the trend line accordingly from Lower Highs to Lower Lows. From what it looks like it will be going upwards for a bit to hit the weekly high key line and then chances that it will continue to go downwards.
Next Move: Wait for the price to hit the weekly high and bounce down wards. Once you see the price action going down wards, confirm and then take a SELL. From experience, it might go down to the weekly low and create a double bottom.

EURUSD: Analysis and Plan for the week ahead (2JUNE2019)What we are looking right now below is the 4H chart. Reason for me to show this is because I feel that the pair is currently respecting the trend line.
If the pair continues to respect the trend line, the pair will not go above the trend line (diagonal red line).
Next Move: Will be observing for the next candle stick. If the next candle stick goes bearish, I will take a SELL on this. My plan for this pair is to go for SELL. Otherwise, I will not take any actions yet until it is much clearer. (If the candlestick goes to touch the trend line.
Disclaimer: These are only an idea or a point of view of what will happen in the market. Please do your own analysis for more confirmation and do not copy blindly. I will not be responsible for any losses if you follow the idea. These ideas are meant for sharing and learning for those who are still new and learning like me. Please manage your risk-reward accordingly as it is very crucial. You are allowed at any moment to leave any comments below as those comments will be taken as a learning point or reviews. Trade at your own risk and good luck.

Prepare for going long on GBP/USD by ThinkingAntsOk1H CHART EXPLANATION:
As we can observe, price is making a double bottom at the Support Zone. If the upside movement is confirmed, price has potential to reach the Resistance Zone. We will wait for a price action confirmation like a breakout of the structure and a bullish candlestick pattern to take any position.
4H CHART:
*Please note that the above perspective is our view on the market, we do not provide signals and take no responsibility for your trades.

USDSGD Daily Supply Demand Analysisbased on the daily/monthly TF im bearish usdsgd, i think the institutions are showing evidence/footprints they are trying to sell here
this pair is on my radar.

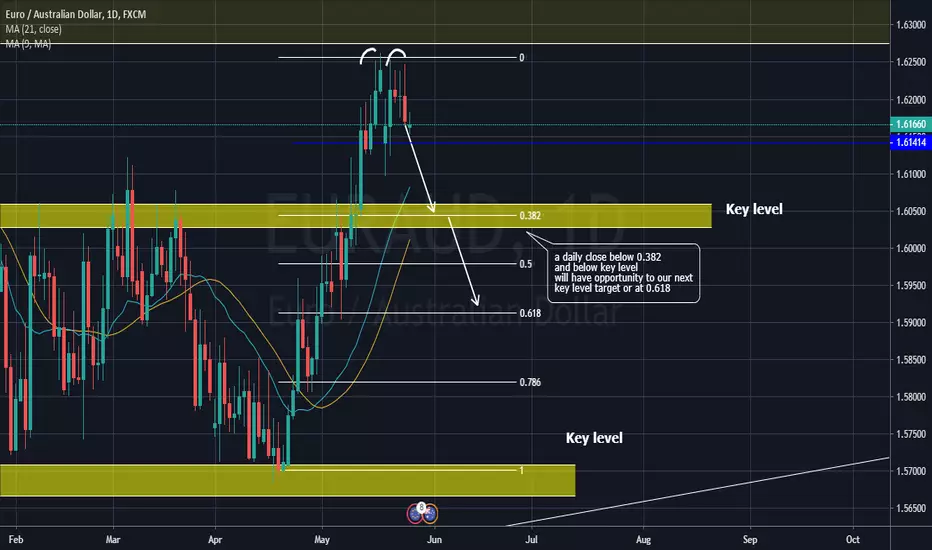
EURAUDwe on the resistance level, we can see a clear double top
a daily close below blue line will see a confirmation for a downside


"Trade Idea" on GBP/USD by ThinkingAnts1H CHART EXPLANATION:
Here are both short and long scenarios that we explained on the 4H chart. Of course this forecast is not perfect but it is the idea, in the case of the long trade we will wait to the Descending Channel to be broken, and then a correction to take long positions. And the short trade, we will wait to the Support Zone to be broken and then a consolidation below, it can be a corrective pattern such as a flag/triangle/pennant to place short trades.
4H CHART:

"Top and Bottom Analysis" EUR/GBP by ThinkingAntsOk4H CHART EXPLANATION:
In 4H timeframe we observe that price has broke Resistance Zone 1 at 0.86750. The upside movement has potential to reach Resistance Zone 2 at 0.88275 in the short term, and if that zone is broken, then it could face Resistance Zone 3 at 0.9050 in the middle term.
Updates comming soon!
MULTI TIMEFRAME VISION:
Weekly:
Daily:
